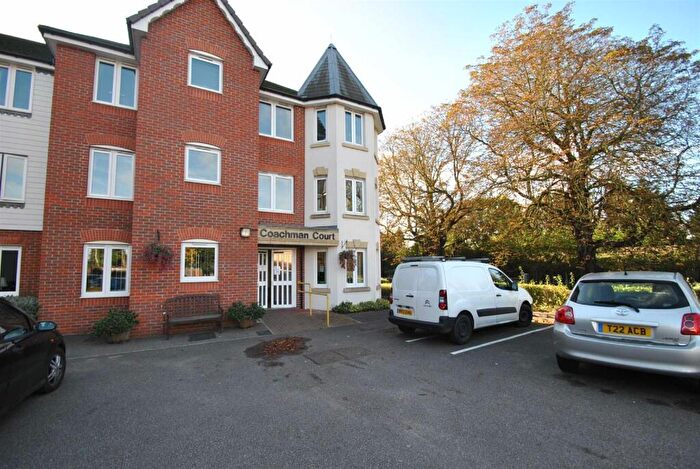
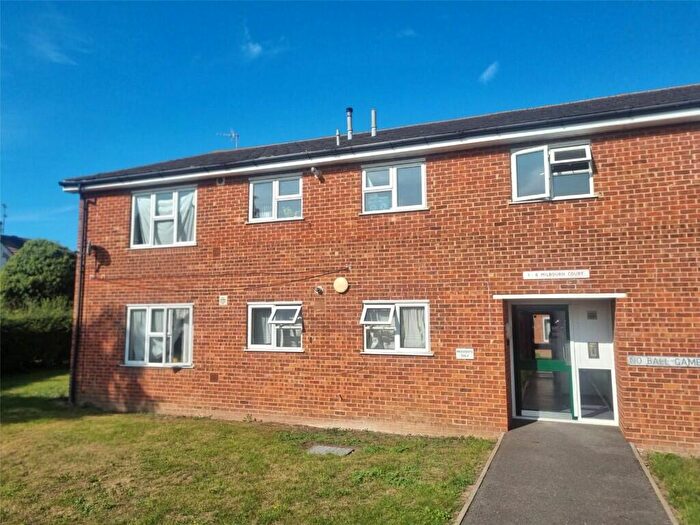
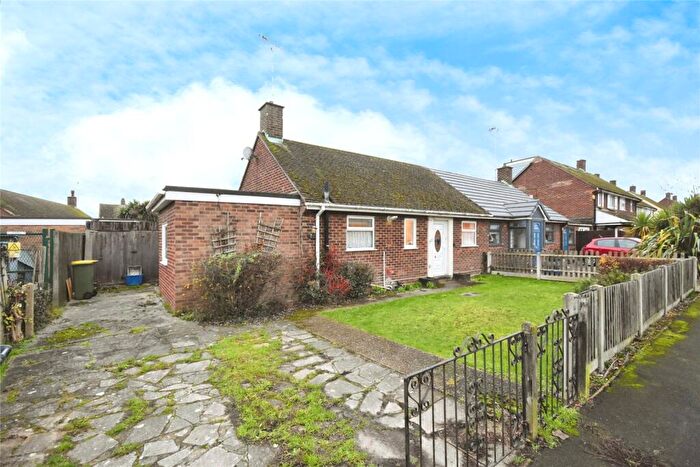
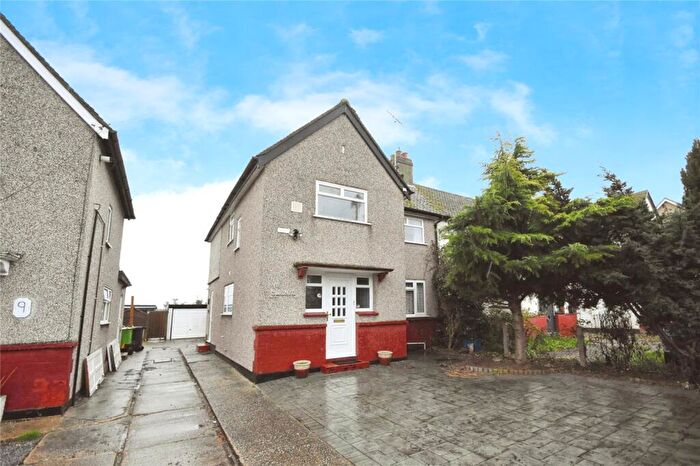
Houses for sale & to rent in Rochford, Rochford
House Prices in Rochford
Properties in Rochford have an average house price of £352,928.00 and had 387 Property Transactions within the last 3 years¹.
Rochford is an area in Rochford, Essex with 2,874 households², where the most expensive property was sold for £10,200,000.00.
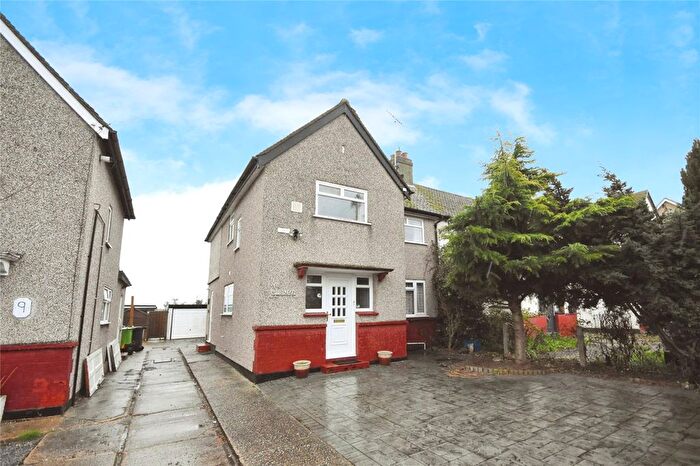
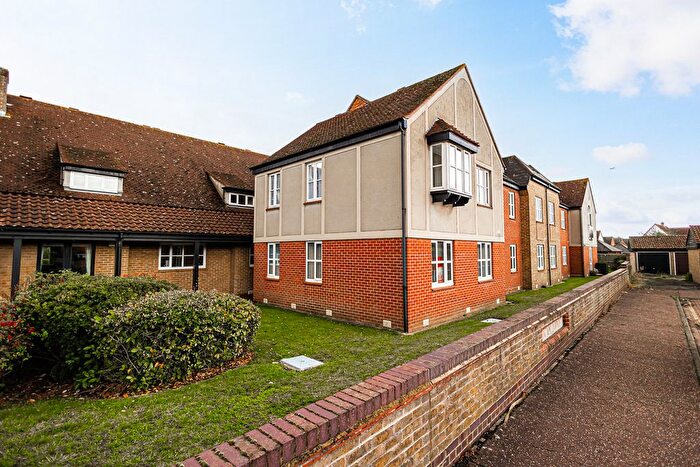
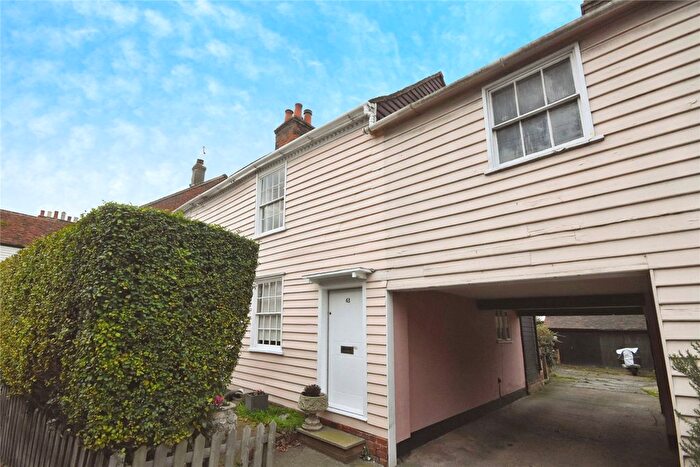
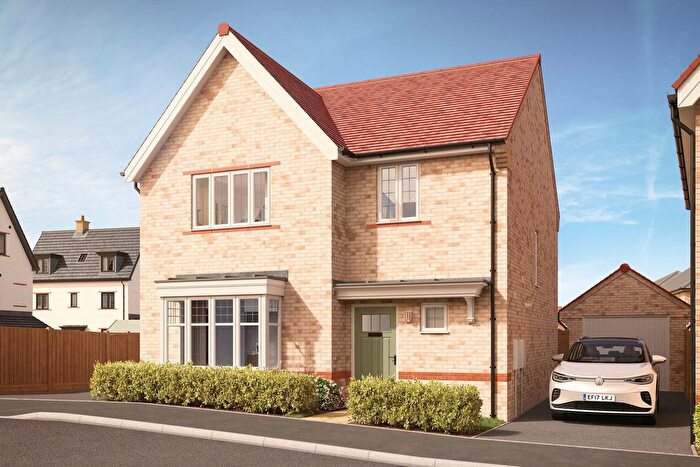
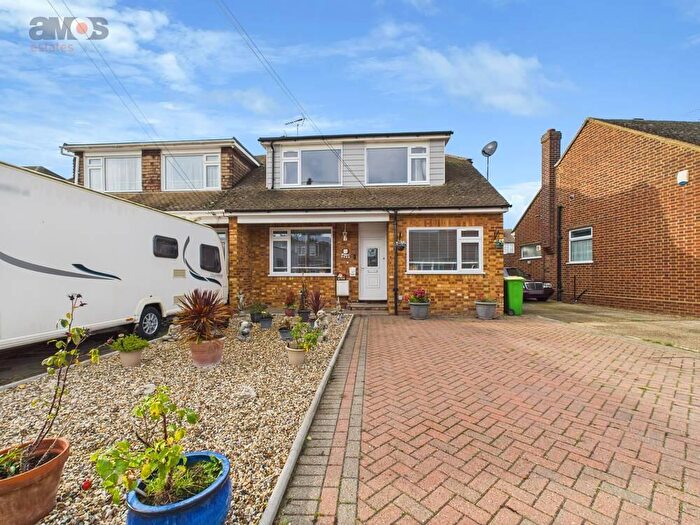
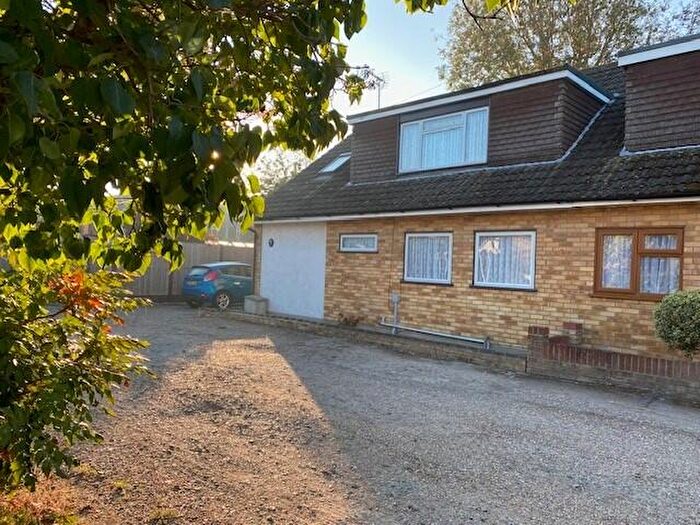
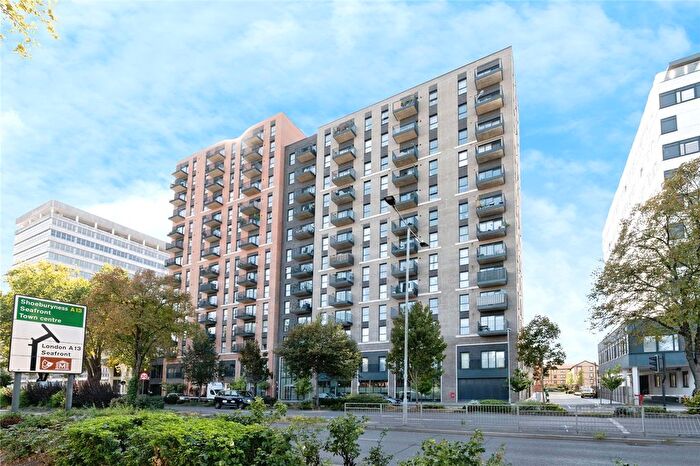
Properties for sale in Rochford
Roads and Postcodes in Rochford
Navigate through our locations to find the location of your next house in Rochford, Rochford for sale or to rent.
| Streets | Postcodes |
|---|---|
| Alvina Cottages | SS4 1PQ |
| Anne Boleyn Drive | SS4 1JA |
| Ashingdon Road | SS4 1FF SS4 1NJ SS4 1RD SS4 1RE SS4 1RR |
| Back Lane | SS4 1AY |
| Bobbing Close | SS4 1RY |
| Brayers Mews | SS4 1XF |
| Brook Close | SS4 1HN |
| Church Walk | SS4 1NL |
| Clements Mews | SS4 1FZ |
| Coombes Grove | SS4 1DX |
| Dalys Road | SS4 1FP SS4 1RA |
| Doggetts Close | SS4 1ED |
| East Street | SS4 1DB SS4 1DF SS4 1EQ |
| Featherby Way | SS4 1LD |
| Greenways | SS4 1AG |
| Hall Road | SS4 1NN SS4 1NT SS4 1NX SS4 1PD |
| Heritage Way | SS4 1XA |
| King Henrys Drive | SS4 1HY |
| Leicester Avenue | SS4 1JL |
| Lingfield Drive | SS4 1DZ SS4 1EA |
| Locks Hill | SS4 1FR |
| Malting Villas Road | SS4 1AE SS4 1AF SS4 1RU |
| Middle Mead | SS4 1RJ SS4 1RL SS4 1UY |
| Millview Meadows | SS4 1EF |
| Mornington Avenue | SS4 1DN SS4 1DW |
| North Street | SS4 1AB SS4 1AD |
| Oak Road | SS4 1NR SS4 1NS |
| Oast Way | SS4 1RX SS4 1RZ |
| Old Ship Lane | SS4 1DD |
| Ormonde Avenue | SS4 1QW |
| Patricia Villas | SS4 1PE |
| Pelhams Farm Cottages | SS4 1PF |
| Percy Cottis Road | SS4 1QN |
| Pollards Close | SS4 1GB SS4 1GF SS4 1GJ |
| Pollards Court | SS4 1GH |
| Prentice Close | SS4 1AQ |
| Purdeys Way | SS4 1ND |
| Queen Elizabeth Chase | SS4 1JJ |
| Queensland Avenue | SS4 1JH |
| Ravenswood Chase | SS4 1JF |
| Regency Close | SS4 1XD |
| Roche Close | SS4 1PS SS4 1PU SS4 1PW |
| Rochefort Drive | SS4 1HT |
| Rocheway | SS4 1DQ |
| Rochford Garden Way | SS4 1QH SS4 1QJ SS4 1QL SS4 1QR SS4 1QS |
| Rochford Hall Close | SS4 1HF |
| Russell Grove | SS4 1DU |
| Somerset Avenue | SS4 1QA SS4 1QB |
| South Street | SS4 1BL SS4 1BQ |
| Southend Road | SS4 1HB SS4 1HE SS4 1HH SS4 1HQ SS4 1HX SS4 1JB SS4 1JD |
| Sovereign Close | SS4 1XB |
| Spindle Beams | SS4 1EH |
| St Andrews Road | SS4 1NP |
| St Marys Cottages | SS4 1PG |
| Stambridge Road | SS4 1DG SS4 1DP SS4 1DT SS4 1DY SS4 1EB SS4 1EG |
| Stilwells | SS4 1EE |
| Sutton Court Drive | SS4 1HR SS4 1HS SS4 1HZ SS4 1JG SS4 1JQ |
| Sutton Road | SS4 1HJ SS4 1HL |
| The Boulevard | SS4 1QF |
| The Drive | SS4 1QD SS4 1QE SS4 1QQ |
| The Garners | SS4 1DR SS4 1DS |
| The Ridings | SS4 1HD |
| The Trunnions | SS4 1DJ |
| Tinkers Lane | SS4 1HG |
| Townfield Road | SS4 1DL |
| Tylney Avenue | SS4 1QP |
| Warners Bridge Chase | SS4 1JE |
| Warwick Drive | SS4 1HP SS4 1HW |
| Weir Pond Road | SS4 1AH |
| West Street | SS4 1AJ SS4 1AS SS4 1AU SS4 1BE |
Transport near Rochford
-
Rochford Station
-
Southend Airport Station
-
Prittlewell Station
-
Hockley Station
-
Southend Victoria Station
- FAQ
- Price Paid By Year
- Property Type Price
Frequently asked questions about Rochford
What is the average price for a property for sale in Rochford?
The average price for a property for sale in Rochford is £352,928. This amount is 6% lower than the average price in Rochford. There are 3,180 property listings for sale in Rochford.
What streets have the most expensive properties for sale in Rochford?
The streets with the most expensive properties for sale in Rochford are Hall Road at an average of £1,675,000, St Andrews Road at an average of £681,500 and Oak Road at an average of £625,333.
What streets have the most affordable properties for sale in Rochford?
The streets with the most affordable properties for sale in Rochford are The Garners at an average of £116,777, Roche Close at an average of £167,085 and Ashingdon Road at an average of £188,812.
Which train stations are available in or near Rochford?
Some of the train stations available in or near Rochford are Rochford, Southend Airport and Prittlewell.
Property Price Paid in Rochford by Year
The average sold property price by year was:
| Year | Average Sold Price | Price Change |
Sold Properties
|
|---|---|---|---|
| 2025 | £339,449 | 1% |
69 Properties |
| 2024 | £336,968 | -25% |
110 Properties |
| 2023 | £422,349 | 22% |
84 Properties |
| 2022 | £327,558 | 14% |
124 Properties |
| 2021 | £280,267 | 5% |
133 Properties |
| 2020 | £266,249 | -7% |
99 Properties |
| 2019 | £283,796 | 12% |
101 Properties |
| 2018 | £250,477 | -0,1% |
113 Properties |
| 2017 | £250,761 | -1% |
106 Properties |
| 2016 | £252,270 | 10% |
140 Properties |
| 2015 | £226,970 | 12% |
143 Properties |
| 2014 | £199,458 | 7% |
147 Properties |
| 2013 | £185,301 | 3% |
118 Properties |
| 2012 | £180,546 | -12% |
82 Properties |
| 2011 | £202,192 | 3% |
84 Properties |
| 2010 | £195,801 | 12% |
85 Properties |
| 2009 | £172,617 | -16% |
100 Properties |
| 2008 | £200,021 | 1% |
90 Properties |
| 2007 | £198,398 | 8% |
259 Properties |
| 2006 | £182,565 | -1% |
237 Properties |
| 2005 | £184,308 | 4% |
113 Properties |
| 2004 | £176,302 | 13% |
140 Properties |
| 2003 | £152,962 | 5% |
137 Properties |
| 2002 | £144,777 | 22% |
150 Properties |
| 2001 | £113,287 | 24% |
184 Properties |
| 2000 | £86,598 | 9% |
151 Properties |
| 1999 | £78,678 | 11% |
164 Properties |
| 1998 | £69,731 | -12% |
129 Properties |
| 1997 | £78,429 | 23% |
160 Properties |
| 1996 | £60,540 | 10% |
163 Properties |
| 1995 | £54,295 | - |
103 Properties |
Property Price per Property Type in Rochford
Here you can find historic sold price data in order to help with your property search.
The average Property Paid Price for specific property types in the last three years are:
| Property Type | Average Sold Price | Sold Properties |
|---|---|---|
| Semi Detached House | £356,667.00 | 135 Semi Detached Houses |
| Detached House | £731,539.00 | 64 Detached Houses |
| Terraced House | £301,926.00 | 67 Terraced Houses |
| Flat | £176,739.00 | 121 Flats |

