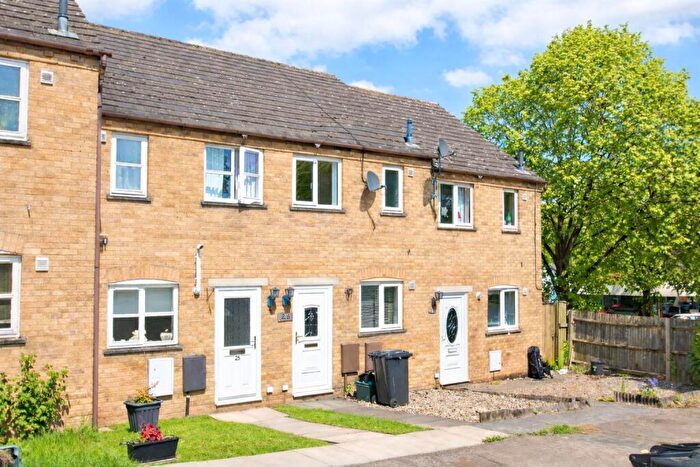
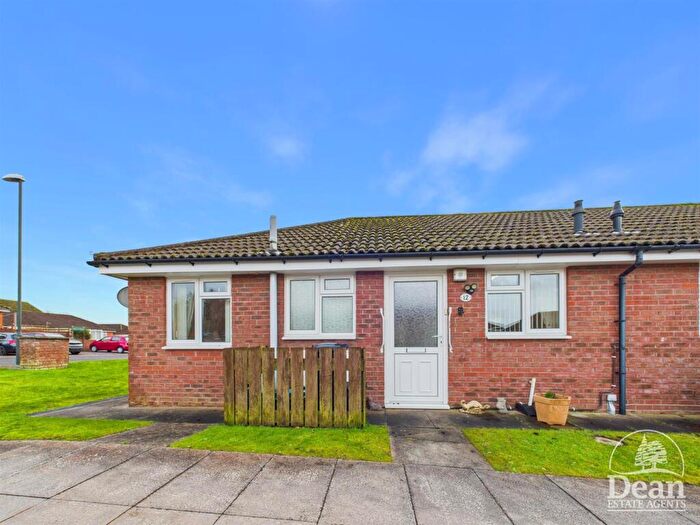
Houses for sale & to rent in Coleford Central, Coleford
House Prices in Coleford Central
Properties in Coleford Central have an average house price of £249,975.00 and had 148 Property Transactions within the last 3 years¹.
Coleford Central is an area in Coleford, Gloucestershire with 1,335 households², where the most expensive property was sold for £575,000.00.
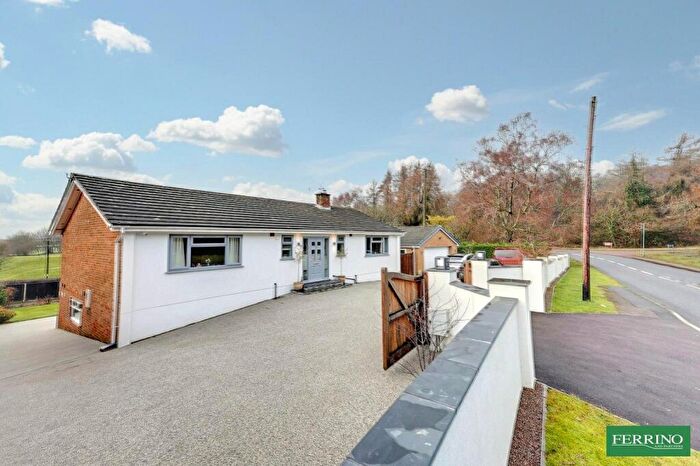
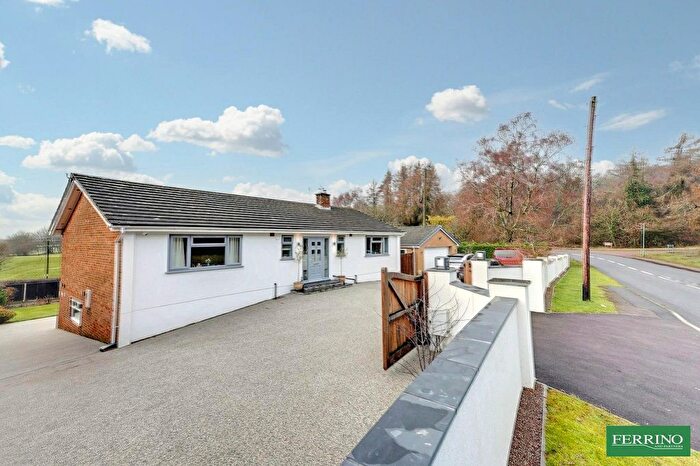
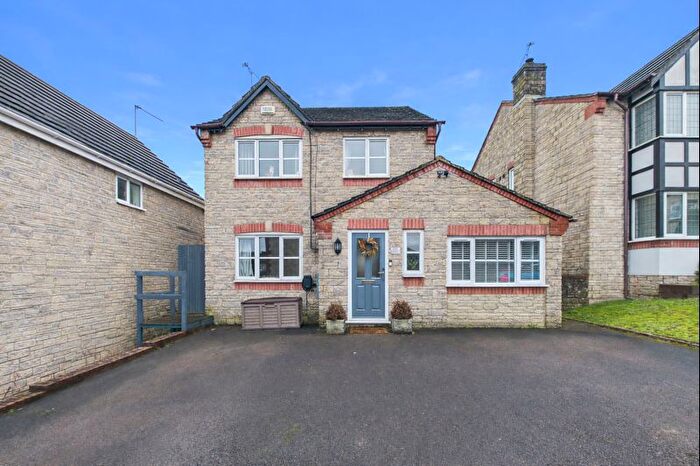
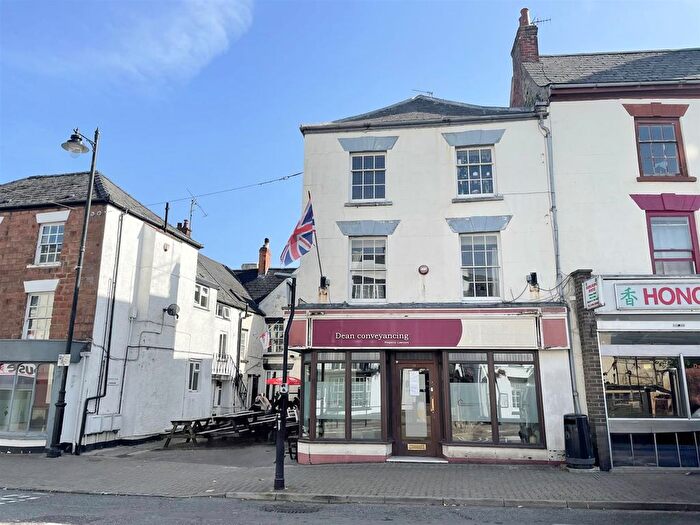
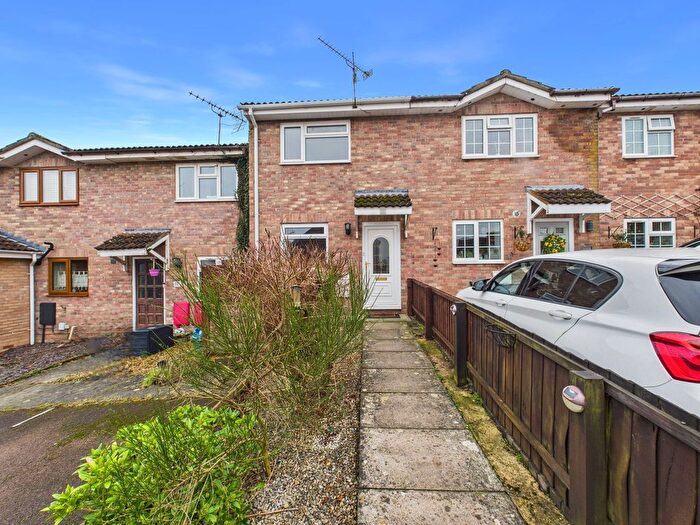
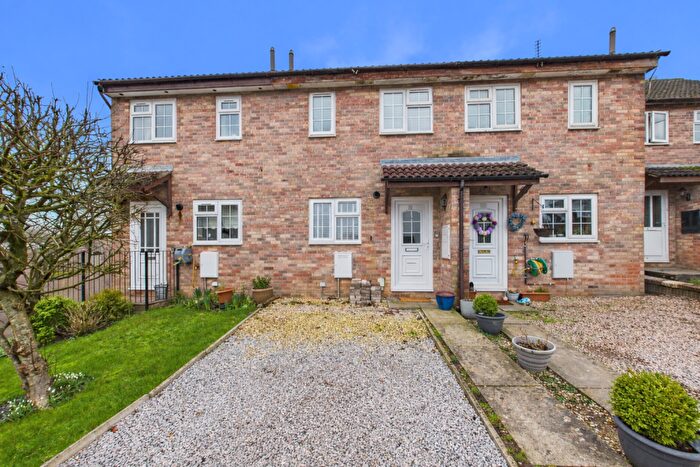
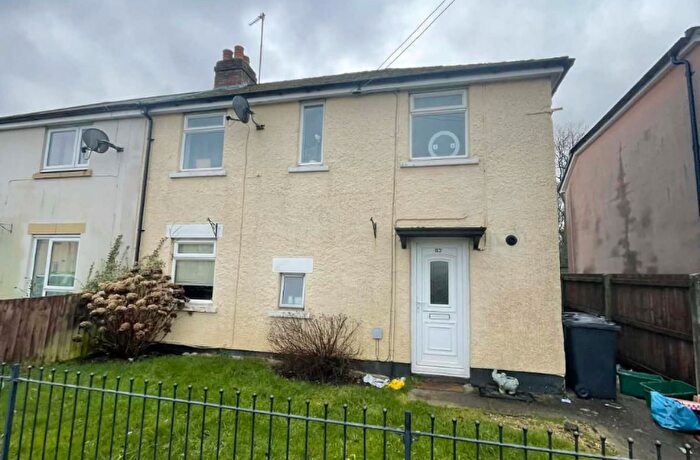
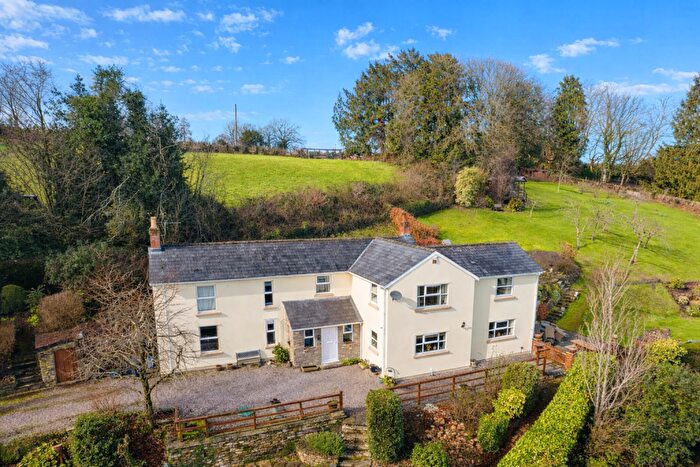
Properties for sale in Coleford Central
Roads and Postcodes in Coleford Central
Navigate through our locations to find the location of your next house in Coleford Central, Coleford for sale or to rent.
| Streets | Postcodes |
|---|---|
| Albert Road | GL16 8DY GL16 8DZ |
| Angelfield | GL16 8DJ |
| Bakers Hill | GL16 7QR |
| Bank Street | GL16 8BA |
| Battle Close | GL16 8SF |
| Bells Place | GL16 8BX |
| Berry Hill | GL16 8QN |
| Bowens Hill | GL16 8DH |
| Bowens Hill Road | GL16 8DL GL16 8DU |
| Boxbush Road | GL16 8DN |
| Bridge Road | GL16 8NE |
| Buchanan Avenue | GL16 8ED GL16 8EQ |
| Buchanan Close | GL16 8EG |
| Cinderhill | GL16 8HQ |
| Coombs Road | GL16 8AY |
| Crescent Close | GL16 8EE |
| Crossways | GL16 8QP |
| Farriers Court | GL16 8AB |
| Gloucester Road | GL16 8BH GL16 8BL GL16 8BN GL16 8BW |
| Greenfield Road | GL16 8BY |
| Grove Crescent | GL16 8AZ |
| Grove Road | GL16 8QU GL16 8RF |
| Hampshire Gardens | GL16 8HU |
| Hampshire Place | GL16 8HT |
| High Street | GL16 8HA GL16 8HF |
| Kings Meade | GL16 8RS |
| Langetts Road | GL16 8BT |
| Lark Rise | GL16 8EP |
| Lawdley Road | GL16 8SA GL16 8SB |
| Lords Gate | GL16 8RT |
| Lords Hill | GL16 8BD GL16 8BG GL16 8BJ |
| Lords Hill Close | GL16 8DT |
| Lower Berry Hill | GL16 8QG |
| Marine Gardens | GL16 8DD |
| Market Place | GL16 8AA |
| Mile End Road | GL16 7QD |
| Newland Street | GL16 8AJ GL16 8AL GL16 8AN GL16 8NA |
| Oakfields | GL16 8EN |
| Old Vicarage Court | GL16 8RR |
| Orchard Road | GL16 8AU |
| Owen Gardens | GL16 8EB |
| Park Road | GL16 8AX |
| Parkside | GL16 8DA |
| Pike Road | GL16 8DE |
| Poolway Court | GL16 8DQ |
| Poolway Place | GL16 8DF |
| Poolway Rise | GL16 8DG |
| Prospect Close | GL16 8DB |
| Sarnedge Road | GL16 8BU |
| Scowles | GL16 8QT |
| Scowles Road | GL16 8QS |
| South Road | GL16 8EJ |
| Southfield Road | GL16 8BZ |
| Sparrow Hill | GL16 8AS GL16 8AT |
| Springfield Close | GL16 8BB |
| St John Street | GL16 8AP GL16 8AR |
| Staunton Road | GL16 8DW GL16 8EA GL16 8NS GL16 8QR |
| Sunnybank | GL16 8EH GL16 8EL |
| The Crescent | GL16 8BS GL16 8EF |
| The Gorse | GL16 8QE GL16 8QF |
| The Paddocks | GL16 7PX |
| Union Road | GL16 7QB |
| Victoria Gardens | GL16 8DX |
| Victoria Road | GL16 8DR GL16 8DS |
| Wynolls Hill Lane | GL16 8BP |
| GL16 8NB |
Transport near Coleford Central
- FAQ
- Price Paid By Year
- Property Type Price
Frequently asked questions about Coleford Central
What is the average price for a property for sale in Coleford Central?
The average price for a property for sale in Coleford Central is £249,975. This amount is 12% lower than the average price in Coleford. There are 719 property listings for sale in Coleford Central.
What streets have the most expensive properties for sale in Coleford Central?
The streets with the most expensive properties for sale in Coleford Central are Scowles Road at an average of £575,000, Coombs Road at an average of £498,500 and Union Road at an average of £479,000.
What streets have the most affordable properties for sale in Coleford Central?
The streets with the most affordable properties for sale in Coleford Central are Bank Street at an average of £89,650, Old Vicarage Court at an average of £98,000 and Marine Gardens at an average of £103,500.
Which train stations are available in or near Coleford Central?
Some of the train stations available in or near Coleford Central are Lydney, Chepstow and Cam and Dursley.
Property Price Paid in Coleford Central by Year
The average sold property price by year was:
| Year | Average Sold Price | Price Change |
Sold Properties
|
|---|---|---|---|
| 2025 | £235,656 | -13% |
49 Properties |
| 2024 | £266,919 | 8% |
55 Properties |
| 2023 | £244,743 | -0,2% |
44 Properties |
| 2022 | £245,203 | -2% |
56 Properties |
| 2021 | £250,324 | 20% |
75 Properties |
| 2020 | £199,230 | 3% |
50 Properties |
| 2019 | £192,502 | - |
58 Properties |
| 2018 | £192,459 | 8% |
60 Properties |
| 2017 | £177,448 | 2% |
71 Properties |
| 2016 | £174,716 | -3% |
78 Properties |
| 2015 | £179,250 | 19% |
50 Properties |
| 2014 | £145,729 | -9% |
61 Properties |
| 2013 | £158,472 | 7% |
75 Properties |
| 2012 | £147,762 | -8% |
66 Properties |
| 2011 | £159,844 | -9% |
37 Properties |
| 2010 | £174,653 | 19% |
40 Properties |
| 2009 | £141,539 | -0,4% |
38 Properties |
| 2008 | £142,141 | -22% |
28 Properties |
| 2007 | £173,880 | 3% |
66 Properties |
| 2006 | £169,344 | 6% |
79 Properties |
| 2005 | £159,756 | 19% |
71 Properties |
| 2004 | £129,840 | -4% |
109 Properties |
| 2003 | £135,484 | 22% |
63 Properties |
| 2002 | £106,217 | 22% |
97 Properties |
| 2001 | £83,109 | 5% |
65 Properties |
| 2000 | £79,203 | 16% |
71 Properties |
| 1999 | £66,909 | -2% |
78 Properties |
| 1998 | £68,061 | 12% |
80 Properties |
| 1997 | £59,573 | 14% |
69 Properties |
| 1996 | £51,103 | -7% |
60 Properties |
| 1995 | £54,609 | - |
41 Properties |
Property Price per Property Type in Coleford Central
Here you can find historic sold price data in order to help with your property search.
The average Property Paid Price for specific property types in the last three years are:
| Property Type | Average Sold Price | Sold Properties |
|---|---|---|
| Semi Detached House | £226,751.00 | 60 Semi Detached Houses |
| Detached House | £372,562.00 | 44 Detached Houses |
| Terraced House | £197,384.00 | 22 Terraced Houses |
| Flat | £120,734.00 | 22 Flats |

