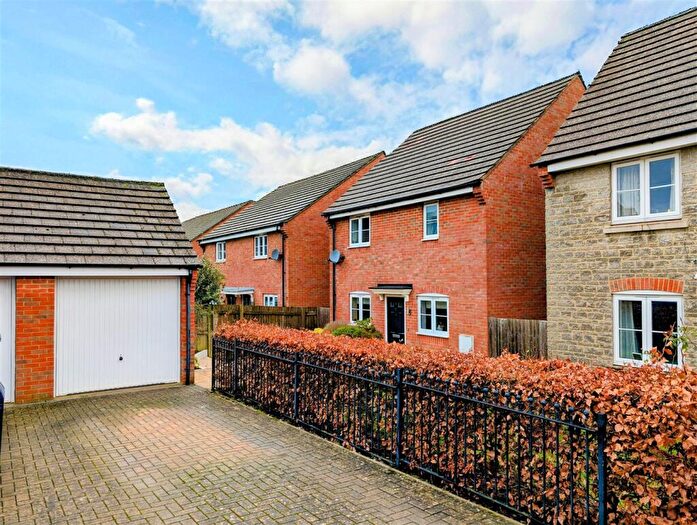
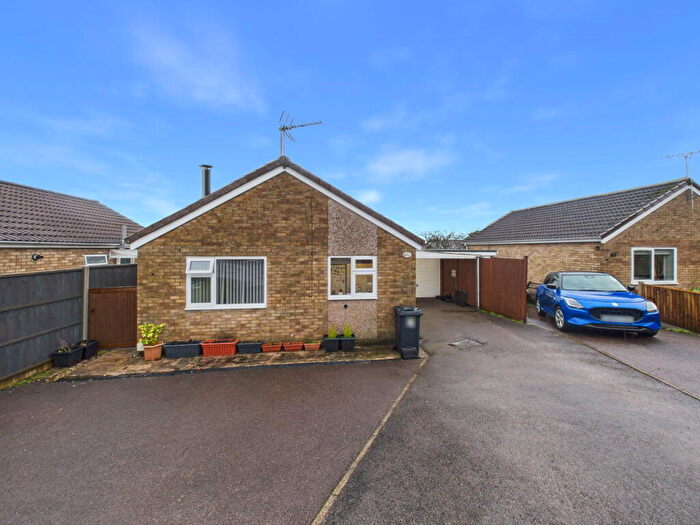
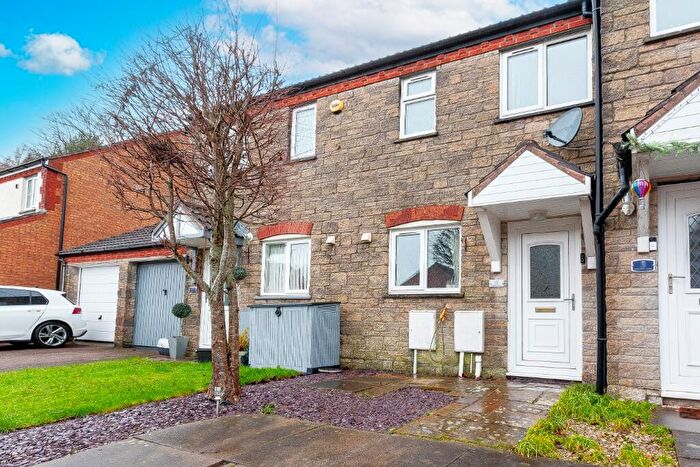
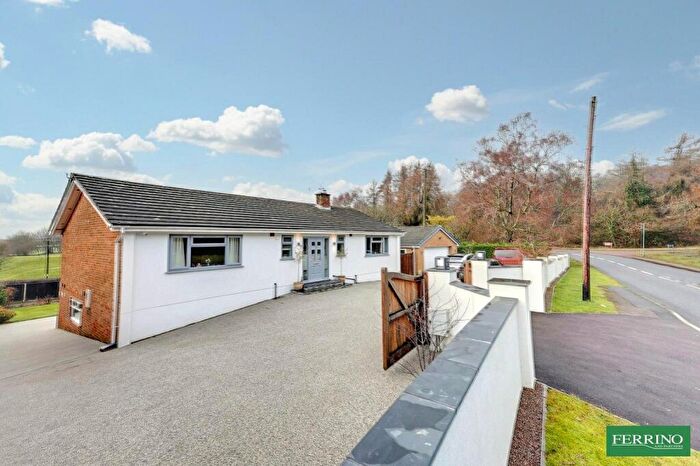
Houses for sale & to rent in Coleford, Coleford
House Prices in Coleford
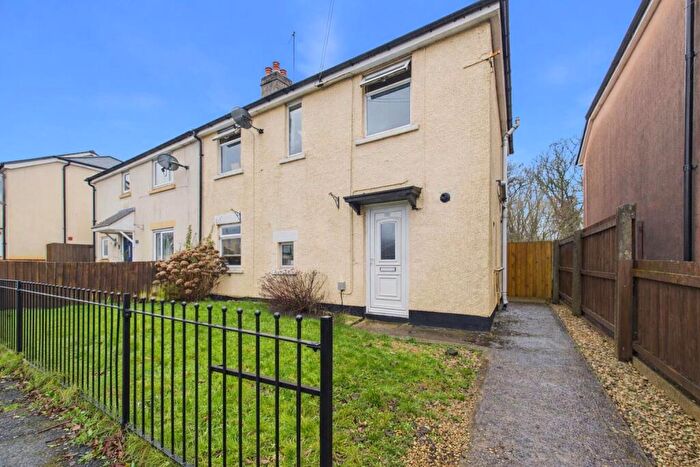
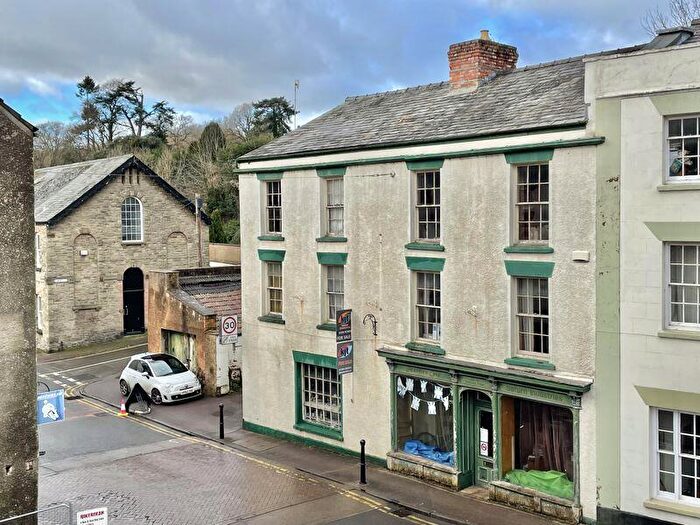
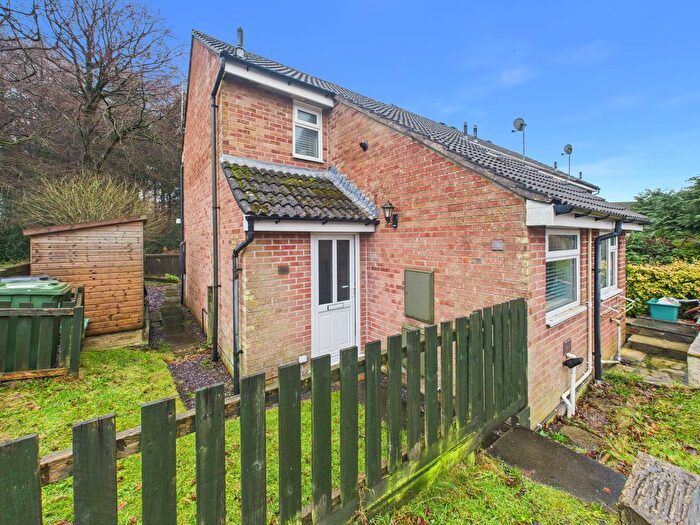
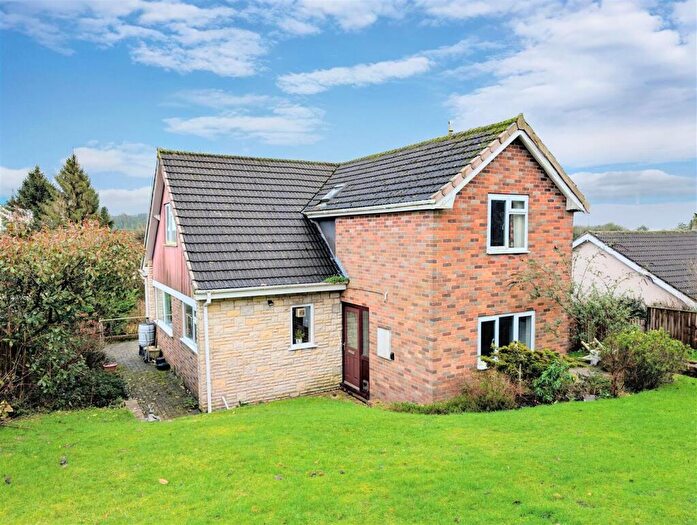
Properties in Coleford have an average house price of £297,369.00 and had 23 Property Transactions within the last 3 years¹.
Coleford is an area in Coleford, Gloucestershire with 184 households², where the most expensive property was sold for £525,000.00.
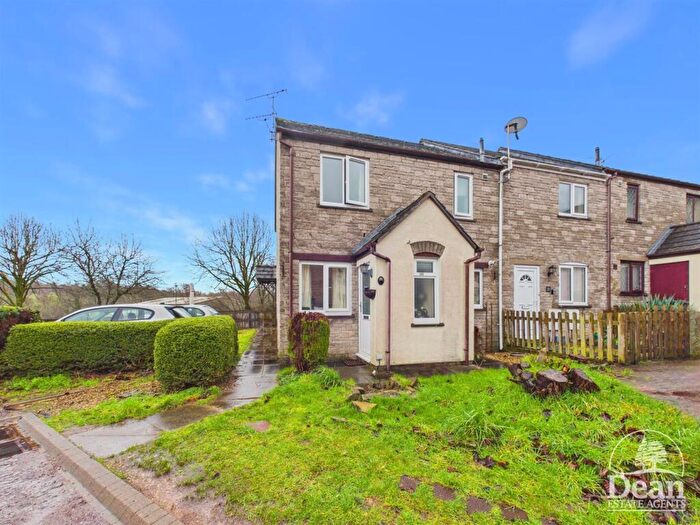
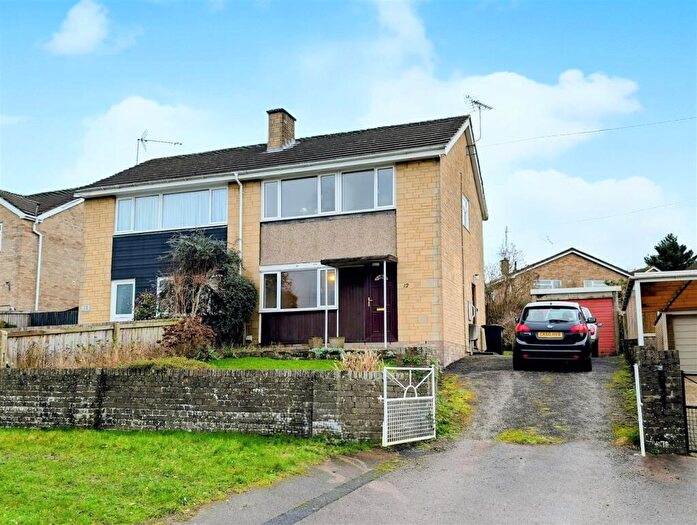
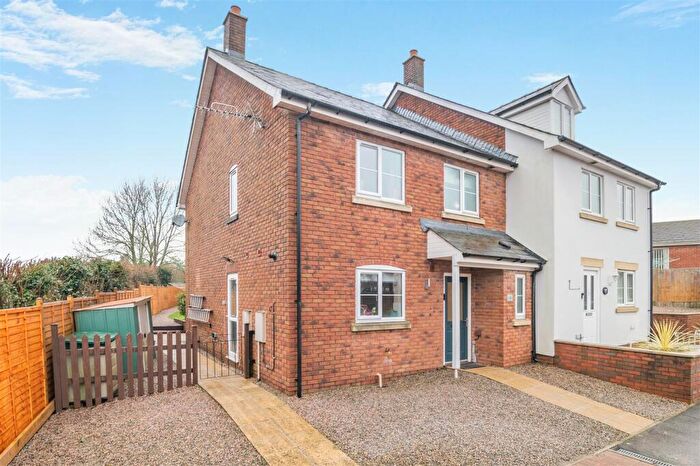
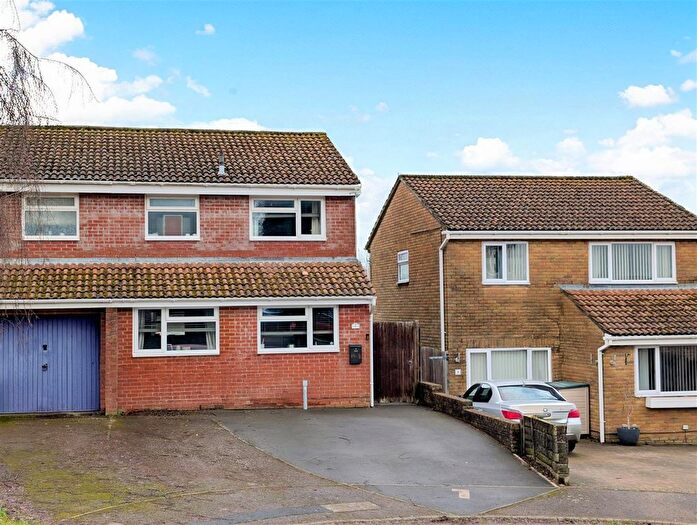
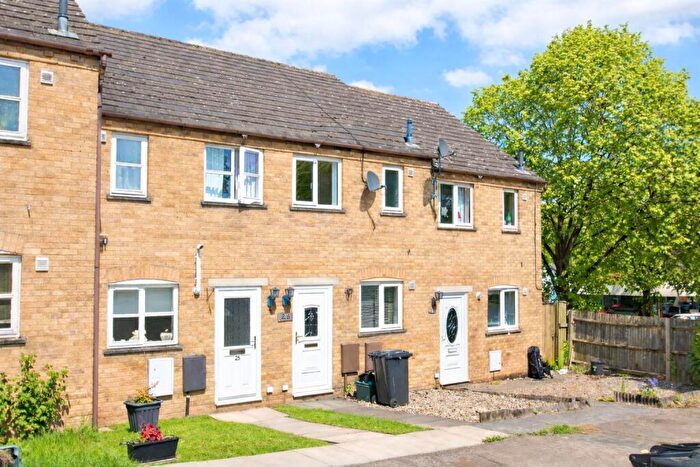
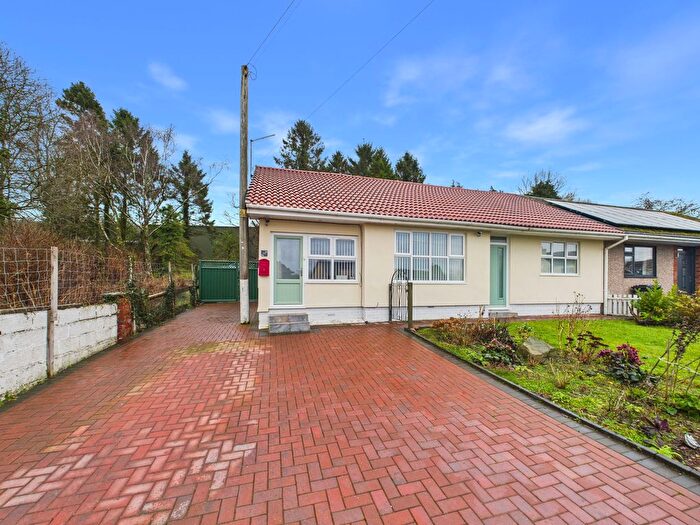
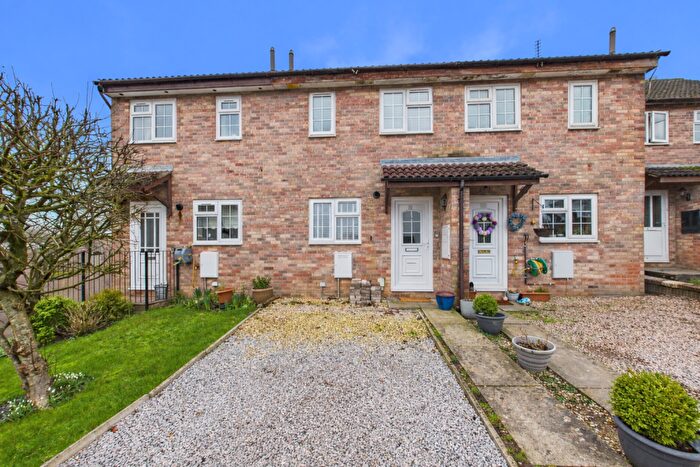
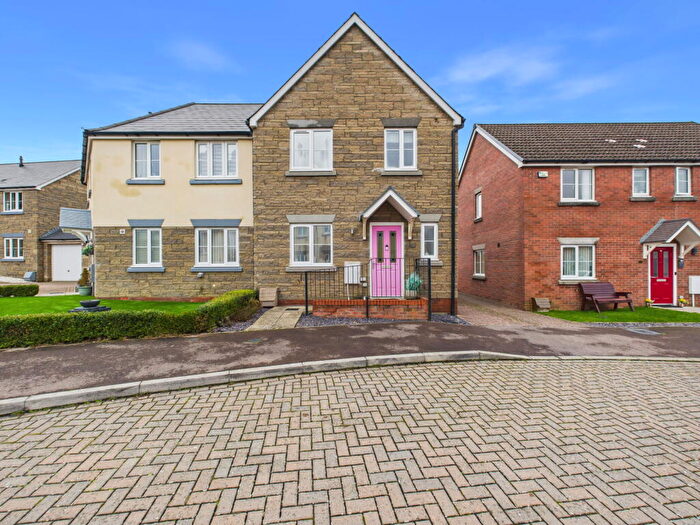
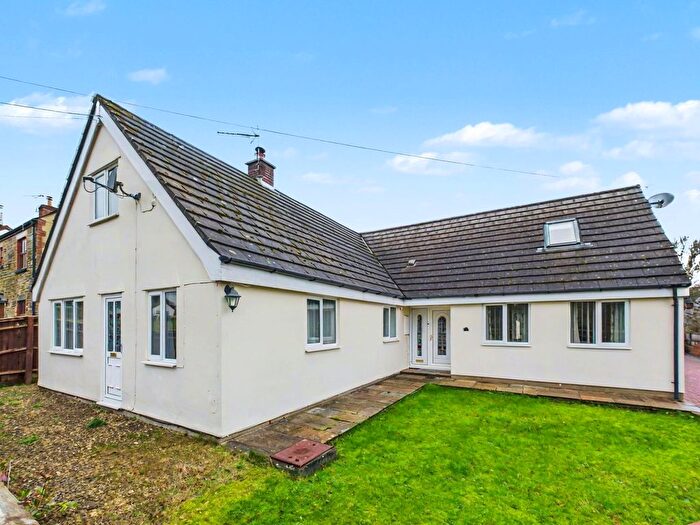
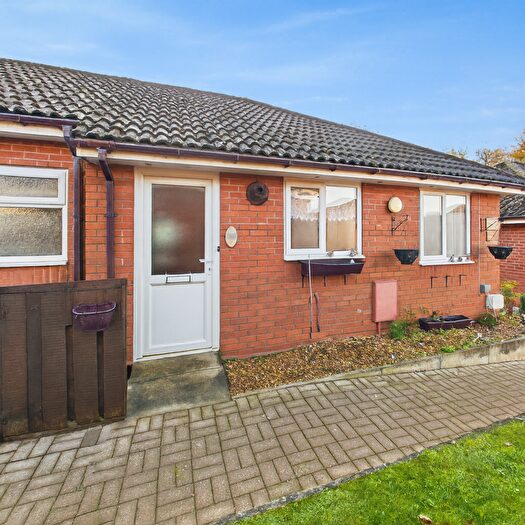
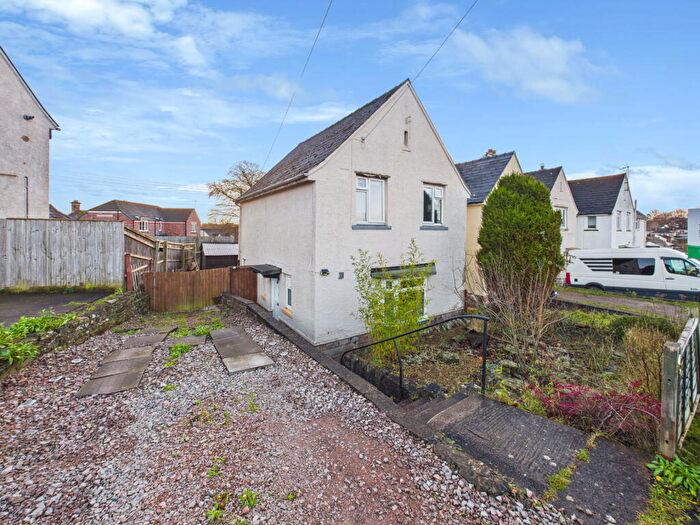
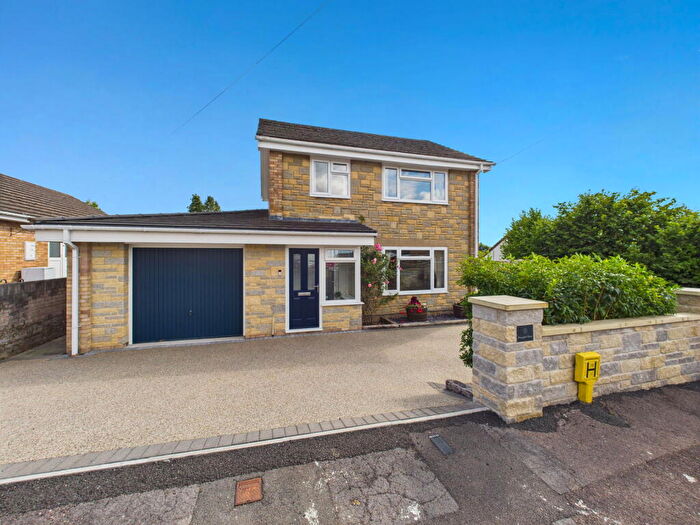
Properties for sale in Coleford
Roads and Postcodes in Coleford
Navigate through our locations to find the location of your next house in Coleford, Coleford for sale or to rent.
| Streets | Postcodes |
|---|---|
| Astridge Close | GL16 8GA |
| Bank Close | GL16 8FA GL16 8FB |
| Barrow Drive | GL16 7FH |
| Berrows Mews | GL16 8SE |
| Bircham Drive | GL16 8EU |
| Blakes Way | GL16 8EX |
| Cadora Way | GL16 8ET |
| Caudwell Close | GL16 8EY |
| Centurions Walk | GL16 8RW |
| Cinderhill | GL16 8HL |
| Coalway | GL16 7HE |
| Copper Beech Close | GL16 8FD |
| Crucible Close | GL16 8RE |
| Crucible Court | GL16 8PS |
| Cupola Close | GL16 8RD |
| Edenwall Road | GL16 7HW |
| Hales Close | GL16 7SP |
| Harpers Close | GL16 7FG |
| High Nash | GL16 8HW |
| High Street | GL16 8FG GL16 8HD GL16 8HE GL16 8HG GL16 9SA GL16 9SB GL16 9SD GL16 9SE GL16 9SF GL16 9SG GL16 9SH GL16 9SJ GL16 9SL GL16 9SN GL16 9SP GL16 9SQ GL16 9SR GL16 9SS GL16 9ST GL16 9SU GL16 9SW GL16 9SX GL16 9SY GL16 9SZ GL16 9TA GL16 9TB GL16 9TD GL16 9TE GL16 9TF GL16 9TH GL16 9TJ GL16 9TL GL16 9ZZ |
| Inwood Drive | GL16 8EZ |
| Knavin Court | GL16 7SR |
| Lords Hill | GL16 8BE |
| Lower Lane | GL16 8QQ |
| Market Place | GL16 8AE GL16 8AF GL16 8AQ GL16 8AW |
| Meads Close | GL16 8EW |
| Milestone Walk | GL16 8ND |
| Mushet Walk | GL16 8BQ |
| Navigation Court | GL16 7SJ |
| Nelson Close | GL16 7RA |
| Newland Street | GL16 8AH |
| Oakwood Road | GL16 8PL |
| Old Station Way | GL16 8SH |
| Palmers Glade | GL16 7LW |
| Parliament Place | GL16 8SG |
| Poolway | GL16 7QA |
| Poppy Field | GL16 7FF |
| Powells Close | GL16 7SQ |
| Pyart Court | GL16 8RG |
| Railway Drive | GL16 8RH |
| Ridgeway Avenue | GL16 7SF |
| Royal Gardens | GL16 8SD |
| Ruffet Close | GL16 8RA |
| Sion Place | GL16 8FL |
| Spout Lane | GL16 8DP |
| St Hilaire Avenue | GL16 8FJ |
| St James Park | GL16 7LG |
| Starling Way | GL16 7ST |
| Station Road | GL16 8PZ |
| The Business Park | GL16 8PN |
| The Tram Road | GL16 8TR |
| Trafalgar Mews | GL16 7RZ |
| Trenchard Drive | GL16 7SL |
| Tufthorn Avenue | GL16 8PP GL16 8PR |
| Vicarage Gardens | GL16 8FE |
| Wetheral Close | GL16 8RZ |
| GL16 7LP GL16 8FF GL16 8FH GL16 8JB GL16 9BG GL16 9BP GL16 7SD GL16 7SG |
Transport near Coleford
- FAQ
- Price Paid By Year
- Property Type Price
Frequently asked questions about Coleford
What is the average price for a property for sale in Coleford?
The average price for a property for sale in Coleford is £297,369. This amount is 4% higher than the average price in Coleford. There are 762 property listings for sale in Coleford.
What streets have the most expensive properties for sale in Coleford?
The streets with the most expensive properties for sale in Coleford are Palmers Glade at an average of £525,000, Market Place at an average of £411,000 and Bircham Drive at an average of £408,500.
What streets have the most affordable properties for sale in Coleford?
The streets with the most affordable properties for sale in Coleford are Spout Lane at an average of £142,750, Wetheral Close at an average of £250,000 and Blakes Way at an average of £281,000.
Which train stations are available in or near Coleford?
Some of the train stations available in or near Coleford are Lydney, Chepstow and Cam and Dursley.
Property Price Paid in Coleford by Year
The average sold property price by year was:
| Year | Average Sold Price | Price Change |
Sold Properties
|
|---|---|---|---|
| 2025 | £388,666 | 28% |
6 Properties |
| 2024 | £278,541 | 16% |
12 Properties |
| 2023 | £233,000 | -14% |
5 Properties |
| 2022 | £266,583 | -7% |
15 Properties |
| 2021 | £284,083 | 14% |
18 Properties |
| 2020 | £244,147 | 12% |
17 Properties |
| 2019 | £215,700 | -13% |
5 Properties |
| 2018 | £243,827 | -7% |
24 Properties |
| 2017 | £261,024 | 5% |
41 Properties |
| 2016 | £247,531 | 20% |
45 Properties |
| 2015 | £197,163 | 57% |
45 Properties |
| 2007 | £85,000 | -41% |
1 Property |
| 2006 | £120,000 | 65% |
1 Property |
| 2003 | £42,000 | -60% |
1 Property |
| 2002 | £67,000 | -22% |
2 Properties |
| 1998 | £82,000 | 57% |
1 Property |
| 1995 | £35,000 | - |
1 Property |
Property Price per Property Type in Coleford
Here you can find historic sold price data in order to help with your property search.
The average Property Paid Price for specific property types in the last three years are:
| Property Type | Average Sold Price | Sold Properties |
|---|---|---|
| Semi Detached House | £248,642.00 | 7 Semi Detached Houses |
| Detached House | £420,222.00 | 9 Detached Houses |
| Flat | £196,400.00 | 5 Flats |
| Terraced House | £167,500.00 | 2 Terraced Houses |

