
Houses for sale in Bream, Coleford
House Prices in Bream
Properties in Bream have no sales history available within the last 3 years.
Bream is an area in Coleford, Gloucestershire with 65 households².
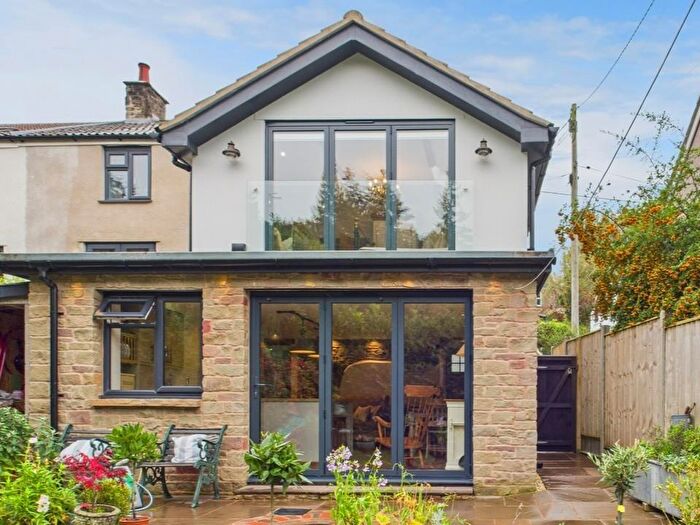
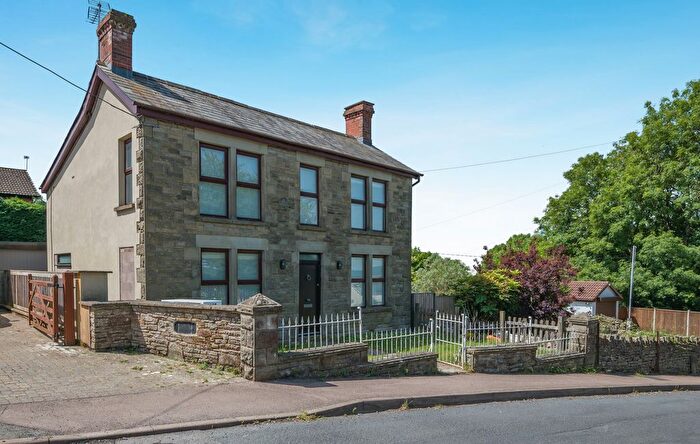
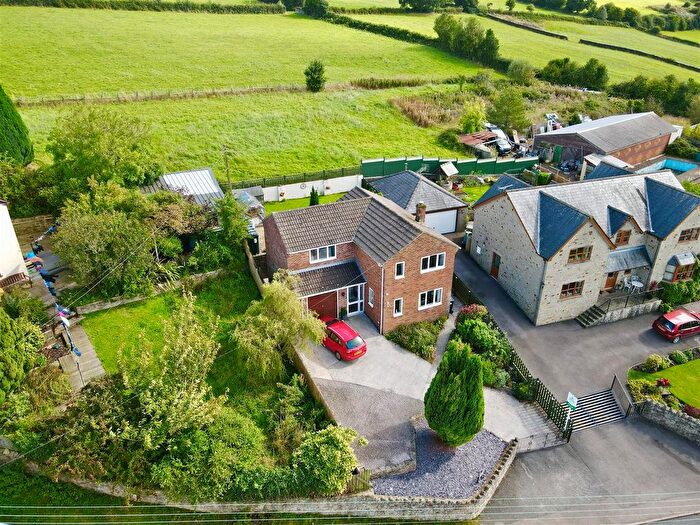
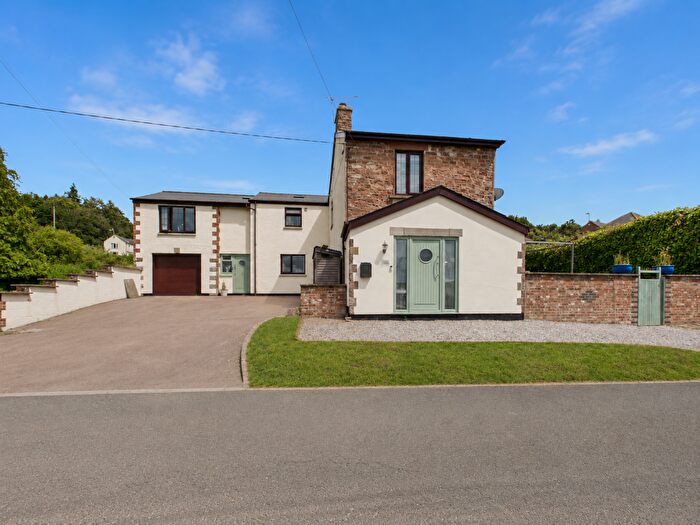
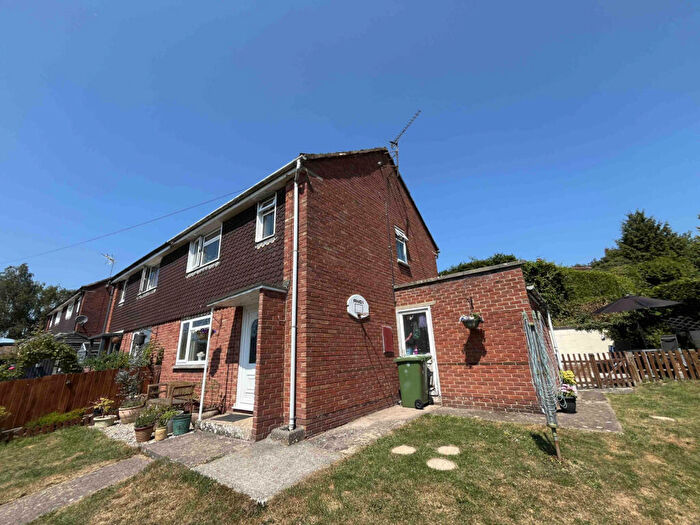
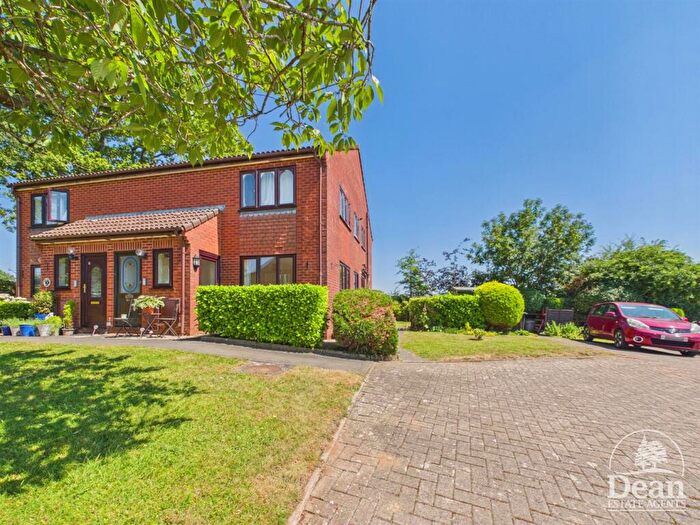
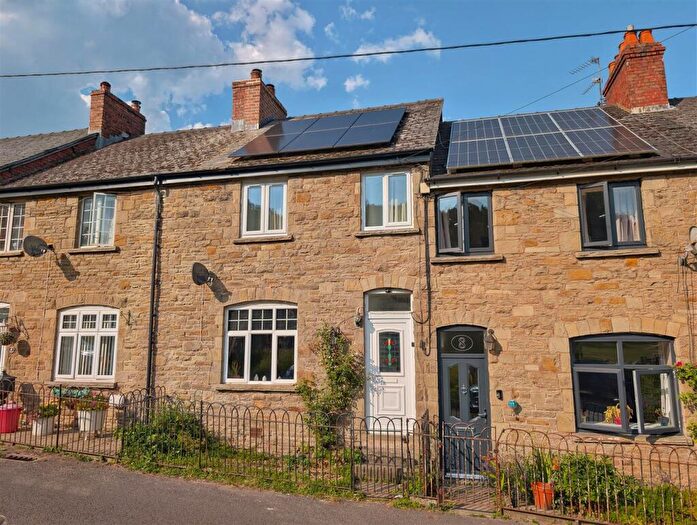
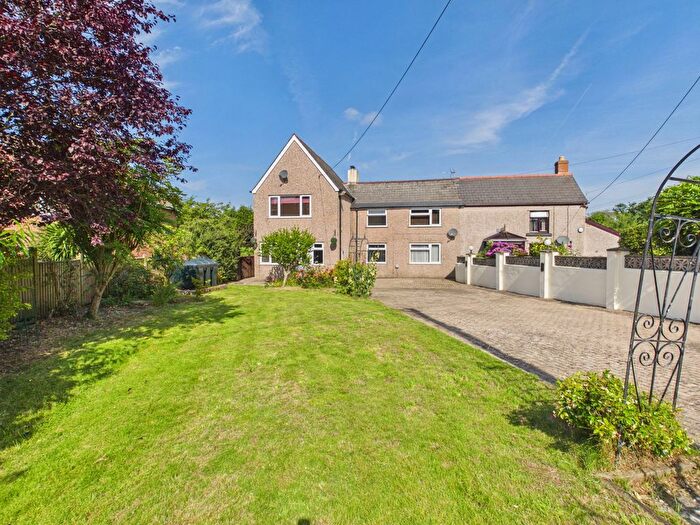
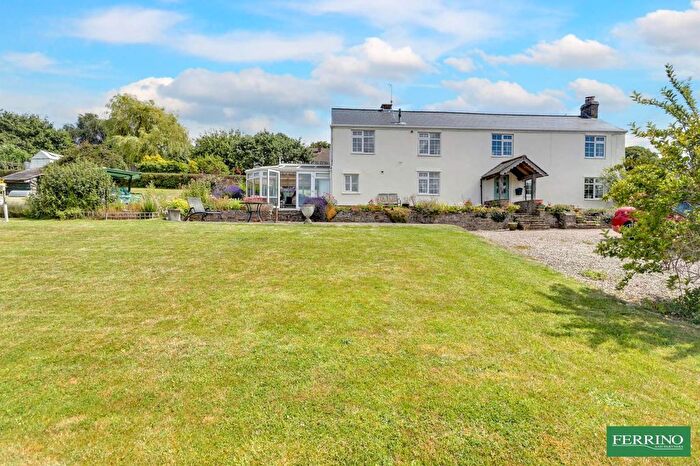
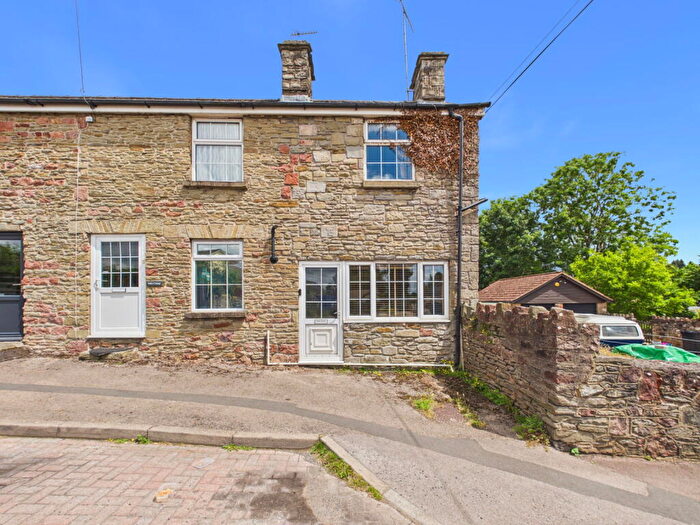
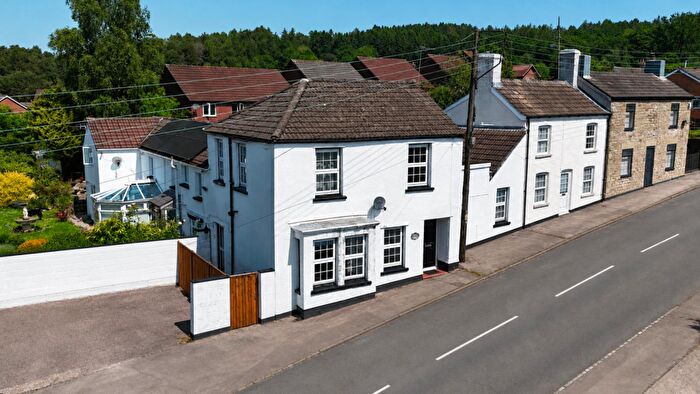
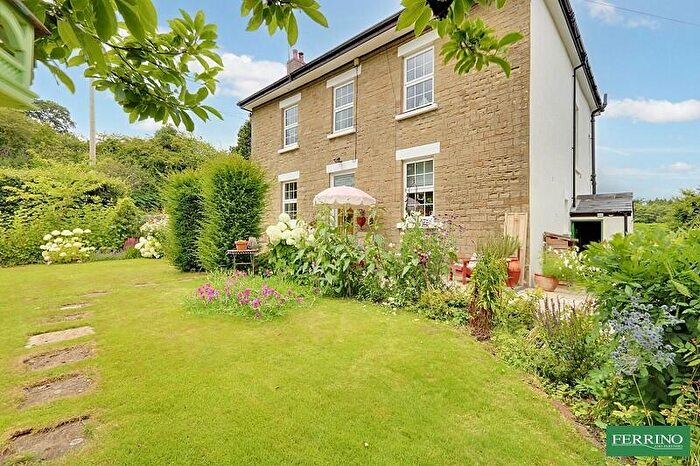
Properties for sale in Bream
![]()
If you are looking to sell your house, let it out, or receive a property valuation, an expert can help you.
Click the button below to get started.

Roads and Postcodes in Bream
Navigate through our locations to find the location of your next house in Bream, Coleford for sale or to rent.
| Streets | Postcodes |
|---|---|
| Cannop Road | GL15 4JS |
| Clements End | GL16 8LN |
| Clements Tump | GL16 8LW |
| Crown Lane | GL15 4JE |
| Friars Level | GL15 4QR |
| Lion Row | GL15 4JZ |
| Mallards Pike | GL15 4HD |
| Norchard Gardens | GL15 4UD |
| Park Grove | GL15 4PJ |
| Parkend | GL15 4HT |
| Parkend Road | GL15 4PD |
| Princess Royal Industrial Estate | GL15 4SU |
| Whitemead Park | GL15 4LA |
| GL15 4QG GL15 4QN GL16 7EL GL16 8LP |
Property price trends in Bream
According to the latest Land Registry data, the average home in Bream sold for £401,250 in 2022. That figure comes from 57 sales logged over the past 27 years.
Prices have moved up over the last three years. Compared with 2019, when the typical sale came in around £386,000, that's a rise of roughly 4%.
Looking back five years, average prices are up about 20% since 2017, a gain of around £66,875 in cash terms.
Zoom out to the past decade for the fuller picture. Back in 2012, homes here averaged £230,000, so the typical sold price has climbed about 74.5% since then, roughly 5.7% a year. Stretch the view to fifteen years and that annual pace eases back to about 0.4%.
Frequently asked questions about Bream
Which train stations are available in or near Bream?
Some of the train stations available in or near Bream are Lydney, Cam and Dursley and Chepstow.
Property Price Paid in Bream by Year
The average sold property price by year was:
| Year | Average Sold Price | Price Change |
Sold Properties
|
|---|---|---|---|
| 2022 | £401,250 | 10% |
2 Properties |
| 2021 | £359,250 | -6% |
4 Properties |
| 2020 | £380,799 | -1% |
5 Properties |
| 2019 | £386,000 | 1% |
2 Properties |
| 2018 | £381,237 | 12% |
4 Properties |
| 2017 | £334,375 | -15% |
4 Properties |
| 2016 | £386,000 | 49% |
2 Properties |
| 2015 | £196,250 | -34% |
2 Properties |
| 2014 | £262,463 | -3% |
15 Properties |
| 2013 | £270,000 | 15% |
1 Property |
