
Houses for sale in Pillowell, Coleford
House Prices in Pillowell
Properties in Pillowell have an average house price of £289k and had 2 Property Transactions within the last 3 years¹.
Pillowell is an area in Coleford, Gloucestershire with 29 households², where the most expensive property was sold for £325k.
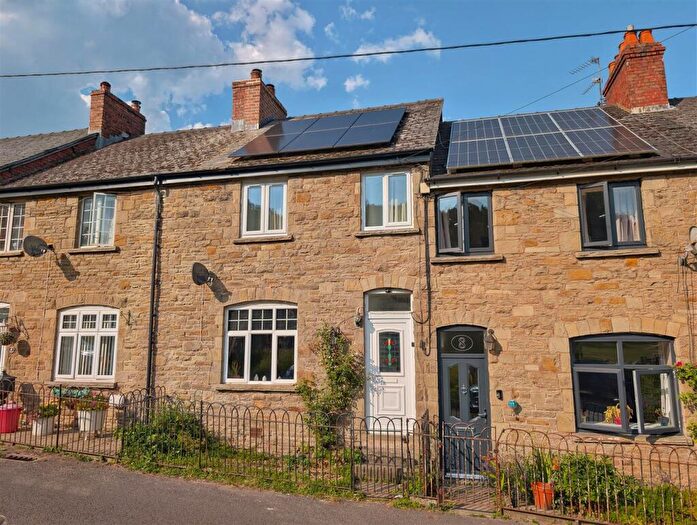
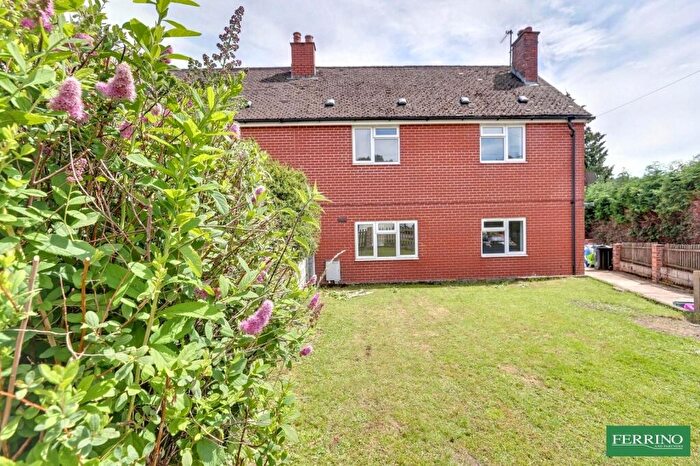
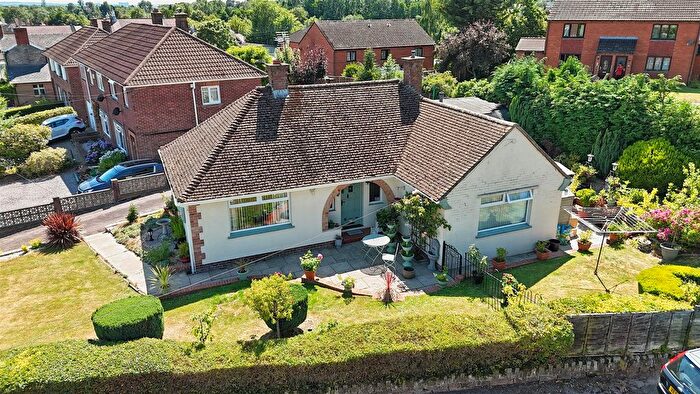
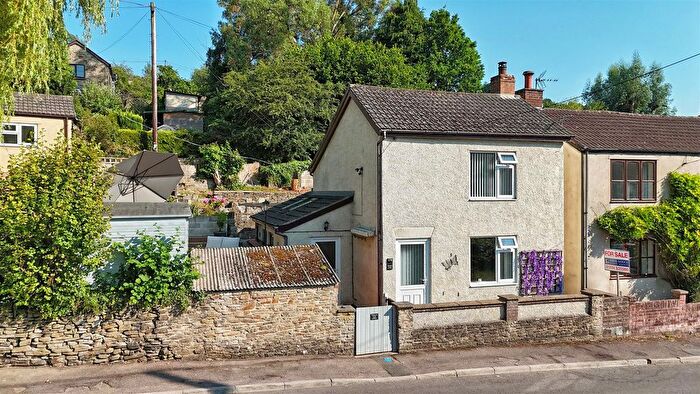
Properties for sale in Pillowell
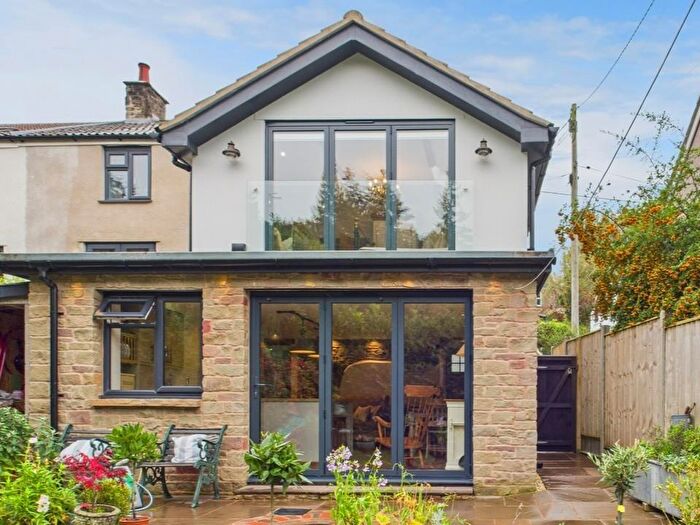
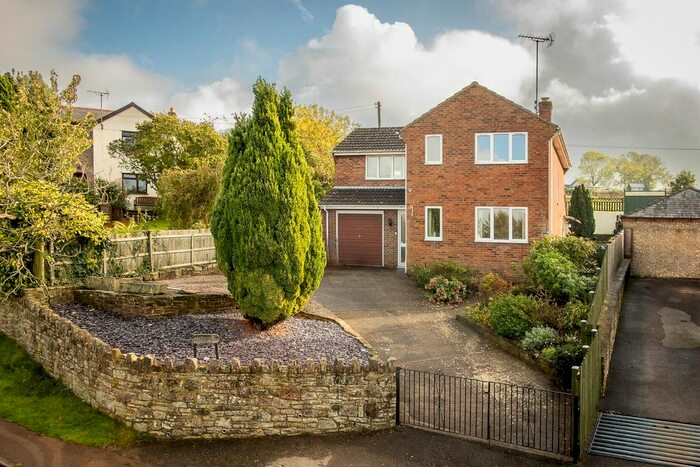
![]()
If you are looking to sell your house, let it out, or receive a property valuation, an expert can help you.
Click the button below to get started.

Roads and Postcodes in Pillowell
Navigate through our locations to find the location of your next house in Pillowell, Coleford for sale or to rent.
| Streets | Postcodes |
|---|---|
| Brierley Way | GL15 4NE |
| Danby Close | GL15 4SQ |
| Harveys Lane | GL15 4SZ |
| Nags Head | GL16 7LS |
| Oak Lane | GL15 4QA |
| School Hill | GL15 4QS |
| Speech House | GL16 7EJ |
| The Level | GL15 4QD |
| Yorkley Wood Road | GL15 4PZ GL15 4TX |
Property price trends in Pillowell
According to the latest Land Registry data, the average home in Pillowell sold for £252,000 in 2024. That figure comes from 10 sales logged over the past 29 years.
Prices have fallen back over the last three years. Compared with 2021, when the typical sale came in around £330,000, that's a fall of roughly 23.6%.
Frequently asked questions about Pillowell
What is the average price for a property for sale in Pillowell?
The average price for a property for sale in Pillowell is £288,500. This amount is 0.14% lower than the average price in Coleford. There are 1,432 property listings for sale in Pillowell.
Which train stations are available in or near Pillowell?
Some of the train stations available in or near Pillowell are Lydney, Cam and Dursley and Chepstow.
Property Price Paid in Pillowell by Year
The average sold property price by year was:
| Year | Average Sold Price | Price Change |
Sold Properties
|
|---|---|---|---|
| 2024 | £252,000 | -29% |
1 Property |
| 2023 | £325,000 | 1% |
1 Property |
| 2022 | £322,500 | -2% |
2 Properties |
| 2021 | £330,000 | -73% |
1 Property |
| 2011 | £570,000 | 30% |
1 Property |
| 2002 | £400,000 | 49% |
1 Property |
| 1999 | £205,000 | 33% |
1 Property |
| 1997 | £137,500 | 20% |
1 Property |
| 1995 | £110,000 | - |
1 Property |
Property Price per Property Type in Pillowell
Here you can find historic sold price data in order to help with your property search.
The average Property Paid Price for specific property types in the last three years are:
| Property Type | Average Sold Price | Sold Properties |
|---|---|---|
| Semi Detached House | £288,500.00 | 2 Semi Detached Houses |
