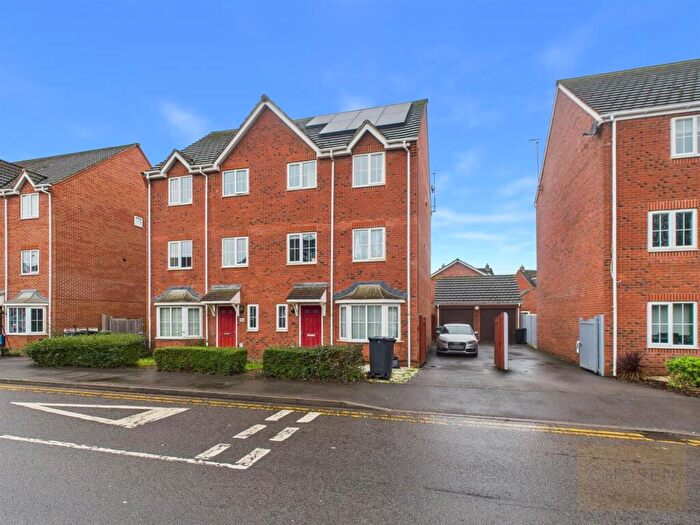
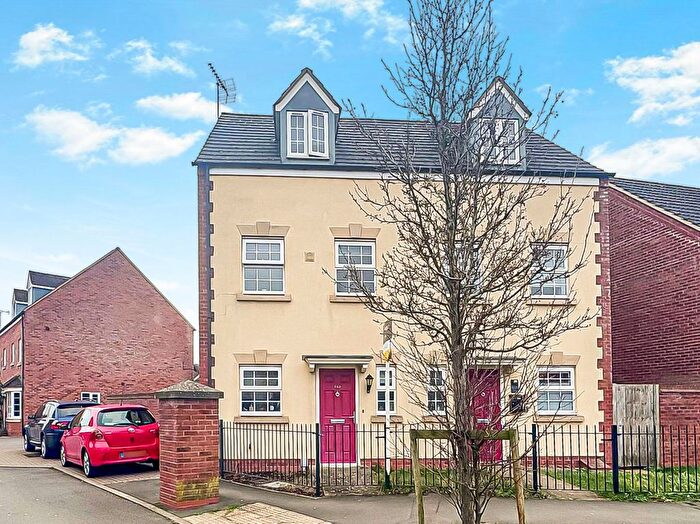
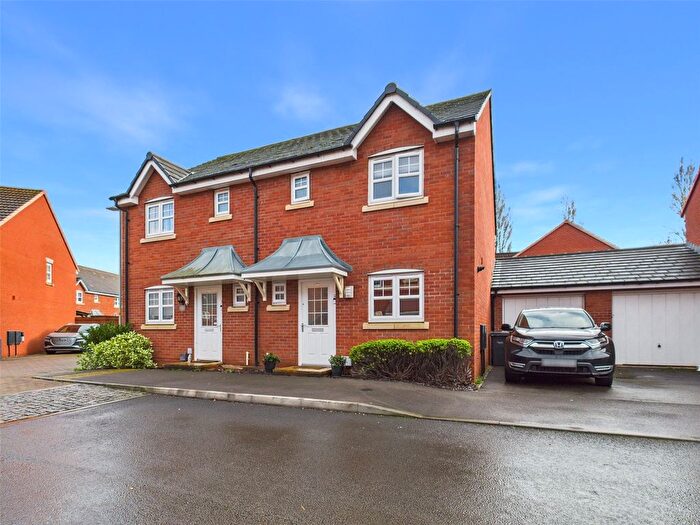
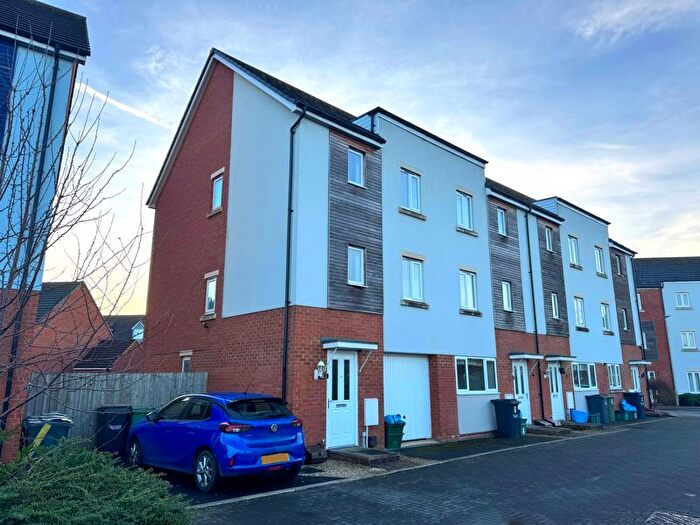
Houses for sale & to rent in Grange, Gloucester
House Prices in Grange
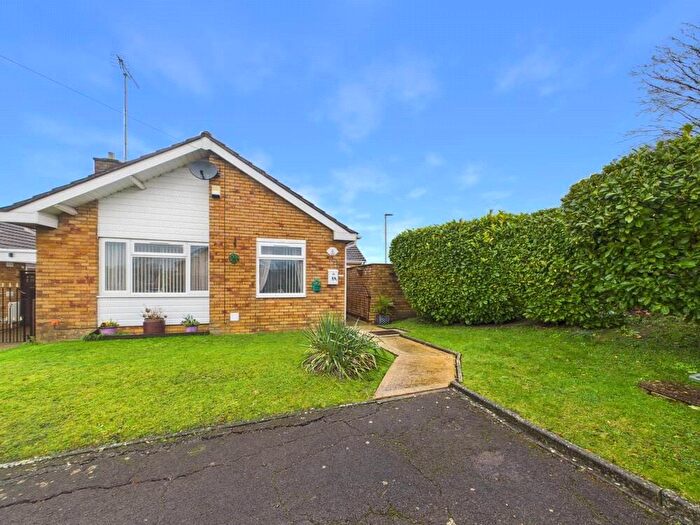
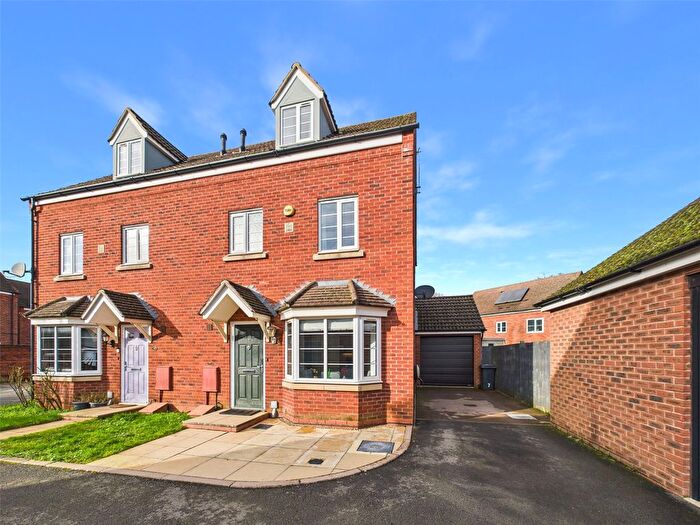
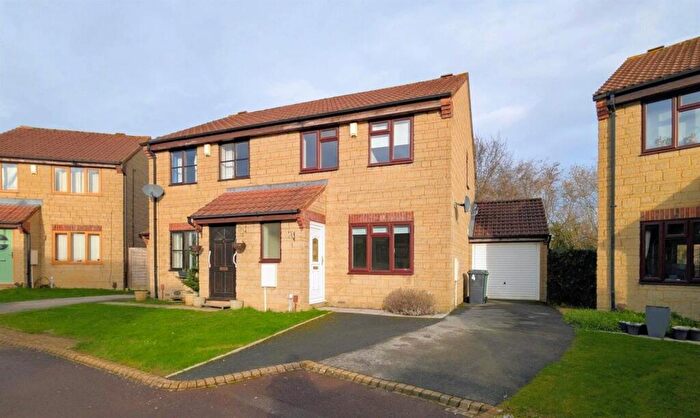
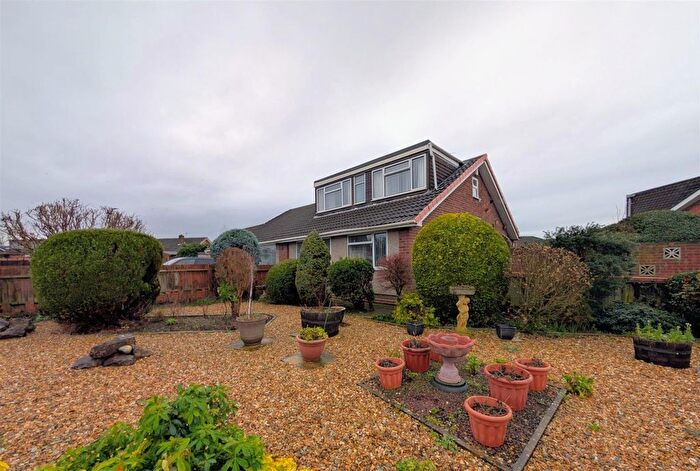
Properties in Grange have an average house price of £232,424.00 and had 256 Property Transactions within the last 3 years¹.
Grange is an area in Gloucester, Gloucestershire with 2,486 households², where the most expensive property was sold for £415,000.00.
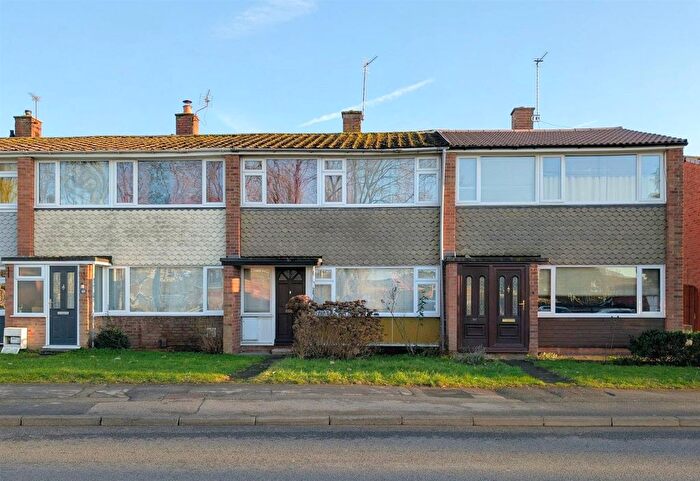
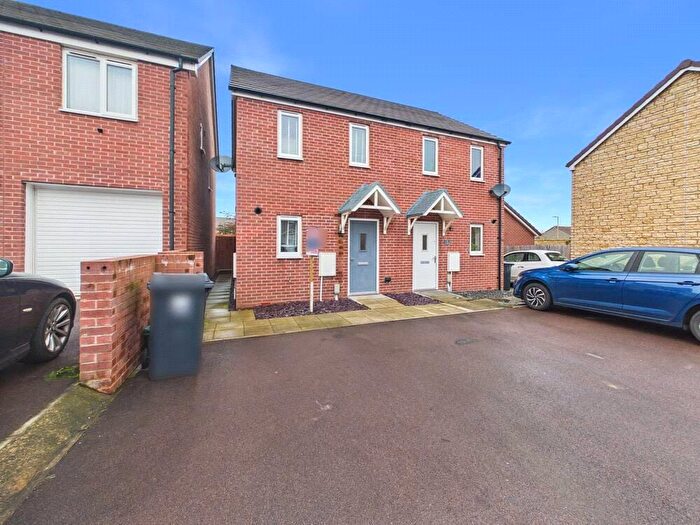
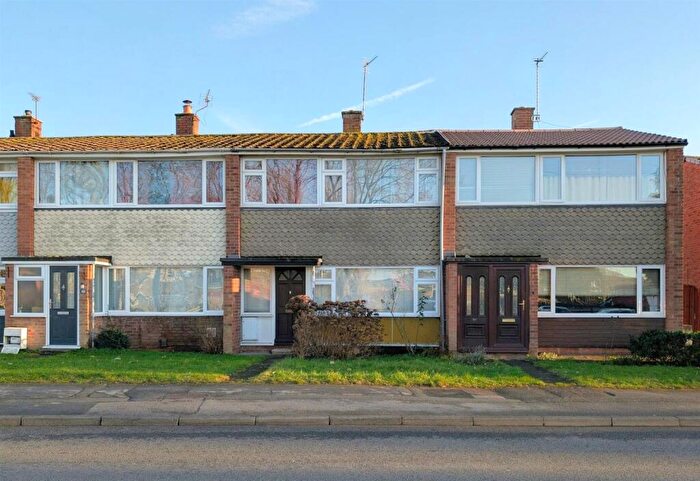
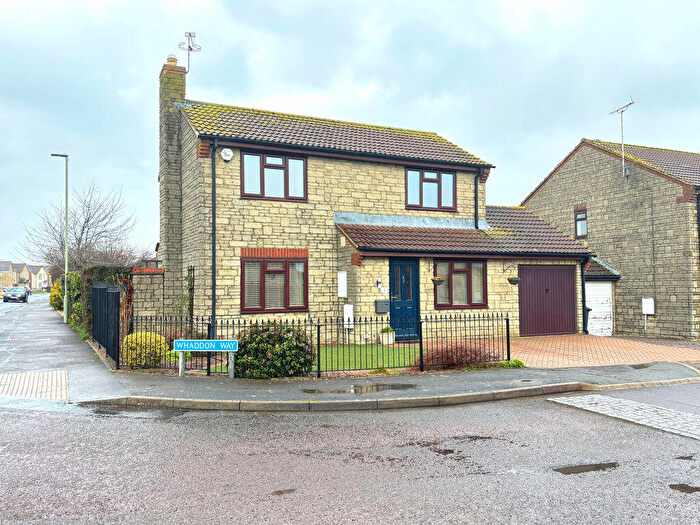
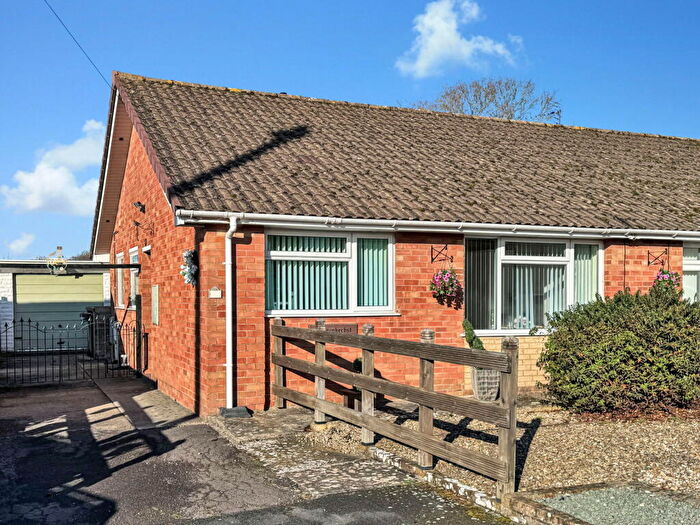
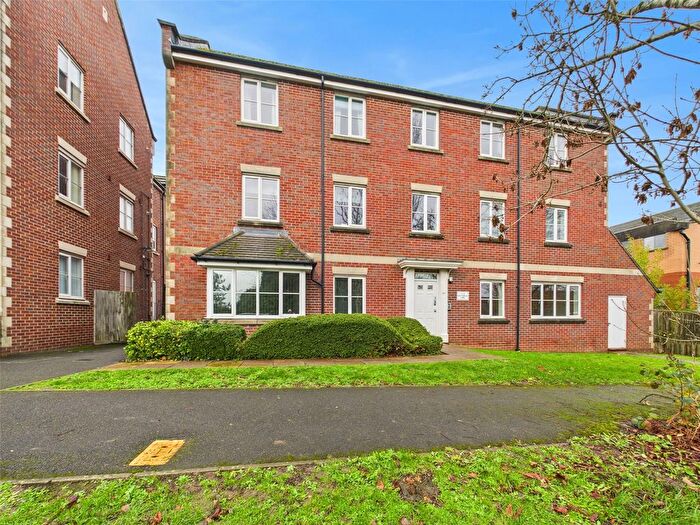
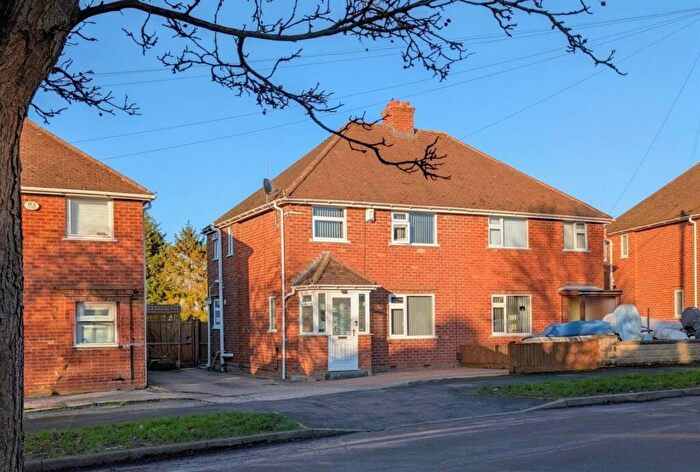
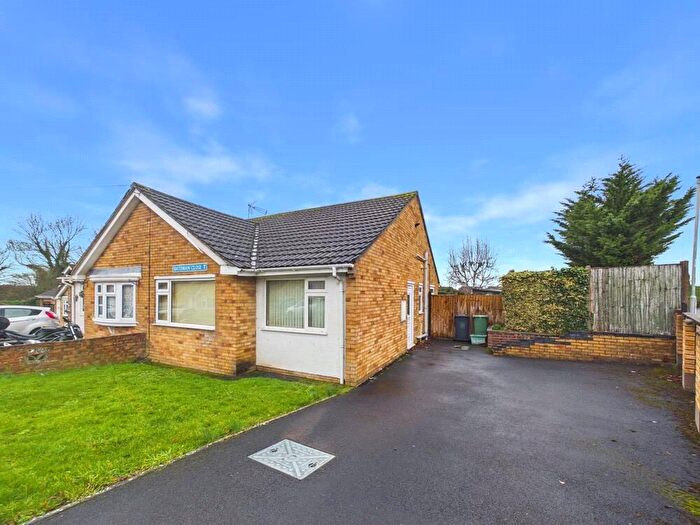
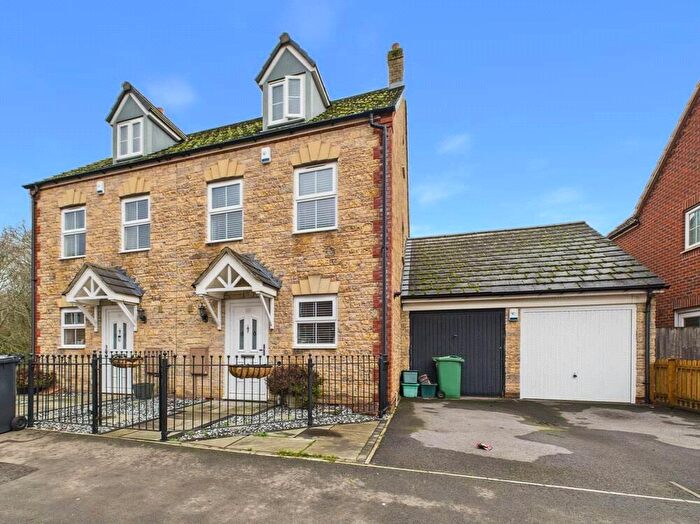
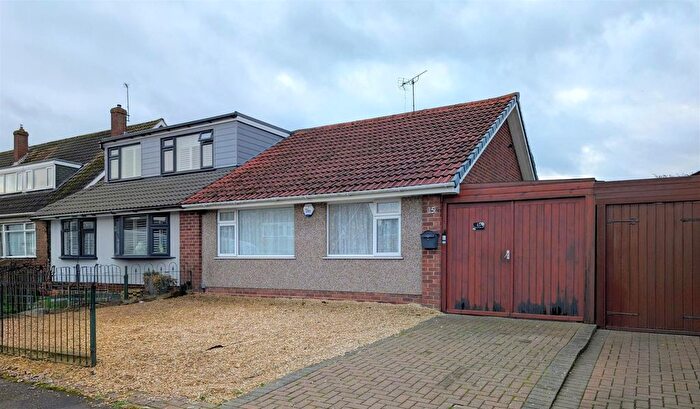
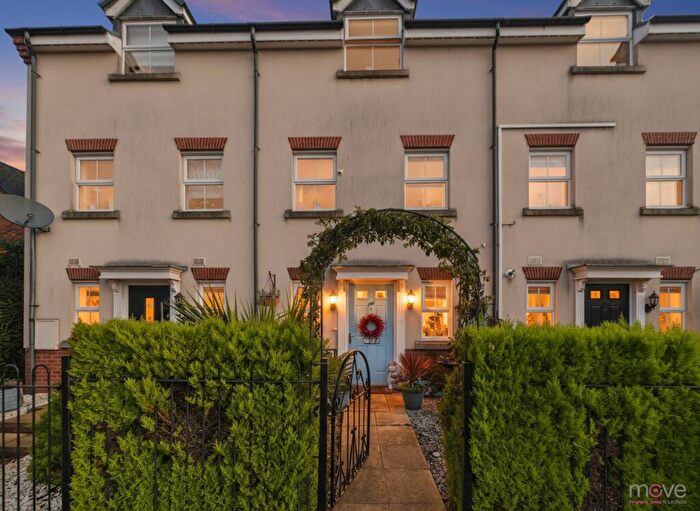
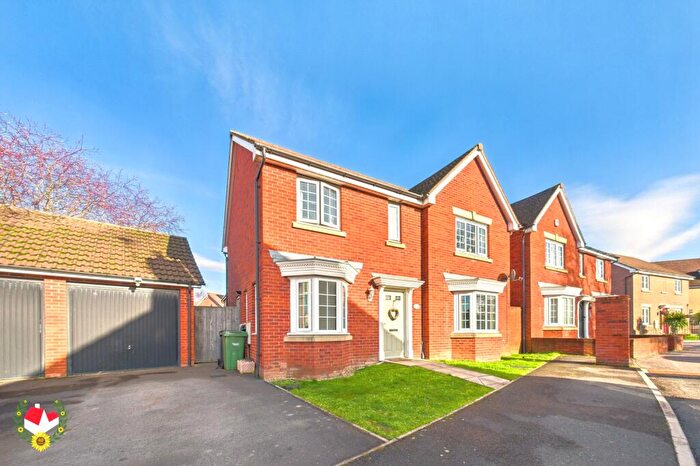
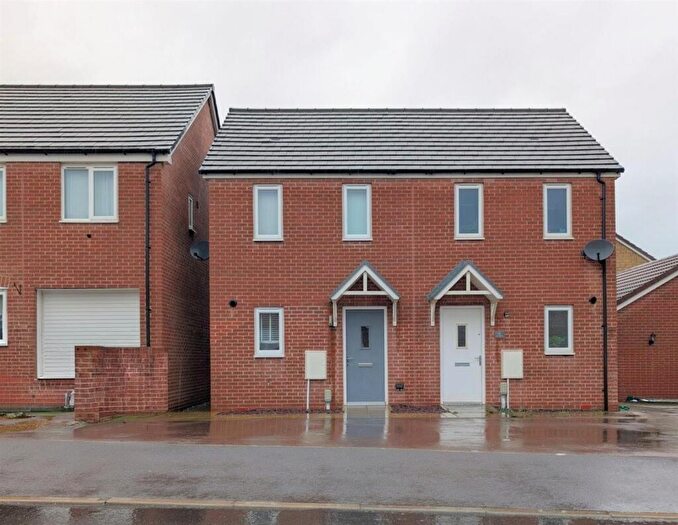
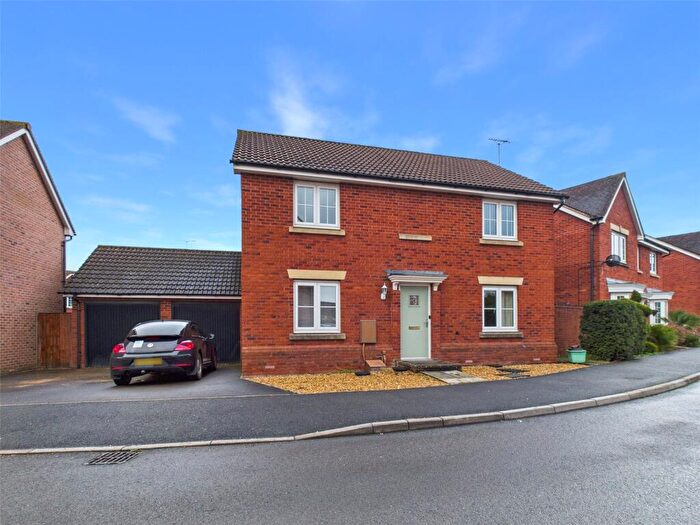
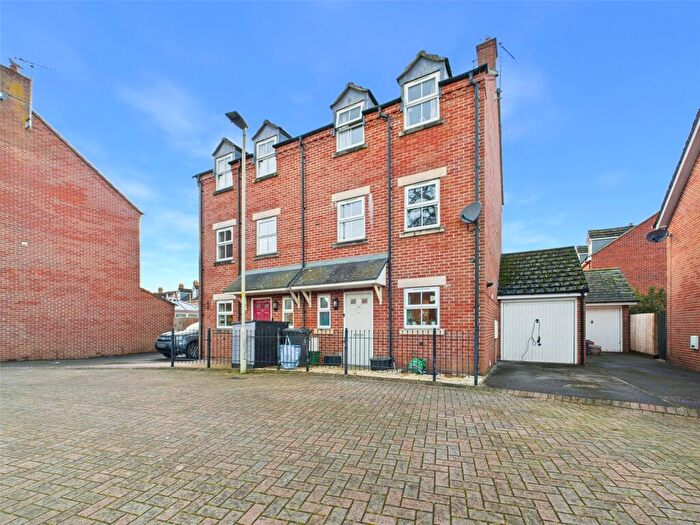
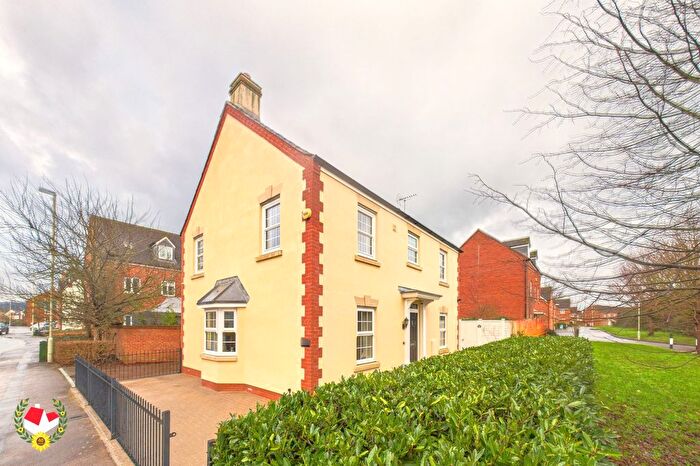
Properties for sale in Grange
Roads and Postcodes in Grange
Navigate through our locations to find the location of your next house in Grange, Gloucester for sale or to rent.
| Streets | Postcodes |
|---|---|
| Althorp Close | GL4 0XP |
| Amber Close | GL4 0RL |
| Arundel Close | GL4 0TW |
| Avebury Close | GL4 0TS |
| Beverstone Road | GL4 0WB |
| Bodiam Avenue | GL4 0TJ GL4 0TL GL4 0TN GL4 0XL GL4 0XN GL4 0XW |
| Central Trading Estate | GL2 5HA |
| Charlecote Avenue | GL4 0TH |
| Chatsworth Avenue | GL4 0SA GL4 0SD GL4 0SH GL4 0SJ GL4 0SP GL4 0SU GL4 0SB |
| Cole Avenue | GL2 5ER |
| Coral Close | GL4 0RG |
| Crypt Court | GL4 0QB |
| Denham Close | GL4 0SF |
| Dunster Close | GL4 0TP |
| Elderwood Way | GL4 0RA GL4 0RB GL4 0RD |
| Emerald Close | GL4 0RH |
| Epney Road | GL4 0LS |
| Field Cottages | GL4 0NQ |
| Gainsborough Drive | GL4 0QR |
| Glencairn Avenue | GL4 0SQ |
| Golden Close | GL4 0QZ |
| Grange Road | GL4 0PD GL4 0PE GL4 0PG GL4 0PJ GL4 0PL GL4 0PR GL4 0PT GL4 0PU GL4 0PY |
| Greenhill Court | GL4 0DP |
| Hale Close | GL4 0WH |
| Harewood Close | GL4 0SR GL4 0SS GL4 0ST |
| Hendingham Close | GL4 0XS |
| Holmleigh Parade | GL4 0QU |
| Holmleigh Road | GL4 0RN GL4 0RW |
| Holmwood Close | GL4 0PW |
| Holmwood Drive | GL4 0PN GL4 0PP GL4 0PS |
| Ivory Close | GL4 0QY |
| Lasborough Drive | GL4 0WF |
| Lilac Way | GL4 0RF |
| Longleat Avenue | GL4 0SG |
| Meredith Way | GL4 0UD |
| Notgrove Close | GL4 0PQ |
| Nutley Avenue | GL4 0QP |
| Nympsfield Road | GL4 0NG GL4 0NL |
| Osborne Avenue | GL4 0QN |
| Pearwood Way | GL4 0QX |
| Petworth Close | GL4 0TG |
| Quedgeley Park | GL4 0LP GL4 0LR GL4 0LW |
| Randwick Road | GL4 0NF GL4 0NH GL4 0NJ |
| Russet Close | GL4 0RQ |
| Ryelands | GL4 0QA |
| Sandford Way | GL4 0TR |
| Sandringham Avenue | GL4 0QL |
| Sapphire Close | GL4 0RR |
| Sedgley Close | GL4 0QS |
| Shepherd Road | GL2 5EL GL2 5EP |
| Silver Close | GL4 0RJ |
| St Davids Close | GL4 0PX |
| St Georges Close | GL4 0PF |
| Stirling Way | GL4 0XR |
| Sudeley Way | GL4 0WJ |
| Sulgrave Close | GL4 0SE |
| Thoresby Avenue | GL4 0TD GL4 0TE GL4 0TF GL4 0TQ |
| Tolsey Gardens | GL4 0AT GL4 0BP GL4 0DR |
| Tuffley Lane | GL4 0AS GL4 0DL GL4 0NT GL4 0NX GL4 0NY GL4 0RP GL4 0NU GL4 0PZ |
| Vincent Avenue | GL4 0SW |
| Warwick Avenue | GL4 0SL |
| Windsor Drive | GL4 0QH GL4 0QJ GL4 0QT GL4 0QW GL4 0RS GL4 0RT |
| Woburn Avenue | GL4 0SN |
Transport near Grange
- FAQ
- Price Paid By Year
- Property Type Price
Frequently asked questions about Grange
What is the average price for a property for sale in Grange?
The average price for a property for sale in Grange is £232,424. This amount is 18% lower than the average price in Gloucester. There are 967 property listings for sale in Grange.
What streets have the most expensive properties for sale in Grange?
The streets with the most expensive properties for sale in Grange are Randwick Road at an average of £346,916, Ryelands at an average of £340,000 and St Davids Close at an average of £309,000.
What streets have the most affordable properties for sale in Grange?
The streets with the most affordable properties for sale in Grange are Crypt Court at an average of £140,700, Tolsey Gardens at an average of £150,250 and Greenhill Court at an average of £152,166.
Which train stations are available in or near Grange?
Some of the train stations available in or near Grange are Gloucester, Stonehouse and Stroud.
Property Price Paid in Grange by Year
The average sold property price by year was:
| Year | Average Sold Price | Price Change |
Sold Properties
|
|---|---|---|---|
| 2025 | £230,148 | -3% |
72 Properties |
| 2024 | £237,931 | 4% |
96 Properties |
| 2023 | £228,278 | -1% |
88 Properties |
| 2022 | £231,085 | 10% |
101 Properties |
| 2021 | £207,180 | 8% |
112 Properties |
| 2020 | £191,245 | -1% |
92 Properties |
| 2019 | £193,945 | 5% |
96 Properties |
| 2018 | £183,422 | 8% |
104 Properties |
| 2017 | £169,493 | 4% |
99 Properties |
| 2016 | £162,419 | 6% |
100 Properties |
| 2015 | £152,957 | 9% |
94 Properties |
| 2014 | £139,568 | 2% |
124 Properties |
| 2013 | £136,653 | 2% |
97 Properties |
| 2012 | £134,574 | 7% |
63 Properties |
| 2011 | £125,172 | -5% |
76 Properties |
| 2010 | £131,175 | 11% |
75 Properties |
| 2009 | £116,292 | -26% |
95 Properties |
| 2008 | £146,162 | -5% |
69 Properties |
| 2007 | £152,819 | 13% |
116 Properties |
| 2006 | £133,489 | 3% |
129 Properties |
| 2005 | £129,525 | 5% |
133 Properties |
| 2004 | £122,920 | 11% |
127 Properties |
| 2003 | £109,654 | 20% |
129 Properties |
| 2002 | £87,197 | 17% |
119 Properties |
| 2001 | £72,030 | 6% |
121 Properties |
| 2000 | £67,487 | 17% |
124 Properties |
| 1999 | £55,998 | 8% |
151 Properties |
| 1998 | £51,524 | 11% |
131 Properties |
| 1997 | £45,649 | 2% |
125 Properties |
| 1996 | £44,664 | 0,3% |
112 Properties |
| 1995 | £44,528 | - |
72 Properties |
Property Price per Property Type in Grange
Here you can find historic sold price data in order to help with your property search.
The average Property Paid Price for specific property types in the last three years are:
| Property Type | Average Sold Price | Sold Properties |
|---|---|---|
| Semi Detached House | £259,601.00 | 137 Semi Detached Houses |
| Detached House | £284,805.00 | 18 Detached Houses |
| Terraced House | £208,617.00 | 70 Terraced Houses |
| Flat | £135,659.00 | 31 Flats |

