
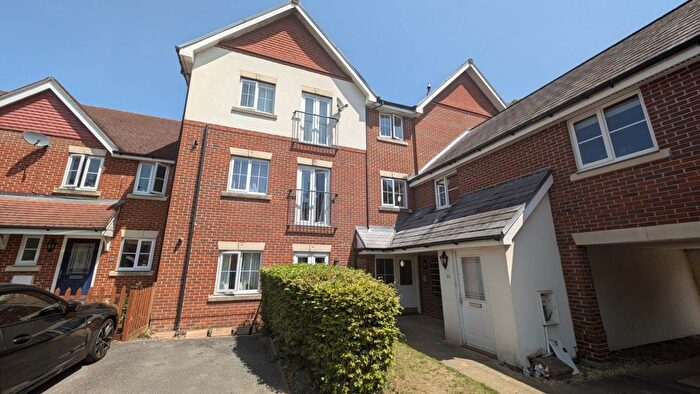
Houses for sale in Selborne, Bordon
House Prices in Selborne
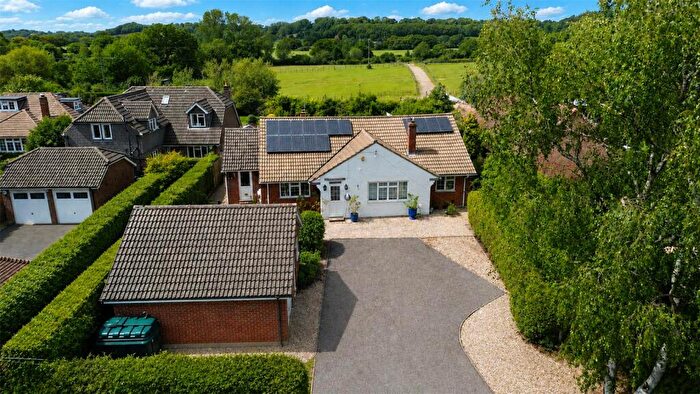
Properties in Selborne have an average house price of £609k and had 32 Property Transactions within the last 3 years¹.
Selborne is an area in Bordon, Hampshire with 388 households², where the most expensive property was sold for £1.29M.
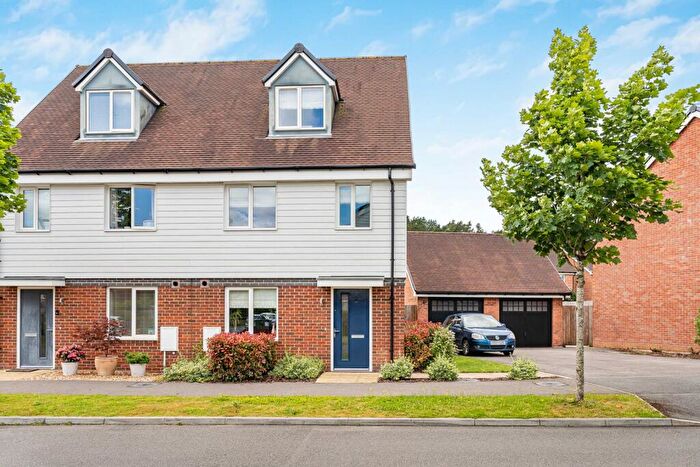
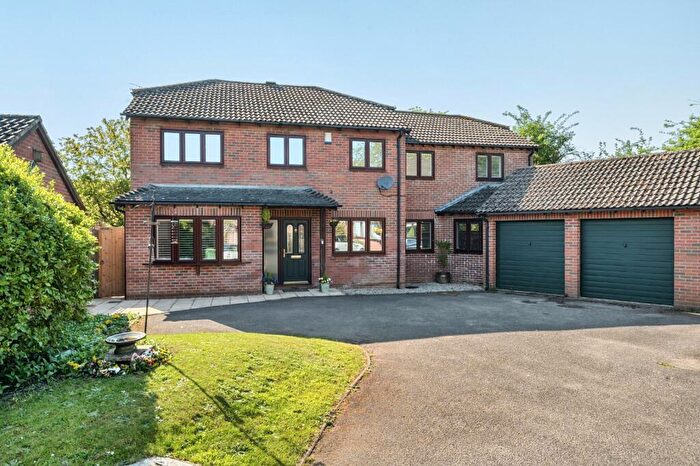
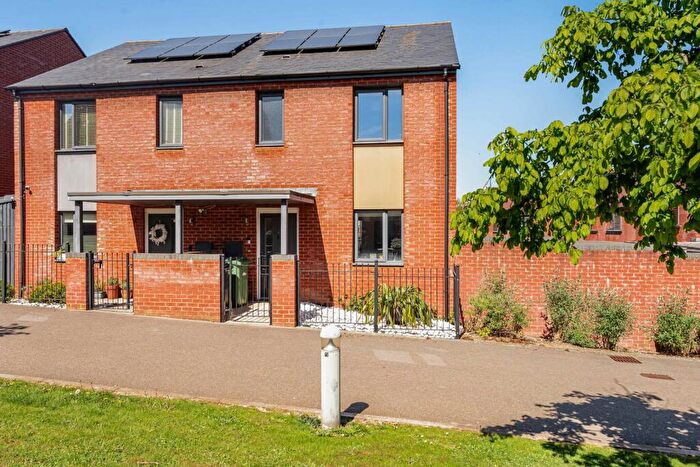
Properties for sale in Selborne

![]()
If you are looking to sell your house, let it out, or receive a property valuation, an expert can help you.
Click the button below to get started.
Roads and Postcodes in Selborne
Navigate through our locations to find the location of your next house in Selborne, Bordon for sale or to rent.
| Streets | Postcodes |
|---|---|
| Bracken Lane | GU35 9DJ |
| Churchfields | GU35 9PJ |
| Farnham Road | GU35 0QP GU35 9LJ |
| Firgrove Road | GU35 9EQ |
| Forge Road | GU35 9LP |
| Frith End | GU35 0QR |
| Gibbs Lane | GU35 9HE GU35 9JS |
| Gold Hill | GU35 9LT |
| Kingsley Common | GU35 9LL GU35 9LR GU35 9LS GU35 9NE GU35 9NF |
| Lions Field | GU35 9LA |
| Main Road | GU35 9LU GU35 9LW GU35 9LZ GU35 9NA GU35 9ND GU35 9NG |
| Orchard Cottages | GU35 9JP |
| Park Close | GU35 9LY |
| Plantation Way | GU35 9HD |
| Sandy Lane | GU35 9NH |
| Sickles Lane | GU35 9PD |
| The Straits | GU35 9NT |
| Woodfield | GU35 9NB |
| GU35 9HT GU35 9JB GU35 9JD GU35 9JE GU35 9JF GU35 9JG GU35 9JH GU35 9JJ GU35 9JL GU35 9JN GU35 9JQ GU35 9JU GU35 9JW GU35 9NJ GU35 9NN GU35 9NW |
Property price trends in Selborne
According to the latest Land Registry data, the average home in Selborne sold for £527,142 in 2025. That figure comes from 448 sales logged over the past 30 years.
Prices have fallen back over the last three years. Compared with 2022, when the typical sale came in around £903,750, that's a fall of roughly 41.7%.
Looking back five years, average prices are up about 12.3% since 2020, a gain of around £57,824 in cash terms.
Zoom out to the past decade for the fuller picture. Back in 2015, homes here averaged £517,526, so the typical sold price has climbed about 1.9% since then, roughly 0.2% a year. Stretch the view to fifteen years and that annual pace edges up closer to 1.2%.
Frequently asked questions about Selborne
What is the average price for a property for sale in Selborne?
The average price for a property for sale in Selborne is £609,236. This amount is 54% higher than the average price in Bordon. There are 2,151 property listings for sale in Selborne.
What streets have the most expensive properties for sale in Selborne?
The streets with the most expensive properties for sale in Selborne are Sandy Lane at an average of £930,000, Sickles Lane at an average of £715,000 and Churchfields at an average of £688,125.
What streets have the most affordable properties for sale in Selborne?
The streets with the most affordable properties for sale in Selborne are Lions Field at an average of £270,000, Park Close at an average of £340,500 and Woodfield at an average of £367,500.
Which train stations are available in or near Selborne?
Some of the train stations available in or near Selborne are Bentley, Alton and Liphook.
Property Price Paid in Selborne by Year
The average sold property price by year was:
| Year | Average Sold Price | Price Change |
Sold Properties
|
|---|---|---|---|
| 2025 | £527,142 | -17% |
7 Properties |
| 2024 | £618,336 | -6% |
15 Properties |
| 2023 | £653,050 | -38% |
10 Properties |
| 2022 | £903,750 | 41% |
8 Properties |
| 2021 | £531,673 | 12% |
26 Properties |
| 2020 | £469,318 | -8% |
11 Properties |
| 2019 | £508,928 | 10% |
14 Properties |
| 2018 | £460,187 | -35% |
8 Properties |
| 2017 | £620,500 | 17% |
9 Properties |
| 2016 | £512,704 | -1% |
12 Properties |
Property Price per Property Type in Selborne
Here you can find historic sold price data in order to help with your property search.
The average Property Paid Price for specific property types in the last three years are:
| Property Type | Average Sold Price | Sold Properties |
|---|---|---|
| Semi Detached House | £535,900.00 | 10 Semi Detached Houses |
| Detached House | £715,364.00 | 18 Detached Houses |
| Terraced House | £300,000.00 | 3 Terraced Houses |
| Flat | £360,000.00 | 1 Flat |
