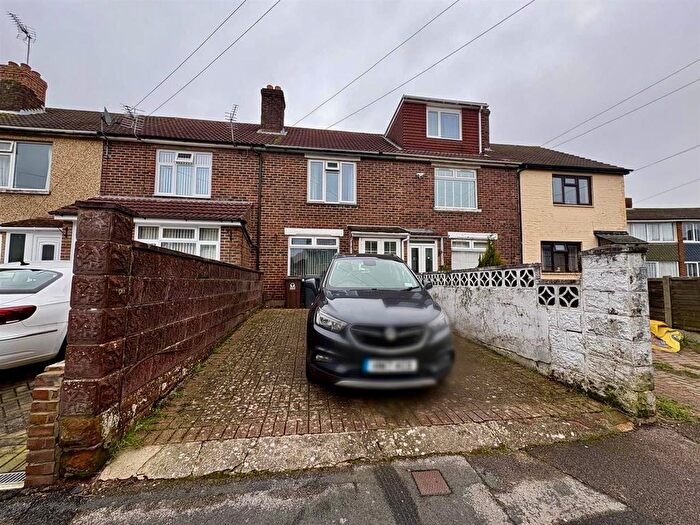
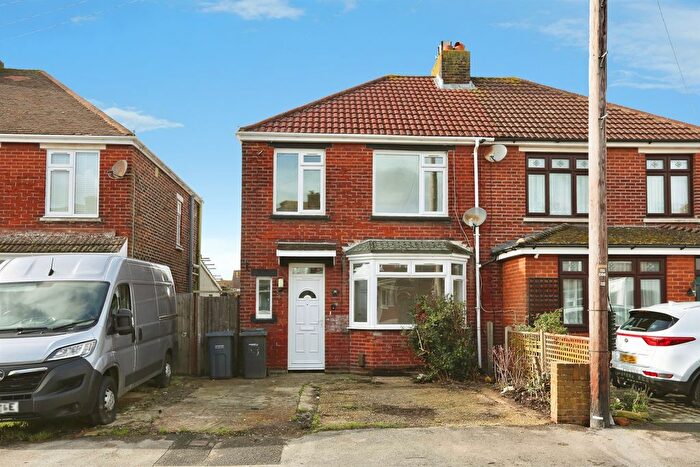
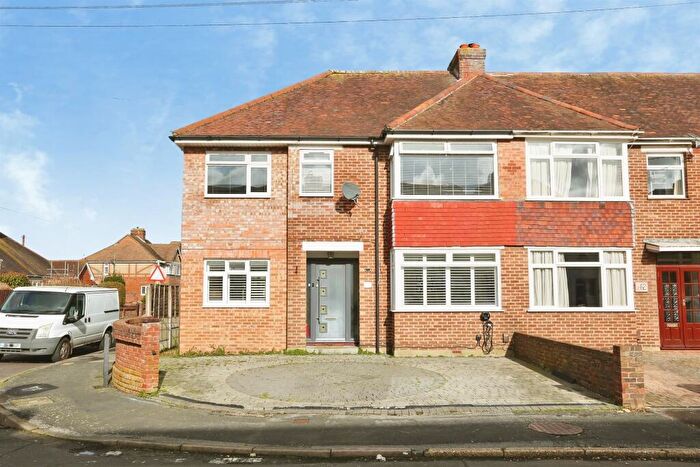
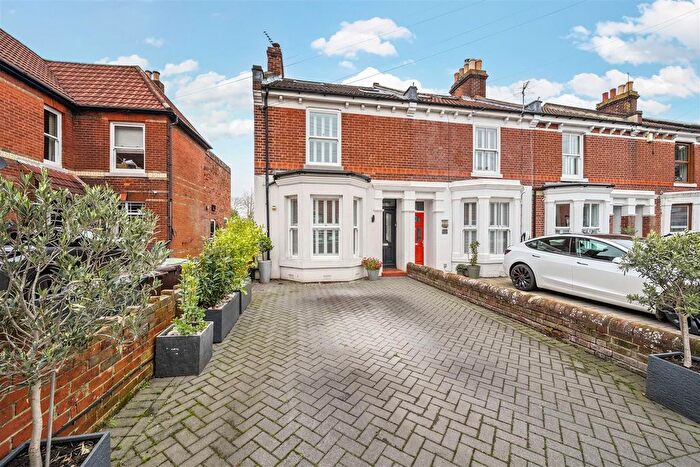
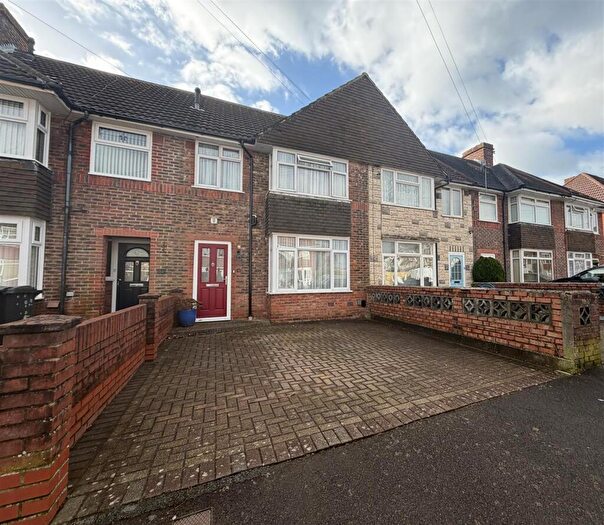
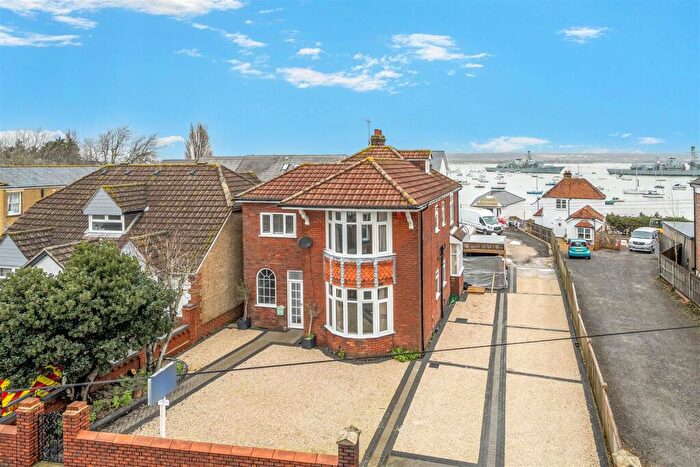
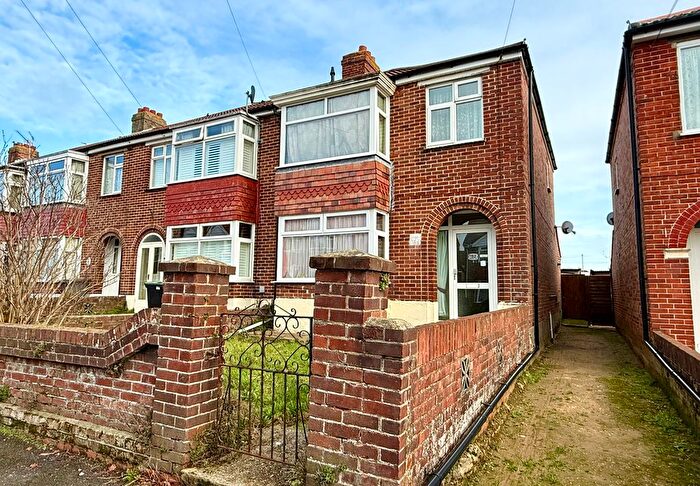
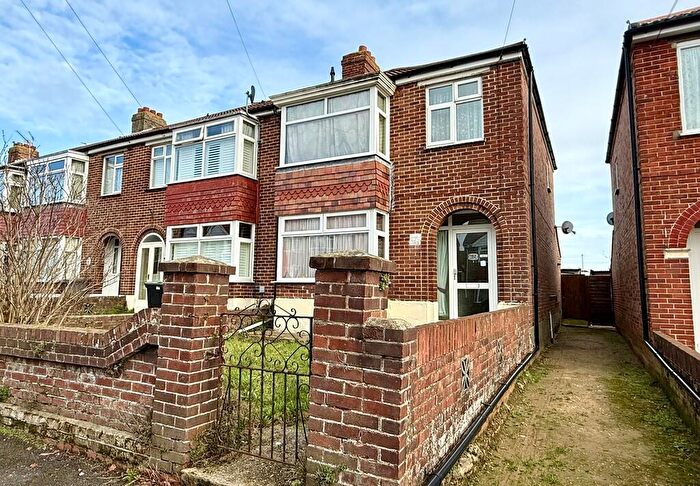
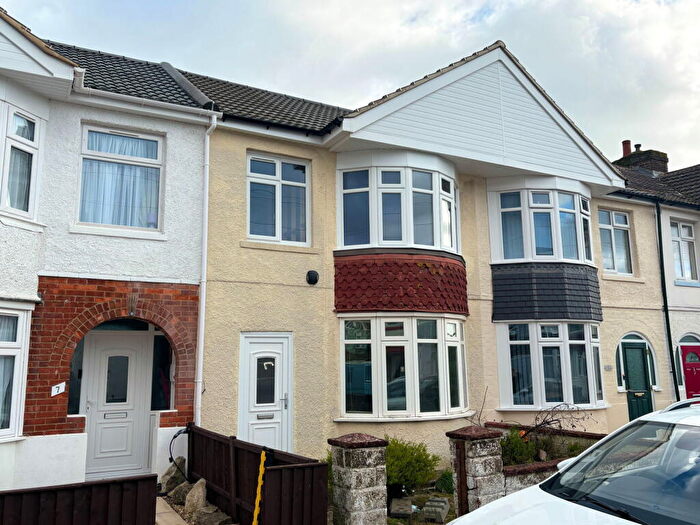
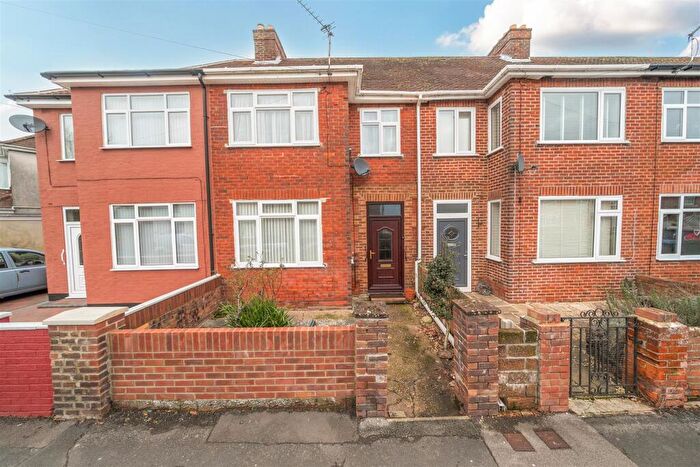
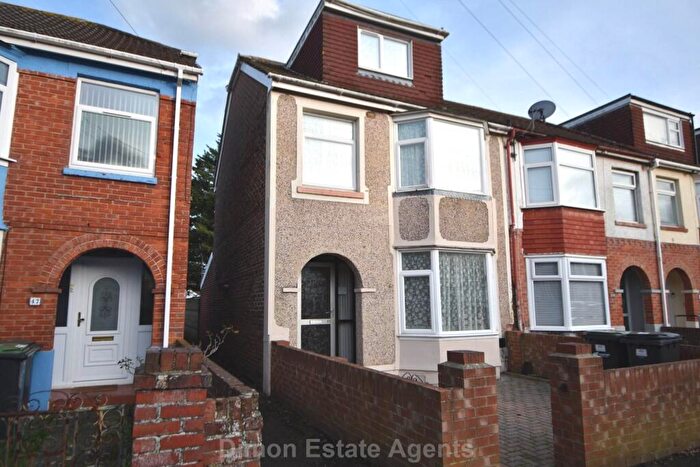
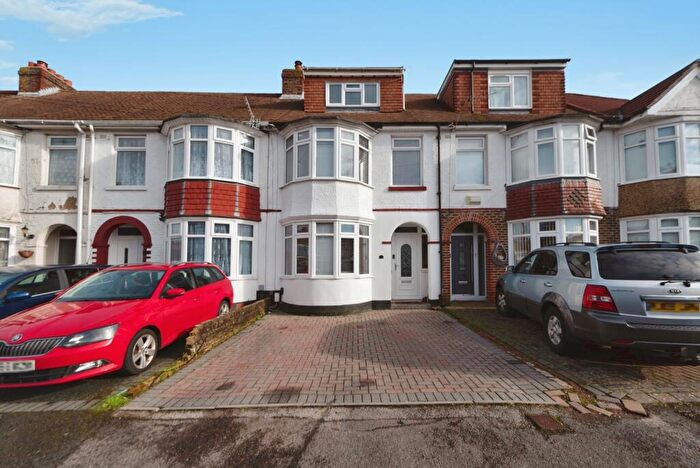
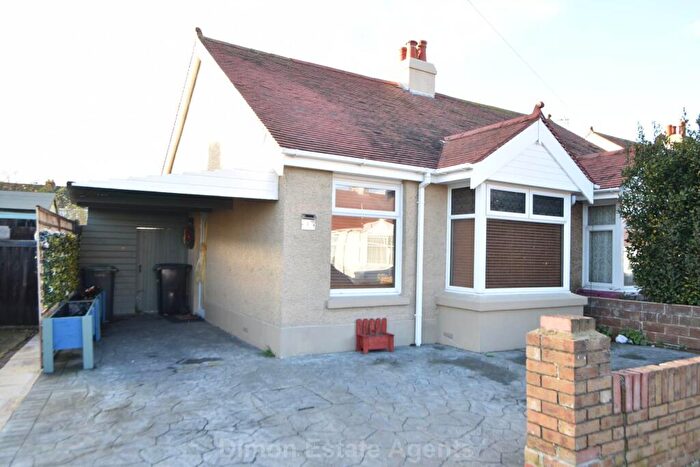
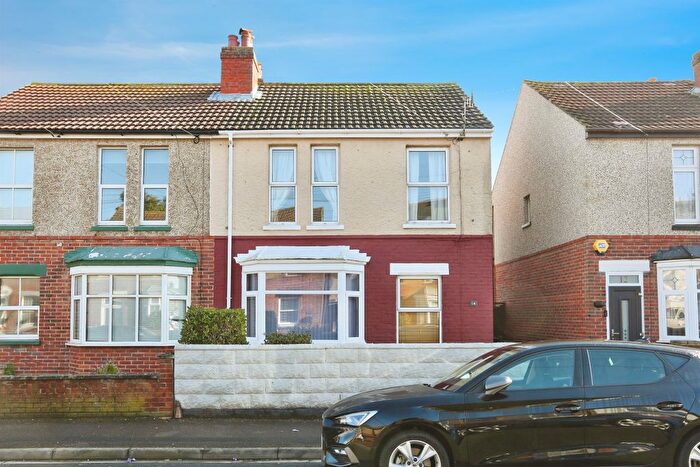
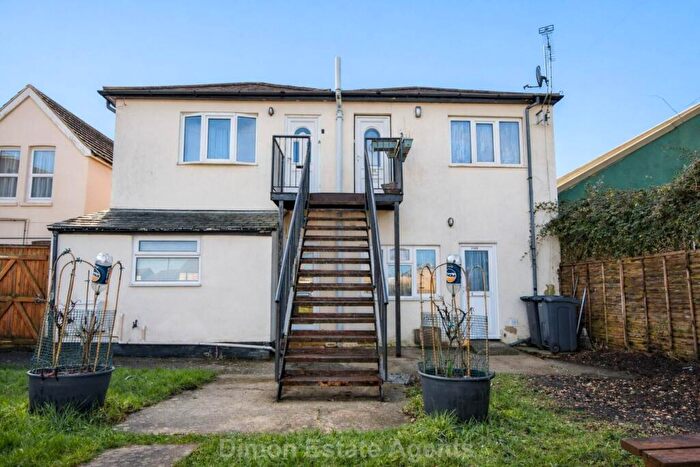
Houses for sale & to rent in Elson, Gosport
House Prices in Elson
Properties in Elson have an average house price of £255,372.00 and had 174 Property Transactions within the last 3 years¹.
Elson is an area in Gosport, Hampshire with 1,931 households², where the most expensive property was sold for £565,000.00.
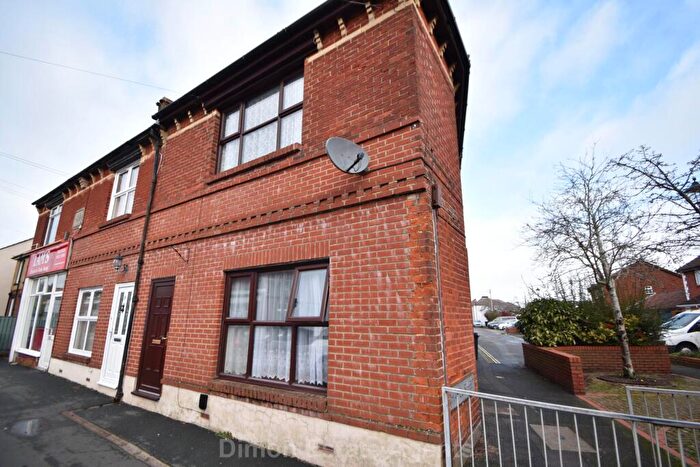
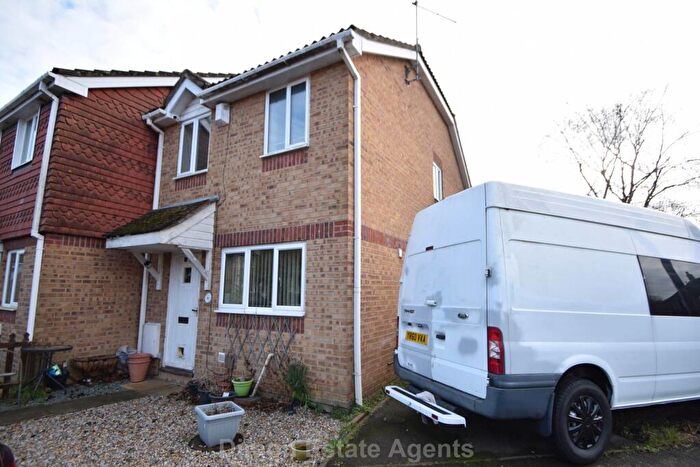
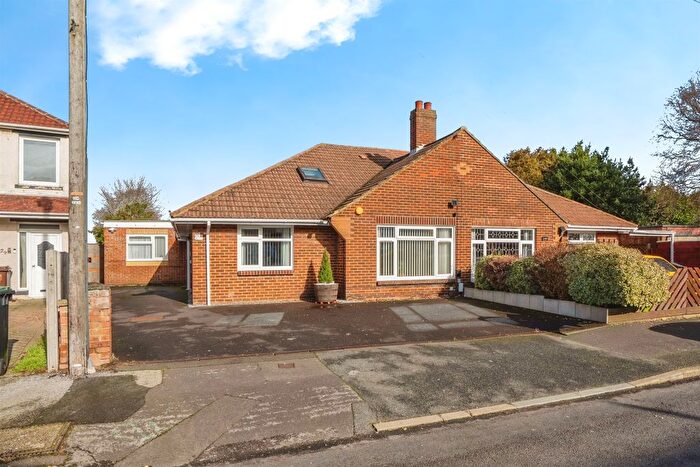
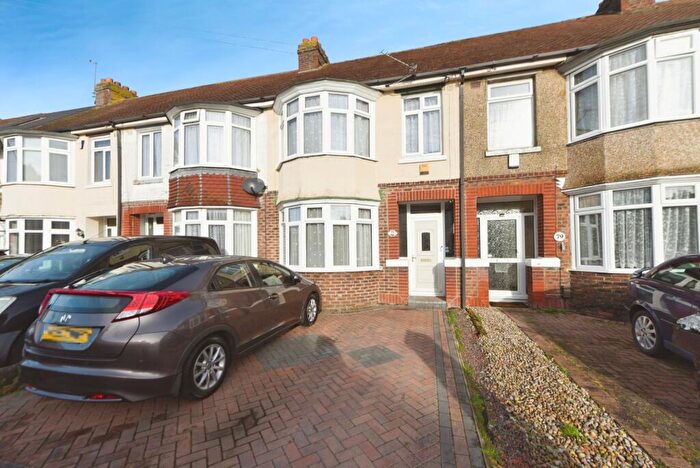
Properties for sale in Elson
Roads and Postcodes in Elson
Navigate through our locations to find the location of your next house in Elson, Gosport for sale or to rent.
| Streets | Postcodes |
|---|---|
| Alphage Road | PO12 4DU |
| Anthony Grove | PO12 4AR PO12 4AS |
| Battery Close | PO12 4PA |
| Beryl Avenue | PO12 4NZ |
| Blackthorn Drive | PO12 4AZ |
| Bournemouth Avenue | PO12 4NP |
| Brighton Avenue | PO12 4BU PO12 4BX |
| Brockhurst Road | PO12 3BB PO12 3BD |
| Cedar Close | PO12 4AT |
| Chantry Road | PO12 4NA PO12 4NB PO12 4ND PO12 4NE PO12 4NF PO12 4NG |
| Chestnut Walk | PO12 4BH PO12 4BE |
| Cotsworth Road | PO12 4FA |
| Dunkeld Road | PO12 4NH PO12 4NJ |
| Eastbourne Avenue | PO12 4NT PO12 4NU PO12 4NX PO12 4NY |
| Eastbrook Close | PO12 3BP |
| Elson Lane | PO12 4ET PO12 4EU |
| Elson Road | PO12 4AA PO12 4AB PO12 4AD PO12 4AH PO12 4BJ PO12 4BL PO12 4BN PO12 4BT PO12 4BW PO12 4EY PO12 4EZ PO12 4HA |
| Exmouth Road | PO12 4EX |
| Fareham Road | PO13 0AH |
| Frater Lane | PO12 4AU PO12 4AX |
| Gunners Way | PO12 4DS PO12 4DW |
| Ham Lane | PO12 4AL PO12 4AN |
| Hamlet Way | PO12 4DX |
| Hastings Avenue | PO12 4BY PO12 4BZ |
| Heritage Business Park | PO12 4BG |
| Jason Way | PO12 3DT |
| Lovelock Close | PO12 3FE |
| Monks Walk | PO12 4BF |
| Naish Drive | PO12 4AP |
| Orchard Close | PO12 4BB |
| Parker Close | PO12 4BD |
| Quay Lane | PO12 4LB PO12 4LJ |
| Richard Grove | PO12 4BA |
| Rydal Road | PO12 4ES |
| School Road | PO12 4DN |
| Sedgeley Grove | PO12 4NL PO12 4NN |
| Selsey Avenue | PO12 4DJ PO12 4DL |
| Shamrock Enterprise Centre | PO12 4DP |
| Stanley Close | PO12 4AJ |
| Torquay Avenue | PO12 4NS |
| Tynedale Close | PO12 3DD |
| Vicarage Terrace | PO12 4BP |
| Wandesford Place | PO12 4AY |
| Weymouth Avenue | PO12 4NR |
| Wingate Road | PO12 4DR PO12 4HE |
| Worthing Avenue | PO12 4DA PO12 4DB PO12 4DD PO12 4DH |
Transport near Elson
- FAQ
- Price Paid By Year
- Property Type Price
Frequently asked questions about Elson
What is the average price for a property for sale in Elson?
The average price for a property for sale in Elson is £255,372. This amount is 3% higher than the average price in Gosport. There are 1,773 property listings for sale in Elson.
What streets have the most expensive properties for sale in Elson?
The streets with the most expensive properties for sale in Elson are Vicarage Terrace at an average of £365,000, Cedar Close at an average of £315,000 and Weymouth Avenue at an average of £315,000.
What streets have the most affordable properties for sale in Elson?
The streets with the most affordable properties for sale in Elson are Battery Close at an average of £150,000, Brockhurst Road at an average of £168,960 and Blackthorn Drive at an average of £195,237.
Which train stations are available in or near Elson?
Some of the train stations available in or near Elson are Portsmouth Harbour, Portchester and Portsmouth and Southsea.
Property Price Paid in Elson by Year
The average sold property price by year was:
| Year | Average Sold Price | Price Change |
Sold Properties
|
|---|---|---|---|
| 2025 | £252,762 | -3% |
61 Properties |
| 2024 | £259,189 | 2% |
52 Properties |
| 2023 | £254,729 | -1% |
61 Properties |
| 2022 | £257,487 | 12% |
78 Properties |
| 2021 | £227,373 | 1% |
77 Properties |
| 2020 | £224,033 | 3% |
66 Properties |
| 2019 | £216,511 | 7% |
76 Properties |
| 2018 | £201,923 | -8% |
58 Properties |
| 2017 | £218,275 | 16% |
77 Properties |
| 2016 | £183,244 | 7% |
84 Properties |
| 2015 | £169,605 | 4% |
72 Properties |
| 2014 | £162,241 | 10% |
85 Properties |
| 2013 | £145,601 | 0,4% |
51 Properties |
| 2012 | £145,011 | 1% |
45 Properties |
| 2011 | £143,917 | -6% |
62 Properties |
| 2010 | £152,768 | 10% |
54 Properties |
| 2009 | £137,889 | -10% |
37 Properties |
| 2008 | £151,525 | -2% |
43 Properties |
| 2007 | £154,641 | 10% |
103 Properties |
| 2006 | £139,564 | -1% |
112 Properties |
| 2005 | £141,119 | 1% |
80 Properties |
| 2004 | £139,023 | 6% |
117 Properties |
| 2003 | £130,026 | 22% |
95 Properties |
| 2002 | £100,938 | 15% |
104 Properties |
| 2001 | £86,267 | 13% |
102 Properties |
| 2000 | £75,453 | 14% |
127 Properties |
| 1999 | £64,885 | 11% |
128 Properties |
| 1998 | £57,901 | 11% |
111 Properties |
| 1997 | £51,710 | -3% |
123 Properties |
| 1996 | £53,460 | 2% |
92 Properties |
| 1995 | £52,239 | - |
136 Properties |
Property Price per Property Type in Elson
Here you can find historic sold price data in order to help with your property search.
The average Property Paid Price for specific property types in the last three years are:
| Property Type | Average Sold Price | Sold Properties |
|---|---|---|
| Semi Detached House | £284,651.00 | 33 Semi Detached Houses |
| Detached House | £333,666.00 | 9 Detached Houses |
| Terraced House | £258,769.00 | 116 Terraced Houses |
| Flat | £126,318.00 | 16 Flats |

