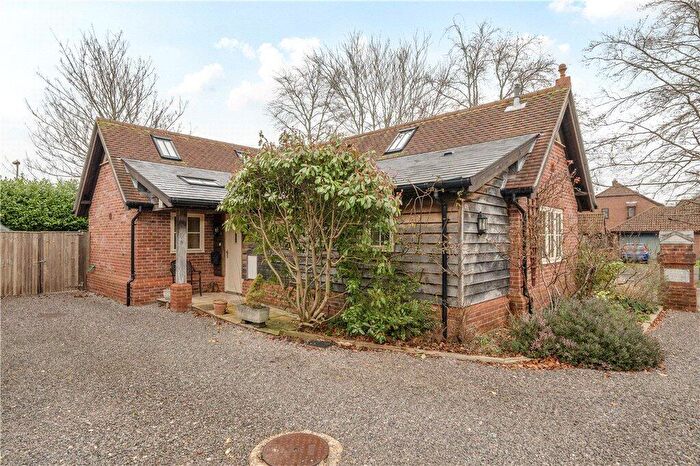
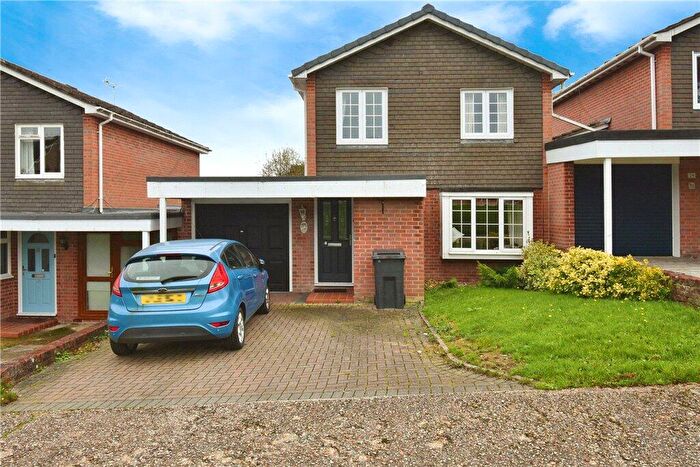
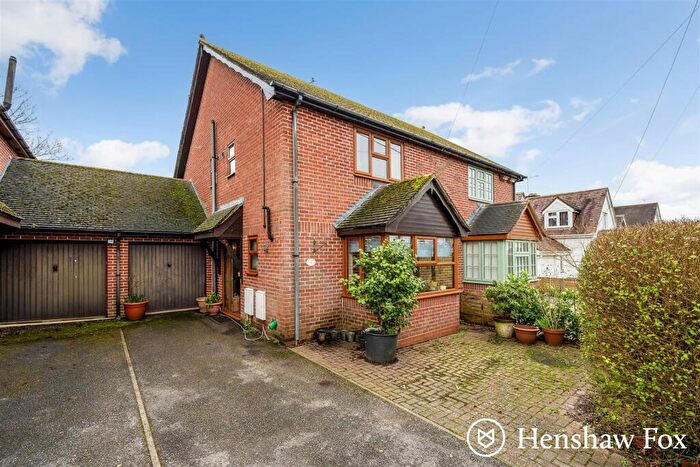
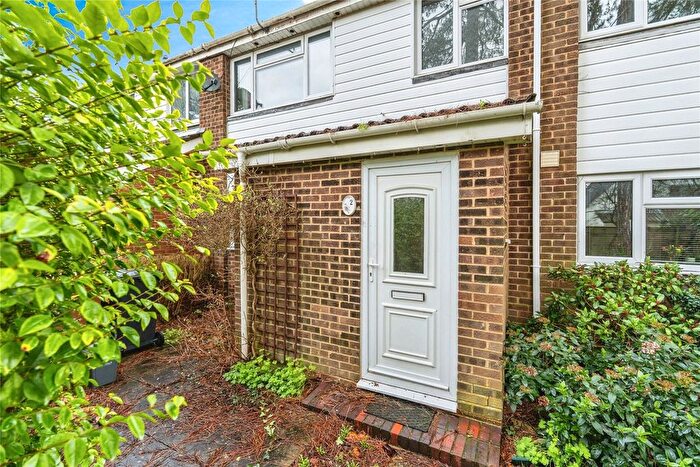
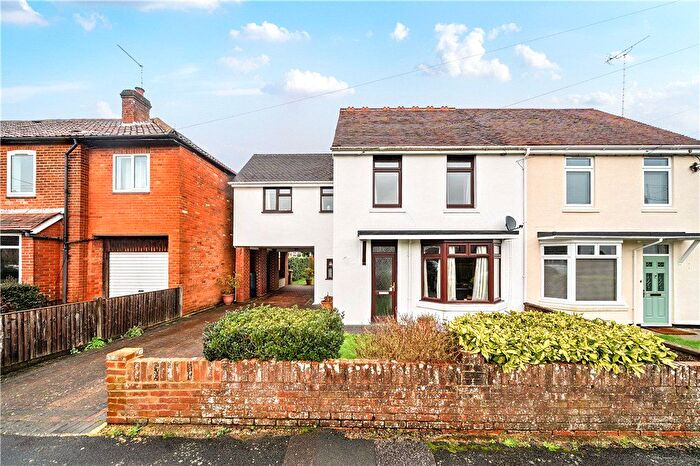
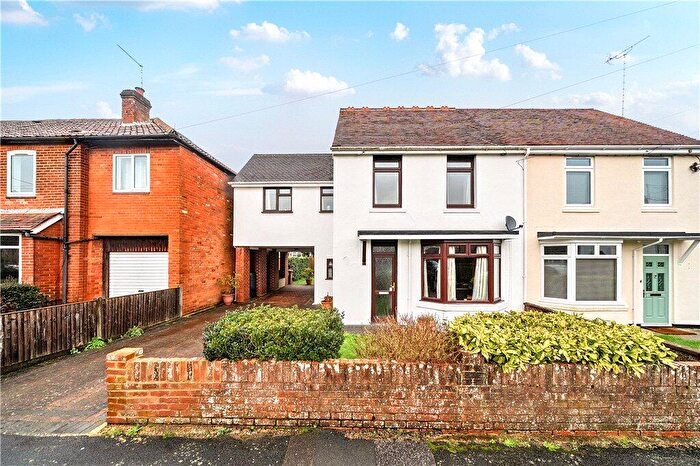
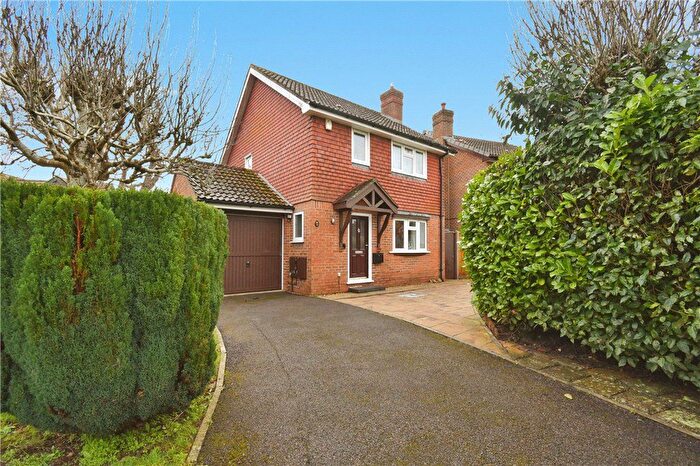
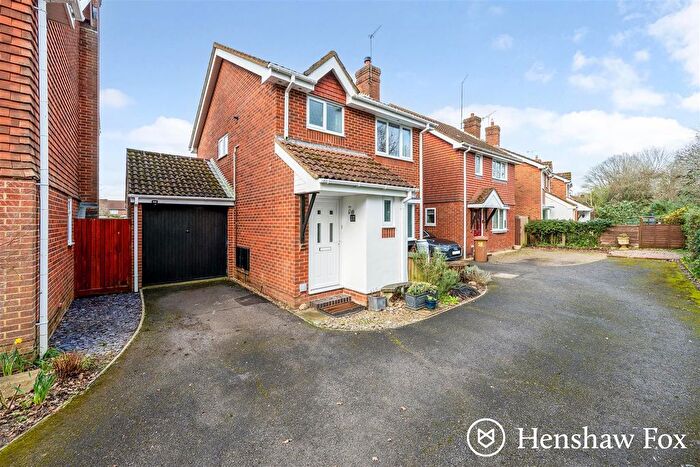
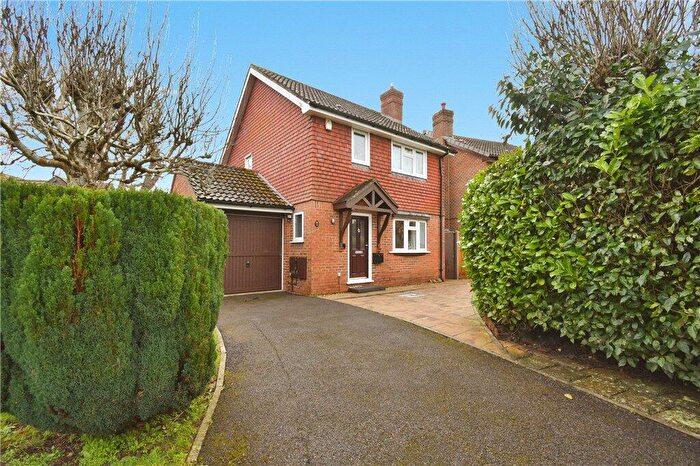
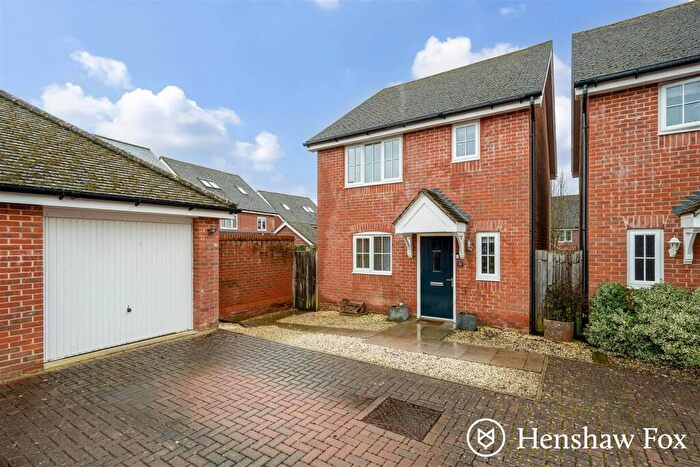
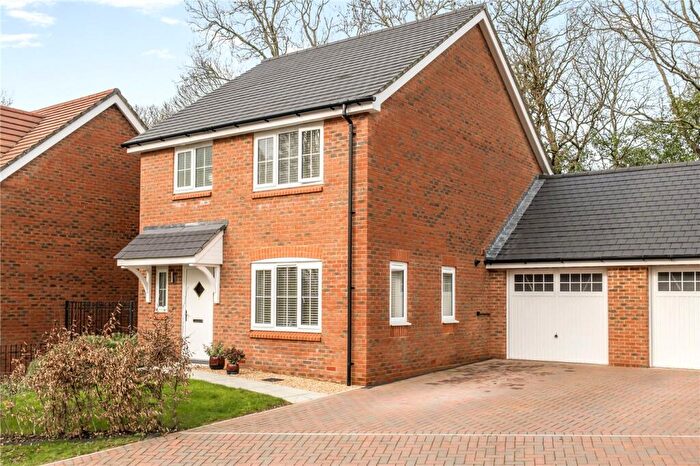
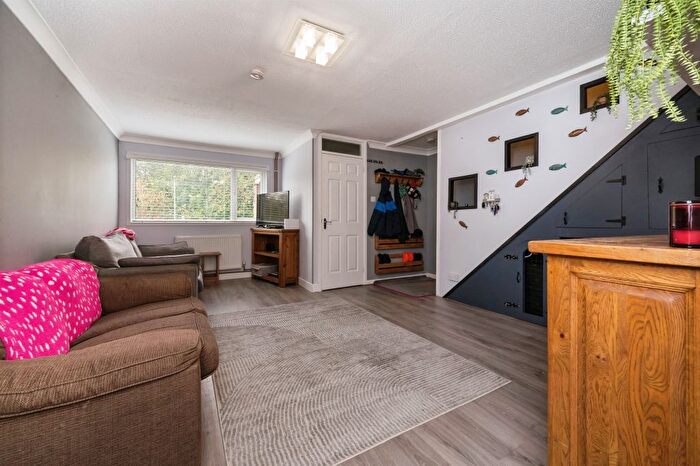
Houses for sale & to rent in Cupernham, Romsey
House Prices in Cupernham
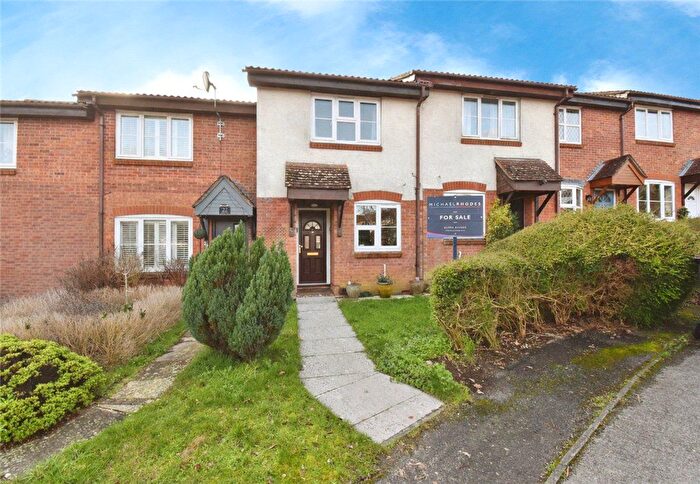
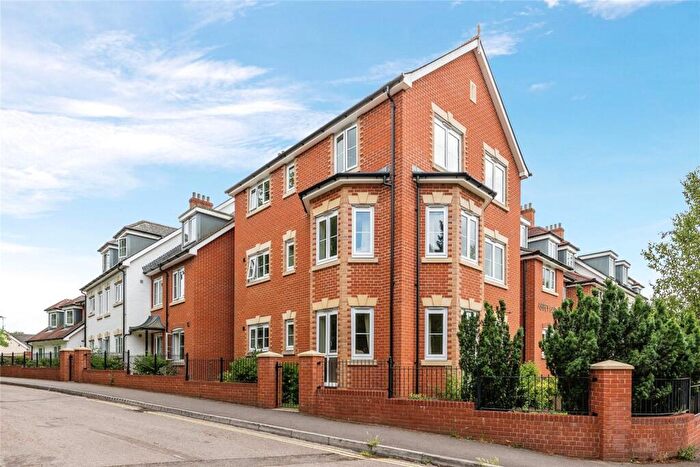
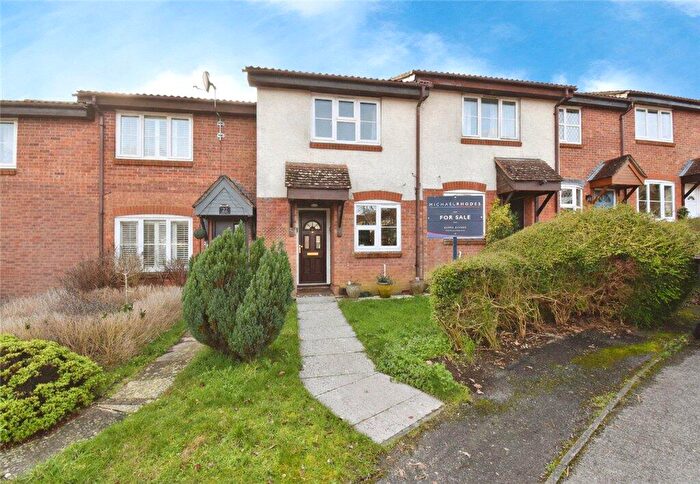
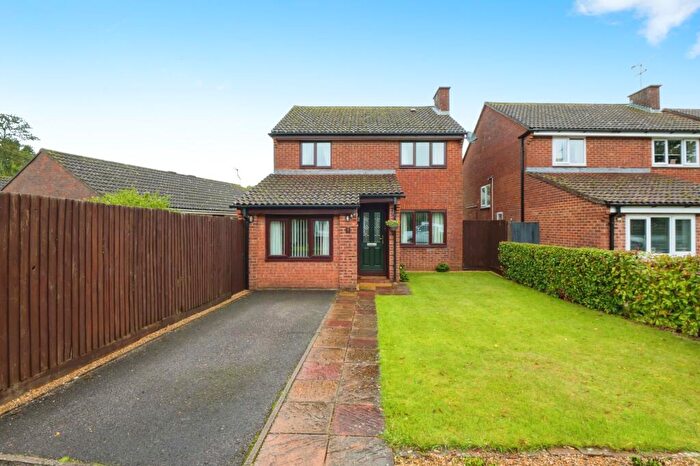
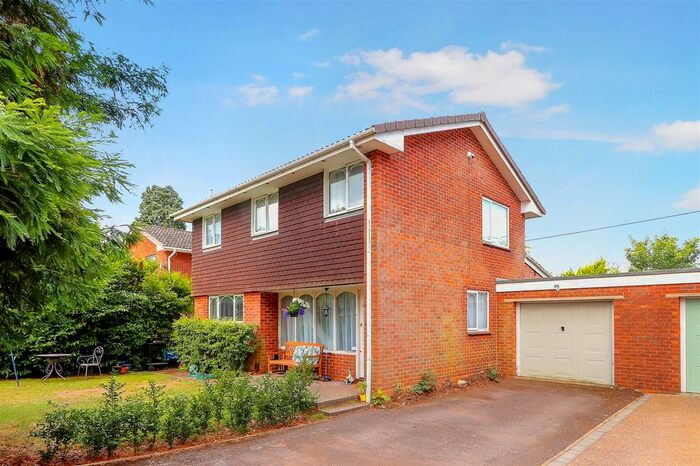
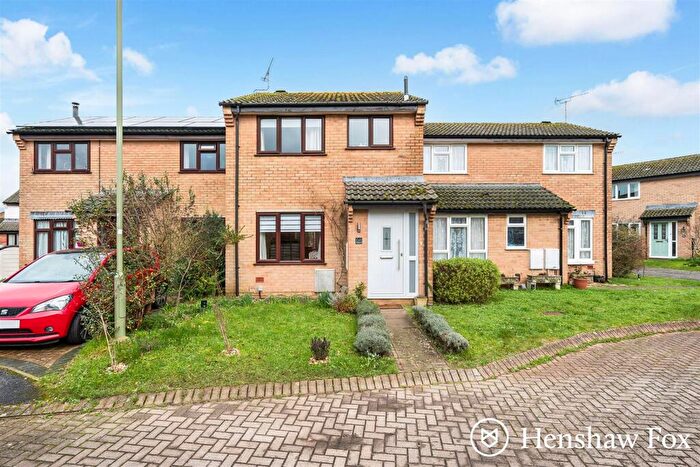
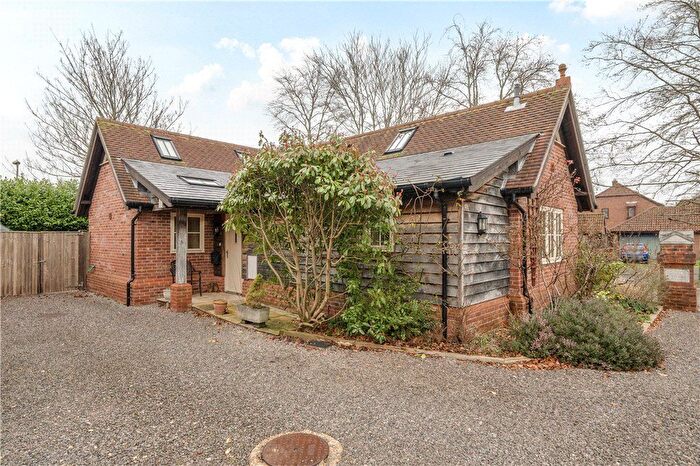
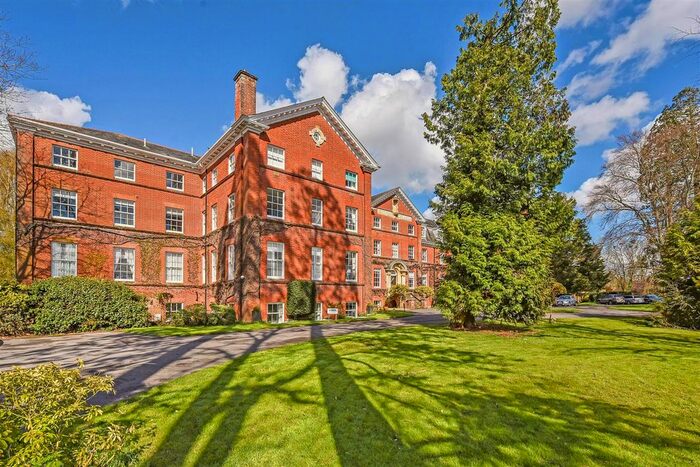
Properties in Cupernham have an average house price of £415,239.00 and had 202 Property Transactions within the last 3 years¹.
Cupernham is an area in Romsey, Hampshire with 2,132 households², where the most expensive property was sold for £935,000.00.
Properties for sale in Cupernham
Roads and Postcodes in Cupernham
Navigate through our locations to find the location of your next house in Cupernham, Romsey for sale or to rent.
| Streets | Postcodes |
|---|---|
| Abbotswood Close | SO51 7TW |
| Addison Close | SO51 7TL |
| Ashley Meadows | SO51 7LT |
| Barton Close | SO51 7QE |
| Beverley Gardens | SO51 7TA |
| Bow Lane | SO51 7NA |
| Bransley Close | SO51 7JT |
| Brook Way | SO51 7JZ |
| Canal Close | SO51 7WE |
| Canal Walk | SO51 7AP SO51 7LP |
| Carisbrooke Court | SO51 7JQ |
| Cavendish Close | SO51 7HT |
| Clarendon Close | SO51 7TB |
| Cupernham Close | SO51 7LH |
| Cupernham Lane | SO51 7JH SO51 7JJ SO51 7LD SO51 7LF SO51 7LG |
| Durban Close | SO51 7LJ |
| Eldridge Gardens | SO51 7RT |
| Fairview Close | SO51 7LS |
| Fairview Drive | SO51 7LQ SO51 7LR |
| Gaston Gardens | SO51 7RZ |
| Grayling Mead | SO51 7RU |
| Great Well Drive | SO51 7QN SO51 7QP |
| Greenwood Close | SO51 7QT |
| Halden Close | SO51 7TS |
| Hayter Gardens | SO51 7QU |
| Hogarth Close | SO51 7TF |
| Home Field | SO51 7WG |
| Horsecroft | SO51 0GS |
| Horseshoe Drive | SO51 7TP |
| Kingfisher Way | SO51 7RY |
| Kinver Close | SO51 7JU SO51 7JW |
| Latham Road | SO51 7DB SO51 7DE |
| Laurence Mews | SO51 7SB |
| Lincoln Close | SO51 7TJ |
| Mallard Close | SO51 7DD |
| Mercer Way | SO51 7PH SO51 7PN SO51 7QH SO51 7QJ |
| Nelson Close | SO51 7DA |
| Neville Drive | SO51 7RP |
| New Road | SO51 7LL SO51 7LN |
| Newlyn Walk | SO51 7WB |
| Oakwood Close | SO51 7TU |
| Oatlands | SO51 0GT SO51 0GU SO51 0GW |
| Old Road | SO51 7WH |
| Oxlease Close | SO51 7HA |
| Pinewood Close | SO51 7TN |
| Ralph Lane | SO51 7JP |
| Richmond Lane | SO51 7LA SO51 7LB |
| Rimington Gardens | SO51 7TT |
| Rowse Close | SO51 7RN |
| Savernake Close | SO51 7TD |
| Smiths Field | SO51 7WD |
| St Johns Gardens | SO51 7RW |
| Stapleford Close | SO51 7HU |
| Sutherland Close | SO51 7TH SO51 7TX |
| Tavistock Close | SO51 7TQ SO51 7TY |
| Tench Way | SO51 7RX |
| The Cloisters | SO51 7RS |
| The Meadows | SO51 0GX |
| Tithe Mead | SO51 7SD |
| Warren Gardens | SO51 7TR |
| Waterside Road | SO51 7WF |
| Waverley Close | SO51 7TG |
| Westbroke Gardens | SO51 7RQ |
| Winchester Hill | SO51 7ND SO51 7NL |
| Windfield Drive | SO51 7RL |
| Withy Close | SO51 7SA |
| Woodlands Gardens | SO51 7TE |
| Woodley Lane | SO51 7HX SO51 7JL SO51 7JN SO51 7JR SO51 7JS SO51 7JX |
Transport near Cupernham
- FAQ
- Price Paid By Year
- Property Type Price
Frequently asked questions about Cupernham
What is the average price for a property for sale in Cupernham?
The average price for a property for sale in Cupernham is £415,239. This amount is 11% lower than the average price in Romsey. There are 1,917 property listings for sale in Cupernham.
What streets have the most expensive properties for sale in Cupernham?
The streets with the most expensive properties for sale in Cupernham are Windfield Drive at an average of £800,000, Winchester Hill at an average of £784,375 and Tithe Mead at an average of £775,000.
What streets have the most affordable properties for sale in Cupernham?
The streets with the most affordable properties for sale in Cupernham are Sutherland Close at an average of £183,323, Great Well Drive at an average of £200,555 and Tavistock Close at an average of £201,200.
Which train stations are available in or near Cupernham?
Some of the train stations available in or near Cupernham are Romsey, Mottisfont and Dunbridge and Chandlers Ford.
Property Price Paid in Cupernham by Year
The average sold property price by year was:
| Year | Average Sold Price | Price Change |
Sold Properties
|
|---|---|---|---|
| 2025 | £429,280 | 10% |
66 Properties |
| 2024 | £387,337 | -11% |
68 Properties |
| 2023 | £429,514 | 4% |
68 Properties |
| 2022 | £411,760 | 16% |
73 Properties |
| 2021 | £344,630 | 1% |
98 Properties |
| 2020 | £342,344 | 2% |
56 Properties |
| 2019 | £336,579 | 4% |
78 Properties |
| 2018 | £321,881 | 3% |
83 Properties |
| 2017 | £311,573 | 5% |
94 Properties |
| 2016 | £295,648 | 6% |
85 Properties |
| 2015 | £278,294 | 11% |
77 Properties |
| 2014 | £246,780 | 5% |
109 Properties |
| 2013 | £233,496 | -14% |
92 Properties |
| 2012 | £265,874 | 5% |
64 Properties |
| 2011 | £251,523 | -3% |
75 Properties |
| 2010 | £258,120 | 8% |
66 Properties |
| 2009 | £236,675 | 7% |
69 Properties |
| 2008 | £221,235 | -16% |
39 Properties |
| 2007 | £256,037 | 16% |
143 Properties |
| 2006 | £214,597 | 7% |
135 Properties |
| 2005 | £200,628 | -4% |
80 Properties |
| 2004 | £208,348 | 12% |
111 Properties |
| 2003 | £182,490 | 3% |
87 Properties |
| 2002 | £176,197 | 23% |
132 Properties |
| 2001 | £135,112 | -9% |
113 Properties |
| 2000 | £147,180 | 33% |
132 Properties |
| 1999 | £98,701 | 9% |
124 Properties |
| 1998 | £90,214 | 5% |
135 Properties |
| 1997 | £86,061 | -1% |
184 Properties |
| 1996 | £86,590 | 19% |
228 Properties |
| 1995 | £69,888 | - |
86 Properties |
Property Price per Property Type in Cupernham
Here you can find historic sold price data in order to help with your property search.
The average Property Paid Price for specific property types in the last three years are:
| Property Type | Average Sold Price | Sold Properties |
|---|---|---|
| Semi Detached House | £405,069.00 | 36 Semi Detached Houses |
| Detached House | £620,617.00 | 68 Detached Houses |
| Terraced House | £309,841.00 | 79 Terraced Houses |
| Flat | £137,710.00 | 19 Flats |

