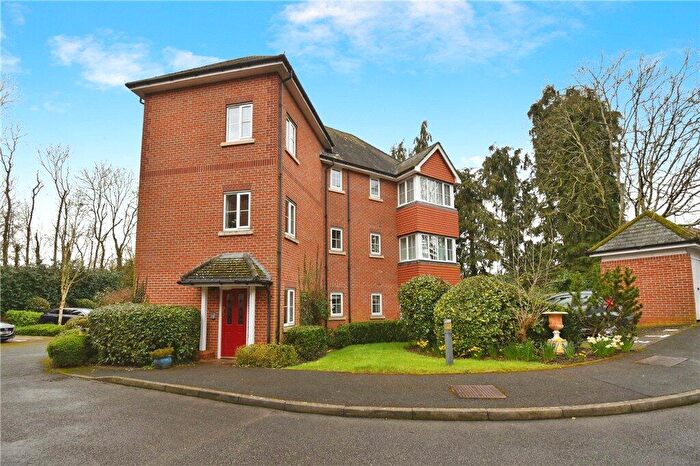
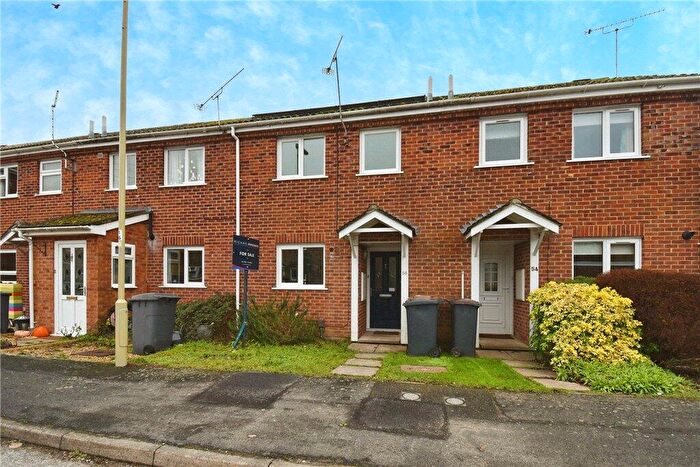
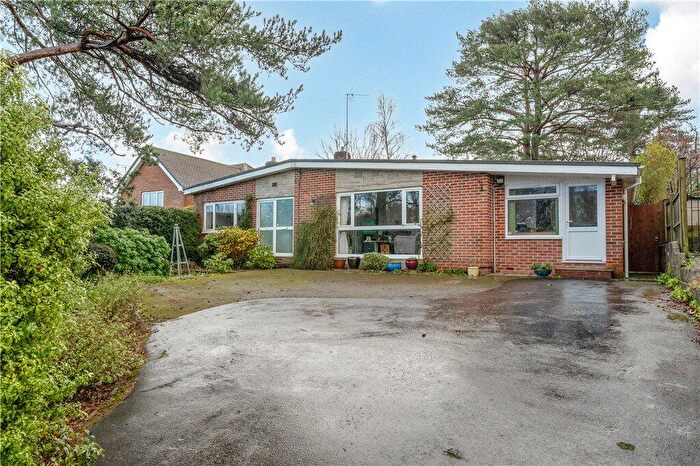
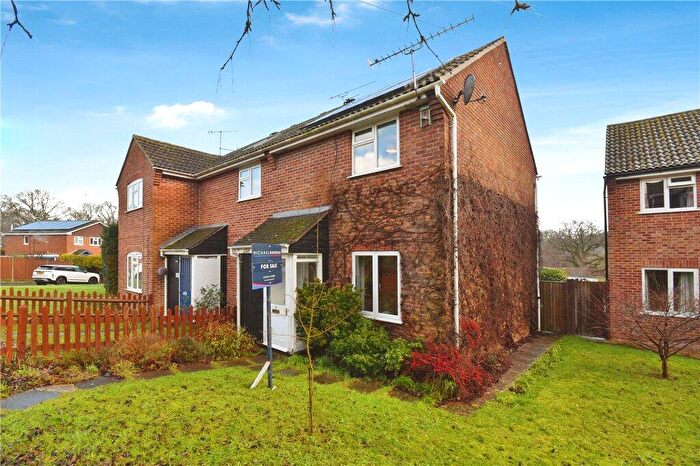
Houses for sale & to rent in Tadburn, Romsey
House Prices in Tadburn
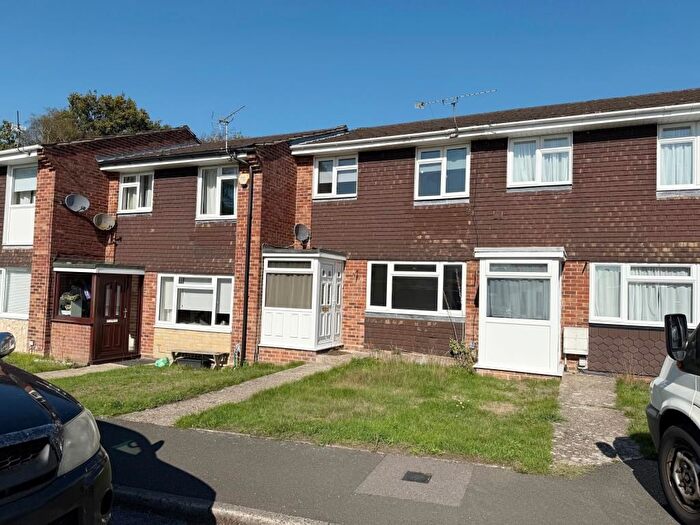
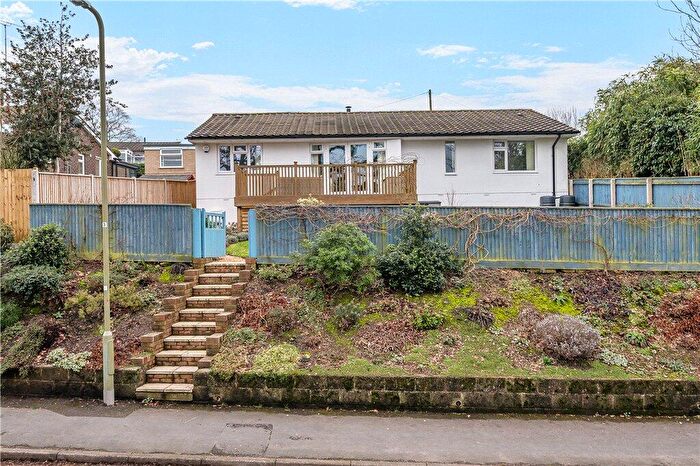
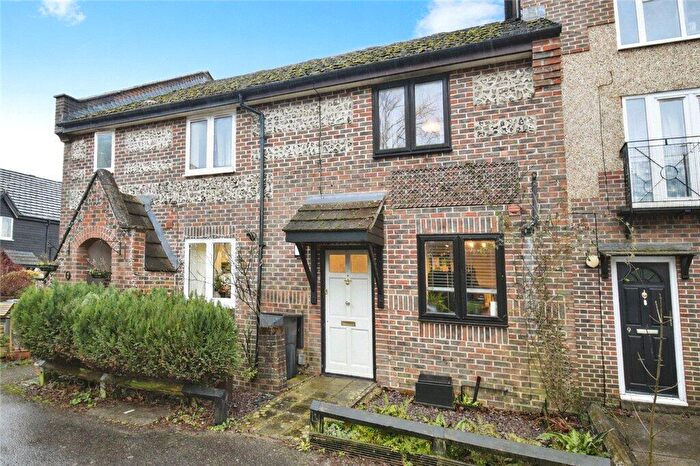
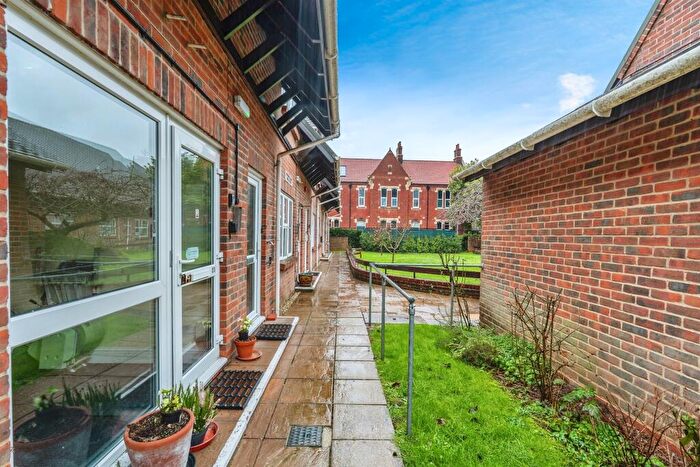
Properties in Tadburn have an average house price of £366,901.00 and had 221 Property Transactions within the last 3 years¹.
Tadburn is an area in Romsey, Hampshire with 2,146 households², where the most expensive property was sold for £925,000.00.
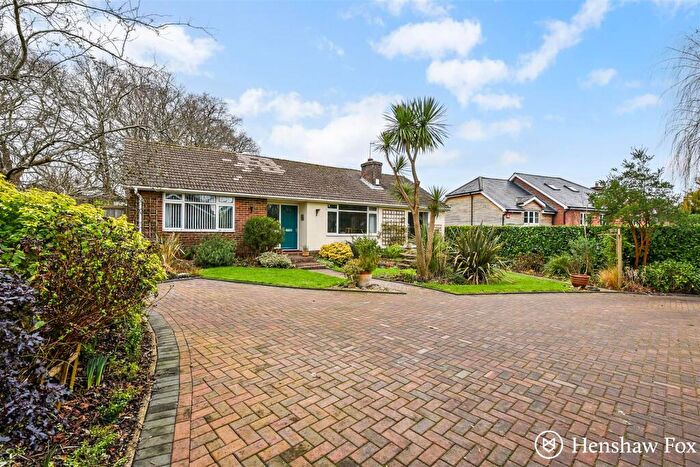
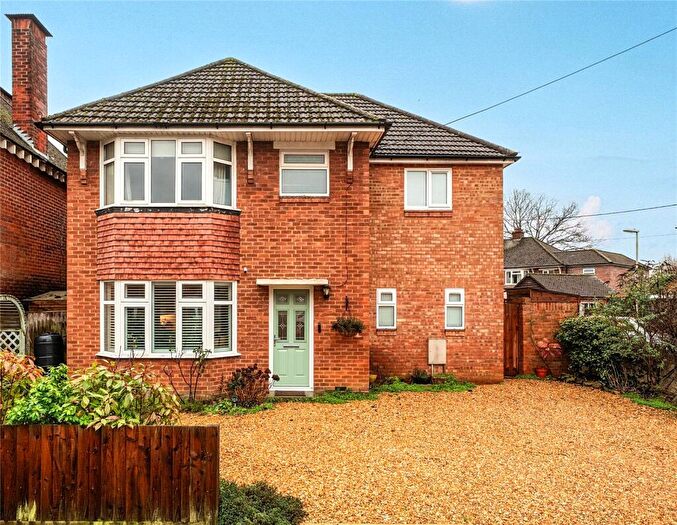
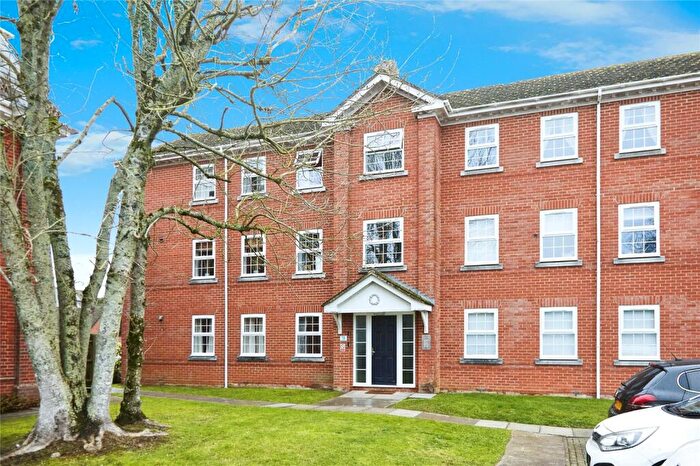
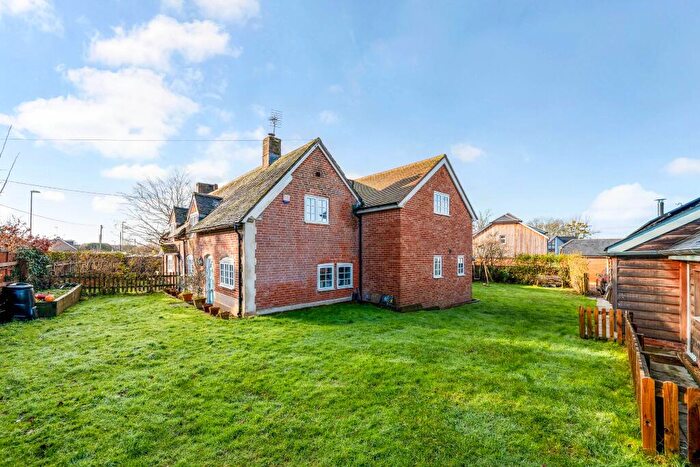
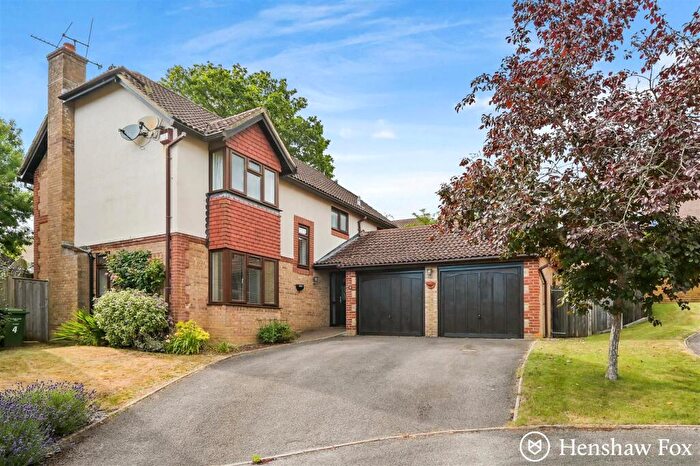
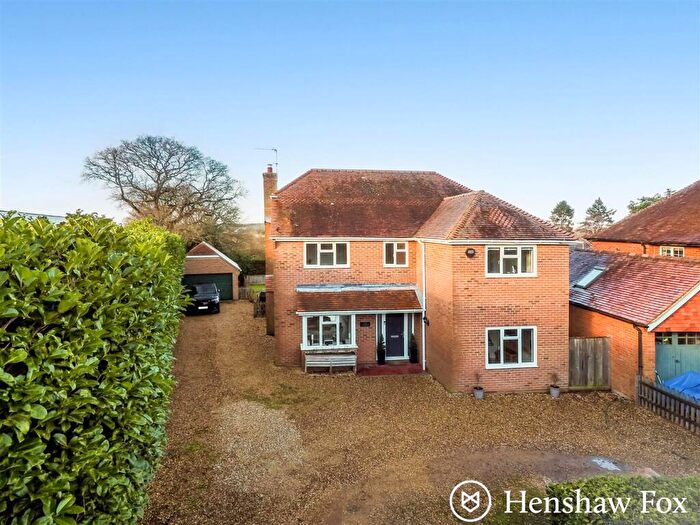
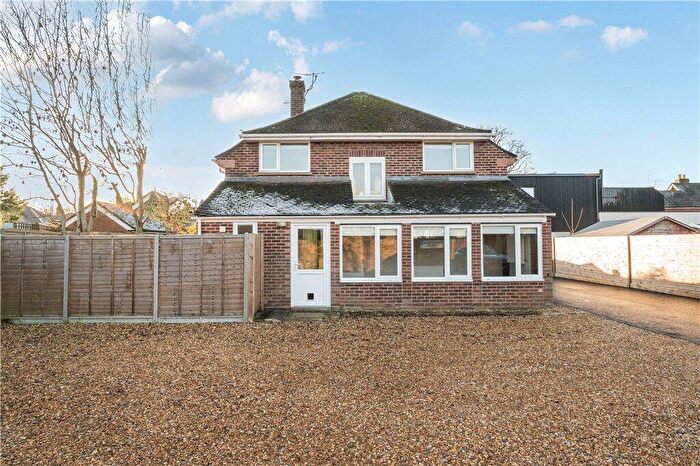
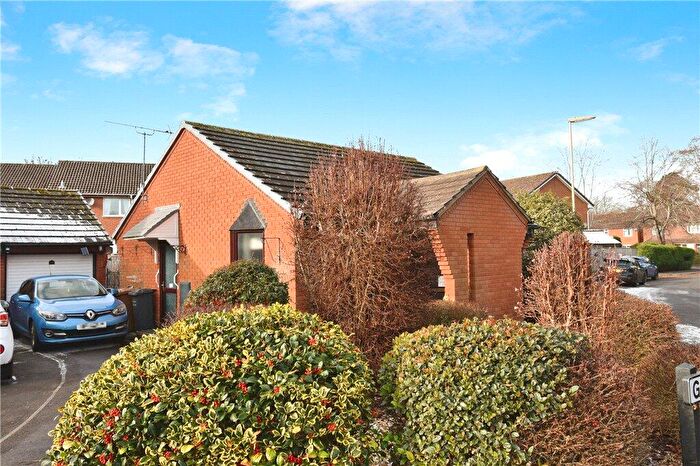
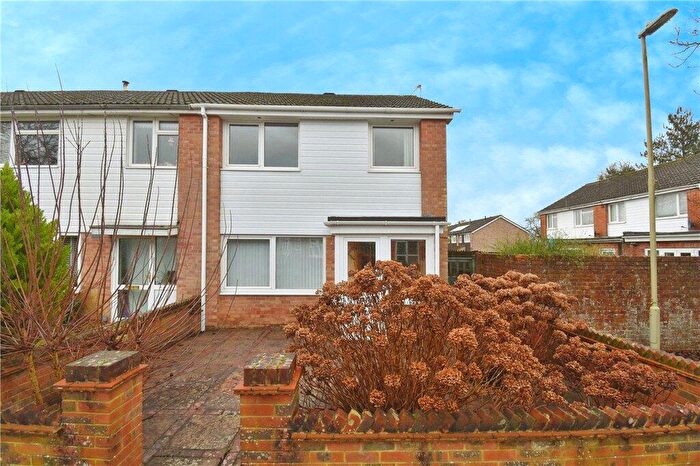
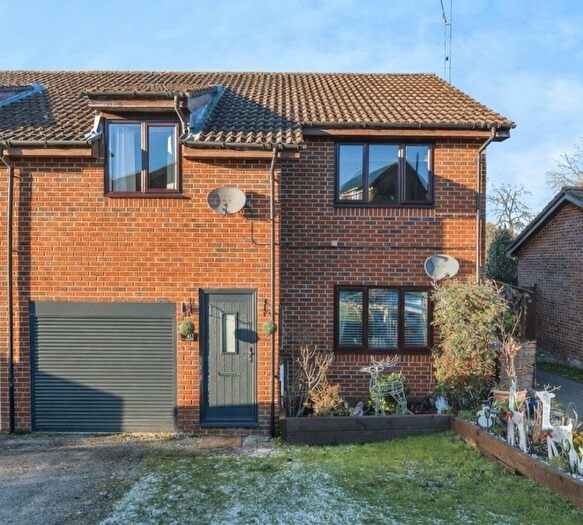
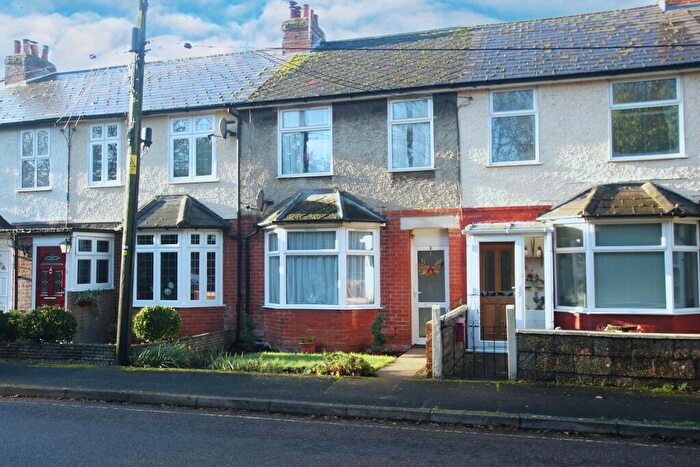
Properties for sale in Tadburn
Roads and Postcodes in Tadburn
Navigate through our locations to find the location of your next house in Tadburn, Romsey for sale or to rent.
| Streets | Postcodes |
|---|---|
| Alder Close | SO51 5SJ |
| Allan Grove | SO51 5BH |
| Anton Close | SO51 5QD |
| Ash Close | SO51 5RX |
| Ashdown Way | SO51 5QR |
| Avon Crescent | SO51 5PX SO51 5PY |
| Beech Close | SO51 5SR |
| Benedict Close | SO51 8PN |
| Birch Close | SO51 5SQ |
| Botley Road | SO51 5AT SO51 5PL SO51 5RQ SO51 5SX SO51 5TA |
| Brickwoods Close | SO51 7JA |
| Chambers Avenue | SO51 5BE SO51 5BG SO51 5BJ SO51 5EH SO51 5FY SO51 5FZ SO51 5GX |
| Chestnut Close | SO51 5SP |
| Chirk Place | SO51 7NP |
| Deansfield Close | SO51 7NE |
| Eight Acres | SO51 5BP SO51 5BQ |
| Faber Mews | SO51 7JD |
| Field Close | SO51 5BN |
| Grays Close | SO51 5PG |
| Halterworth Close | SO51 5QG |
| Halterworth Lane | SO51 9AD SO51 9AH |
| Harefield Court | SO51 7NN |
| Hereward Close | SO51 5RA |
| High Firs Gardens | SO51 5QA |
| High Firs Road | SO51 5PZ |
| Hillside Avenue | SO51 5AZ SO51 5BA SO51 5BB |
| Holyborne Road | SO51 5QW |
| Jacobs Close | SO51 5UZ |
| Jenner Way | SO51 8PD |
| Kennett Close | SO51 5PR |
| Kennett Road | SO51 5PQ |
| Knyght Close | SO51 5UX |
| Maple Close | SO51 5RZ |
| Mead Close | SO51 5QX |
| Meon Close | SO51 5PW |
| Meon Road | SO51 5PU |
| Montfort Close | SO51 5PH |
| Montfort Heights | SO51 9LP |
| Montfort Road | SO51 5SF SO51 5SL SO51 5SS |
| Mount Temple | SO51 5UW |
| Nerquis Close | SO51 7LU |
| Nightingale Close | SO51 5AY |
| Northlands Road | SO51 5RU SO51 5RW SO51 5RY SO51 5SA SO51 5SD SO51 5SE |
| Nursery Gardens | SO51 5UU |
| Oakleigh Gardens | SO51 5AS |
| Petty Close | SO51 5UY |
| Pine Road | SO51 5SG |
| Rowan Close | SO51 5SH |
| Saxon Way | SO51 5PP SO51 5PS SO51 5PT SO51 5QB SO51 5QF SO51 5QP SO51 5QY |
| Selsdon Avenue | SO51 7PL |
| Senlac Road | SO51 5RB SO51 5RE SO51 5RF |
| Seward Rise | SO51 8PE |
| St Barbe Close | SO51 5RH |
| St Blaize Road | SO51 7JY SO51 7LW |
| Strongs Close | SO51 7JB |
| Sycamore Close | SO51 5SB |
| Sydmanton Road | SO51 5RL |
| Symes Road | SO51 5BD |
| Tadburn Road | SO51 5AU SO51 5AX SO51 5BL SO51 5HS SO51 5HW SO51 5PF |
| The Crescent | SO51 7NG |
| The Tyleshades | SO51 5RJ |
| The Vikings | SO51 5RG |
| Viney Avenue | SO51 7NQ SO51 7NR SO51 7NS SO51 7NT |
| Wessex Gardens | SO51 5RD |
| Westering | SO51 7LX SO51 7LY |
| Whitenap Close | SO51 5RT |
| Whitenap Lane | SO51 5RS |
| Wills Way | SO51 5HZ |
| Winchester Hill | SO51 7NF SO51 7NH SO51 7NJ |
Transport near Tadburn
-
Romsey Station
-
Chandlers Ford Station
-
Mottisfont and Dunbridge Station
-
Redbridge Station
-
Totton Station
- FAQ
- Price Paid By Year
- Property Type Price
Frequently asked questions about Tadburn
What is the average price for a property for sale in Tadburn?
The average price for a property for sale in Tadburn is £366,901. This amount is 21% lower than the average price in Romsey. There are 1,408 property listings for sale in Tadburn.
What streets have the most expensive properties for sale in Tadburn?
The streets with the most expensive properties for sale in Tadburn are Whitenap Lane at an average of £692,500, The Crescent at an average of £623,333 and Wills Way at an average of £590,000.
What streets have the most affordable properties for sale in Tadburn?
The streets with the most affordable properties for sale in Tadburn are Brickwoods Close at an average of £203,666, Symes Road at an average of £212,500 and Montfort Close at an average of £222,500.
Which train stations are available in or near Tadburn?
Some of the train stations available in or near Tadburn are Romsey, Chandlers Ford and Mottisfont and Dunbridge.
Property Price Paid in Tadburn by Year
The average sold property price by year was:
| Year | Average Sold Price | Price Change |
Sold Properties
|
|---|---|---|---|
| 2025 | £373,727 | -2% |
68 Properties |
| 2024 | £381,626 | 10% |
79 Properties |
| 2023 | £344,907 | -17% |
74 Properties |
| 2022 | £404,931 | 15% |
80 Properties |
| 2021 | £345,509 | 7% |
115 Properties |
| 2020 | £321,954 | 7% |
66 Properties |
| 2019 | £299,136 | 3% |
97 Properties |
| 2018 | £291,271 | 1% |
77 Properties |
| 2017 | £288,429 | 3% |
89 Properties |
| 2016 | £279,346 | 4% |
97 Properties |
| 2015 | £268,442 | 9% |
86 Properties |
| 2014 | £244,966 | 10% |
100 Properties |
| 2013 | £220,245 | -8% |
77 Properties |
| 2012 | £237,015 | -6% |
77 Properties |
| 2011 | £250,626 | 10% |
65 Properties |
| 2010 | £225,993 | 3% |
80 Properties |
| 2009 | £218,783 | -2% |
65 Properties |
| 2008 | £222,499 | -6% |
27 Properties |
| 2007 | £236,139 | 10% |
116 Properties |
| 2006 | £212,684 | 0,5% |
143 Properties |
| 2005 | £211,682 | 6% |
91 Properties |
| 2004 | £199,019 | 10% |
103 Properties |
| 2003 | £178,240 | 8% |
77 Properties |
| 2002 | £163,406 | 21% |
123 Properties |
| 2001 | £128,628 | 18% |
111 Properties |
| 2000 | £105,720 | 9% |
77 Properties |
| 1999 | £96,300 | 12% |
127 Properties |
| 1998 | £85,081 | 11% |
120 Properties |
| 1997 | £75,811 | 8% |
108 Properties |
| 1996 | £69,696 | 7% |
109 Properties |
| 1995 | £65,024 | - |
98 Properties |
Property Price per Property Type in Tadburn
Here you can find historic sold price data in order to help with your property search.
The average Property Paid Price for specific property types in the last three years are:
| Property Type | Average Sold Price | Sold Properties |
|---|---|---|
| Semi Detached House | £379,866.00 | 95 Semi Detached Houses |
| Detached House | £482,807.00 | 50 Detached Houses |
| Terraced House | £315,748.00 | 40 Terraced Houses |
| Flat | £228,541.00 | 36 Flats |

