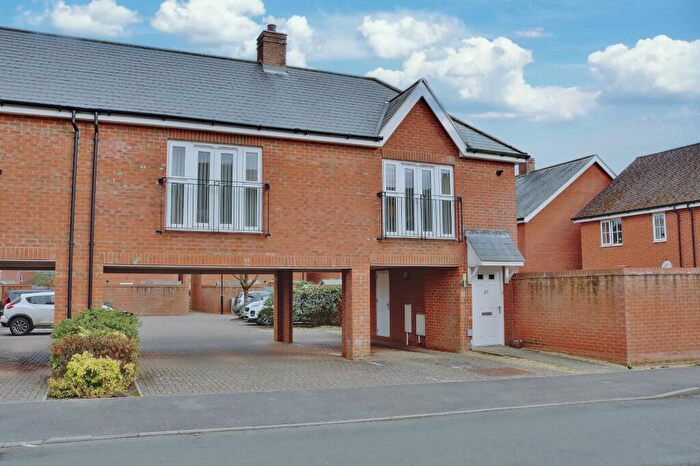
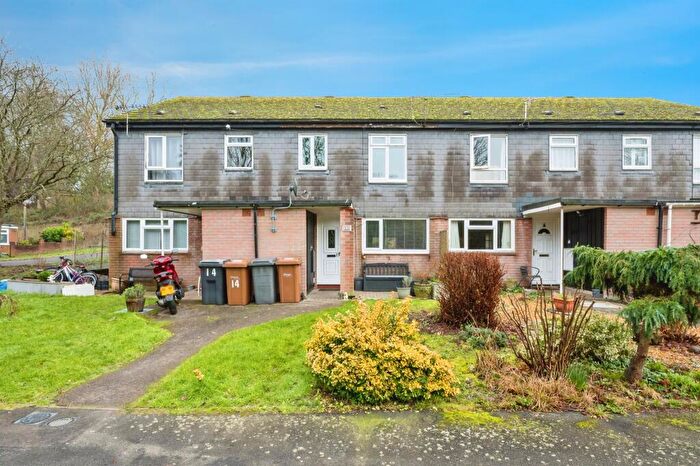
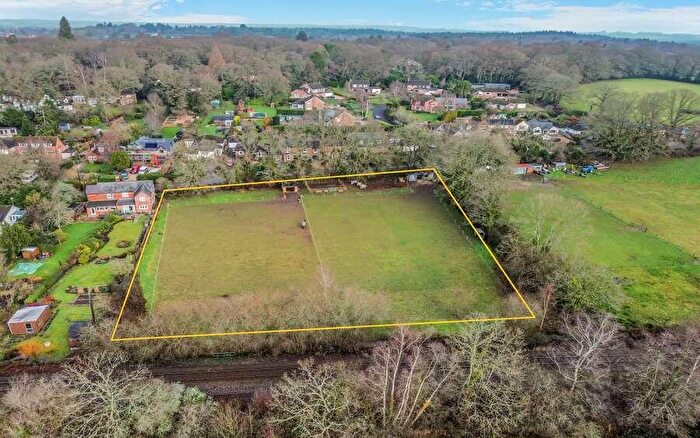
Houses for sale & to rent in Romsey Extra, Romsey
House Prices in Romsey Extra
Properties in Romsey Extra have an average house price of £491,294.00 and had 151 Property Transactions within the last 3 years¹.
Romsey Extra is an area in Romsey, Hampshire with 1,197 households², where the most expensive property was sold for £2,650,000.00.
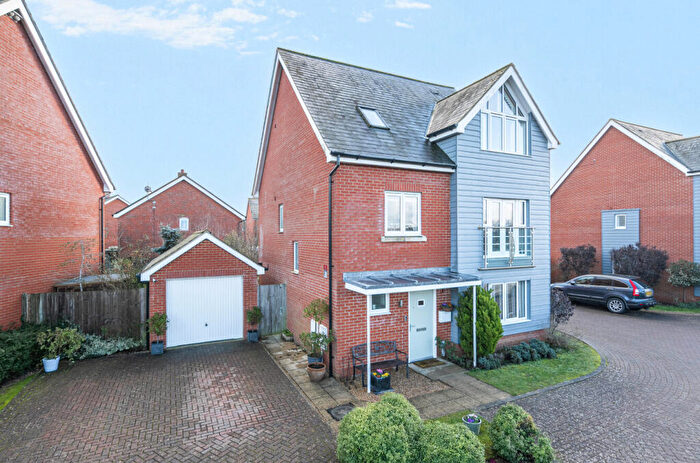
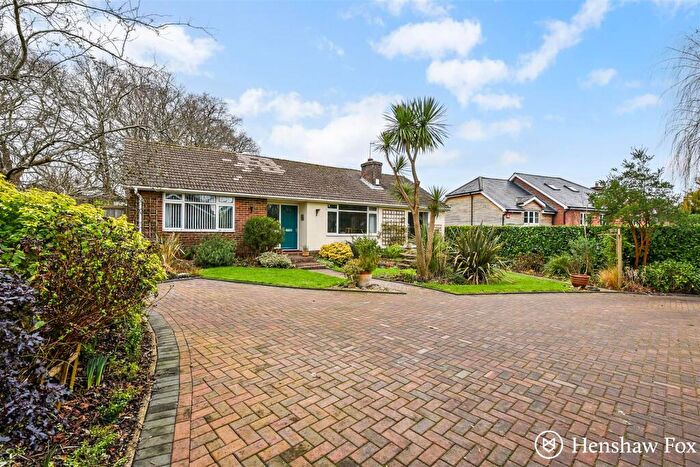
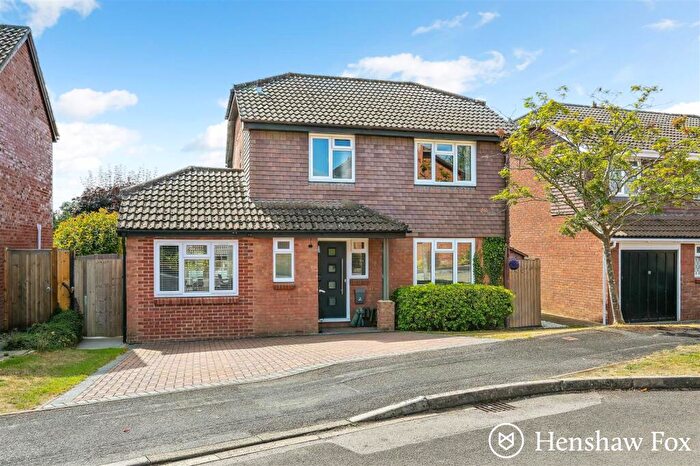
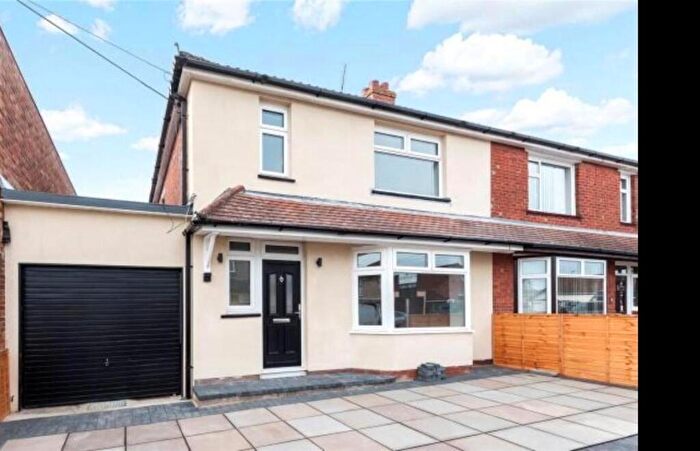
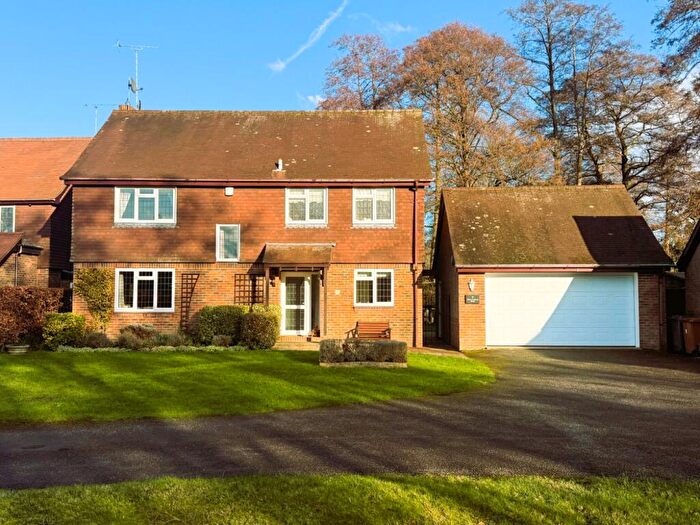
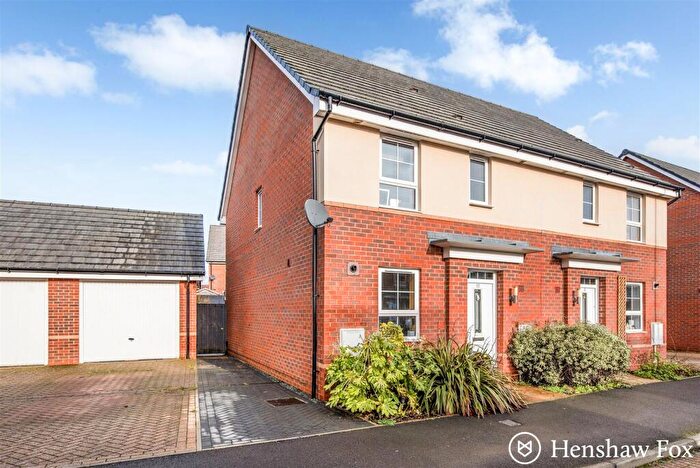
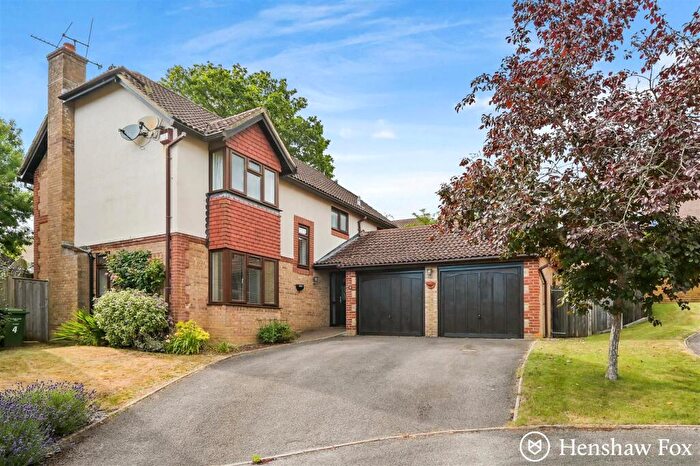
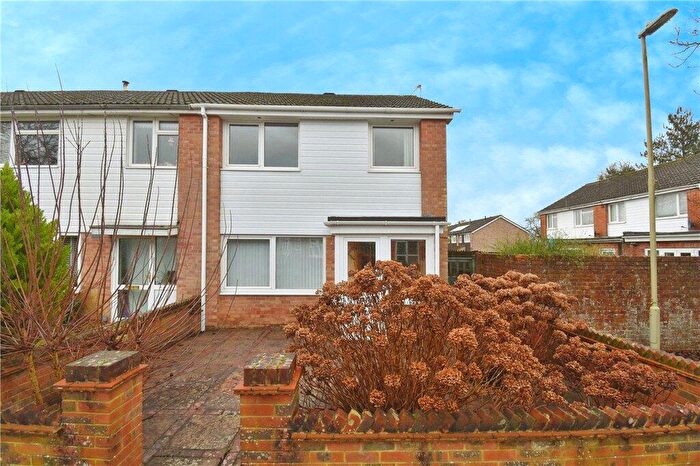
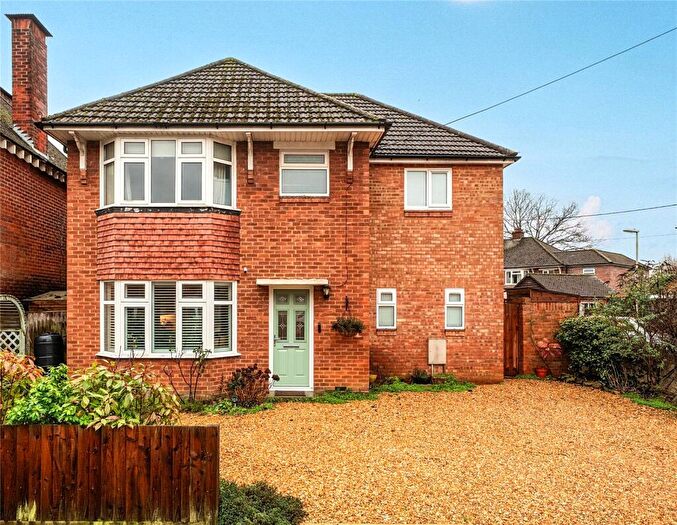
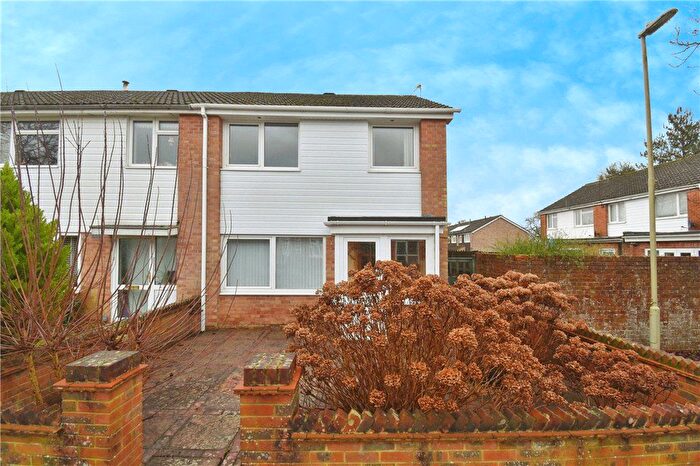
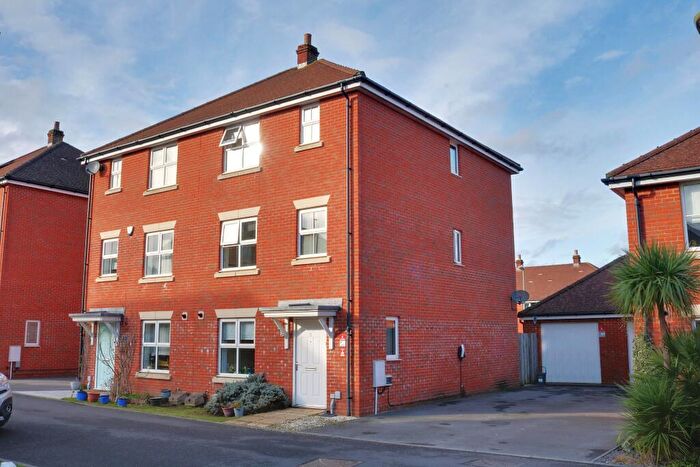
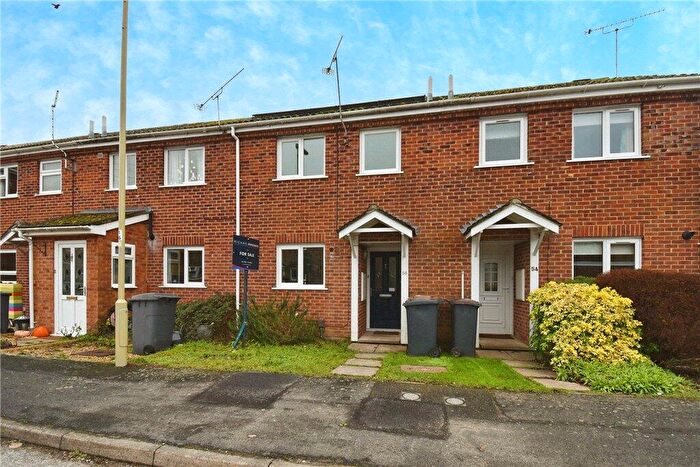
Properties for sale in Romsey Extra
Roads and Postcodes in Romsey Extra
Navigate through our locations to find the location of your next house in Romsey Extra, Romsey for sale or to rent.
| Streets | Postcodes |
|---|---|
| Abbess Close | SO51 0AR |
| Ambrose Way | SO51 0BF |
| Anderson Close | SO51 7UE |
| Belbins | SO51 0PE |
| Botley Road | SO51 5SW |
| Braishfield Road | SO51 0PB SO51 7NZ |
| Bramble Drive | SO51 7RJ |
| Briar Way | SO51 7RA |
| Campion Drive | SO51 7RD |
| Cedar Lawn | SO51 7US |
| Chivers Road | SO51 0AT |
| Clover Way | SO51 7RG |
| Coltsfoot Walk | SO51 7RH |
| Comfrey Close | SO51 7RE |
| Cowslip Way | SO51 7RR |
| Crampmoor Lane | SO51 9AJ |
| Cupernham Lane | SO51 7LE |
| Cutforth Way | SO51 0BD SO51 0BG |
| Dibben Walk | SO51 7UN |
| Elm Tree Gardens | SO51 5SU |
| Feltham Close | SO51 8PB |
| Five Elms Drive | SO51 5RN |
| Footner Close | SO51 7UD |
| Foster Way | SO51 0AW |
| Freemantle Road | SO51 0AX SO51 0AZ |
| Ganger Road | SO51 7UB |
| Gardeners Lane | SO51 6AD |
| Grange Mews | SO51 7NB |
| Greatbridge Road | SO51 0HB |
| Grovely Way | SO51 9AX |
| Halterworth Lane | SO51 9AE SO51 9AN |
| Hestia Close | SO51 8PA |
| Highwood Lane | SO51 9AF |
| Hooper Drive | SO51 0AU |
| Hunters Crescent | SO51 7UG SO51 7UJ |
| Jermyns Lane | SO51 0QA |
| Luzborough Lane | SO51 9AA |
| Luzborough View | SO51 9AG |
| Magnolia Walk | SO51 0PY |
| Moore Close | SO51 0AQ |
| Norris Close | SO51 7UF |
| North Close | SO51 7UL |
| Old Salisbury Lane | SO51 0GD SO51 0GE SO51 0HD |
| Peel Close | SO51 7UQ |
| Primrose Way | SO51 7RF |
| Ridge Lane | SO51 6AB |
| Romsey Road | SO51 6AE |
| Salisbury Road | SO51 6DJ SO51 6GA |
| Sandy Lane | SO51 0PD |
| School Road | SO51 7NX SO51 7NY |
| Short Hill | SO51 7UH |
| Sorrel Close | SO51 7RB |
| South Close | SO51 7UP |
| St Swithuns Close | SO51 9AP |
| Stanbridge Earls | SO51 0HE |
| Stanbridge Lakes | SO51 0GY |
| Straight Mile | SO51 9BA SO51 9BB |
| Tarver Close | SO51 0BH |
| The Copse | SO51 7UR |
| The Covert | SO51 5QZ |
| The Green | SO51 7UA |
| The Thicket | SO51 5SZ |
| Wadham Close | SO51 0AN |
| Whitenap Lane | SO51 5RR SO51 5ST |
| Winchester Hill | SO51 7NU |
| Winchester Road | SO51 9AL |
| Withers Road | SO51 0AY |
| Woodley Close | SO51 7PD |
| Woodley Way | SO51 7PB |
| Wyndham Drive | SO51 0AP |
| SO51 9NJ |
Transport near Romsey Extra
- FAQ
- Price Paid By Year
- Property Type Price
Frequently asked questions about Romsey Extra
What is the average price for a property for sale in Romsey Extra?
The average price for a property for sale in Romsey Extra is £491,294. This amount is 5% higher than the average price in Romsey. There are 4,672 property listings for sale in Romsey Extra.
What streets have the most expensive properties for sale in Romsey Extra?
The streets with the most expensive properties for sale in Romsey Extra are Straight Mile at an average of £2,316,666, Highwood Lane at an average of £1,430,000 and Stanbridge Lakes at an average of £1,072,500.
What streets have the most affordable properties for sale in Romsey Extra?
The streets with the most affordable properties for sale in Romsey Extra are Braishfield Road at an average of £185,000, Bramble Drive at an average of £200,000 and Freemantle Road at an average of £208,333.
Which train stations are available in or near Romsey Extra?
Some of the train stations available in or near Romsey Extra are Romsey, Mottisfont and Dunbridge and Chandlers Ford.
Property Price Paid in Romsey Extra by Year
The average sold property price by year was:
| Year | Average Sold Price | Price Change |
Sold Properties
|
|---|---|---|---|
| 2025 | £412,500 | -33% |
36 Properties |
| 2024 | £547,333 | 13% |
66 Properties |
| 2023 | £473,702 | 11% |
49 Properties |
| 2022 | £422,970 | -17% |
60 Properties |
| 2021 | £494,808 | 7% |
89 Properties |
| 2020 | £458,172 | 17% |
62 Properties |
| 2019 | £378,939 | -0,1% |
78 Properties |
| 2018 | £379,154 | -5% |
81 Properties |
| 2017 | £398,806 | 5% |
81 Properties |
| 2016 | £380,301 | 7% |
90 Properties |
| 2015 | £354,979 | 1% |
125 Properties |
| 2014 | £350,258 | 5% |
170 Properties |
| 2013 | £333,263 | 2% |
130 Properties |
| 2012 | £327,819 | -38% |
96 Properties |
| 2011 | £451,600 | 38% |
30 Properties |
| 2010 | £278,700 | -1% |
41 Properties |
| 2009 | £280,971 | -24% |
37 Properties |
| 2008 | £349,433 | 17% |
30 Properties |
| 2007 | £290,945 | -21% |
51 Properties |
| 2006 | £353,268 | 25% |
62 Properties |
| 2005 | £266,606 | -3% |
56 Properties |
| 2004 | £274,091 | -9% |
63 Properties |
| 2003 | £298,725 | 22% |
48 Properties |
| 2002 | £232,292 | 0,4% |
70 Properties |
| 2001 | £231,387 | 38% |
56 Properties |
| 2000 | £143,204 | 11% |
54 Properties |
| 1999 | £127,526 | 5% |
69 Properties |
| 1998 | £120,758 | 11% |
73 Properties |
| 1997 | £107,547 | 10% |
74 Properties |
| 1996 | £97,006 | 1% |
93 Properties |
| 1995 | £96,295 | - |
78 Properties |
Property Price per Property Type in Romsey Extra
Here you can find historic sold price data in order to help with your property search.
The average Property Paid Price for specific property types in the last three years are:
| Property Type | Average Sold Price | Sold Properties |
|---|---|---|
| Semi Detached House | £388,499.00 | 36 Semi Detached Houses |
| Detached House | £749,240.00 | 58 Detached Houses |
| Terraced House | £307,806.00 | 49 Terraced Houses |
| Flat | £207,625.00 | 8 Flats |

