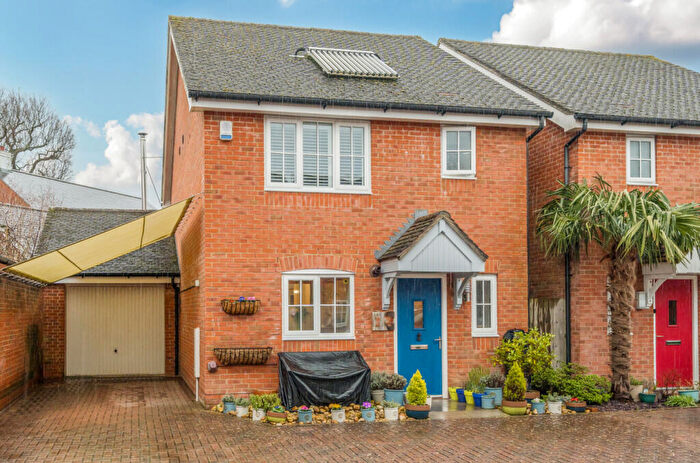
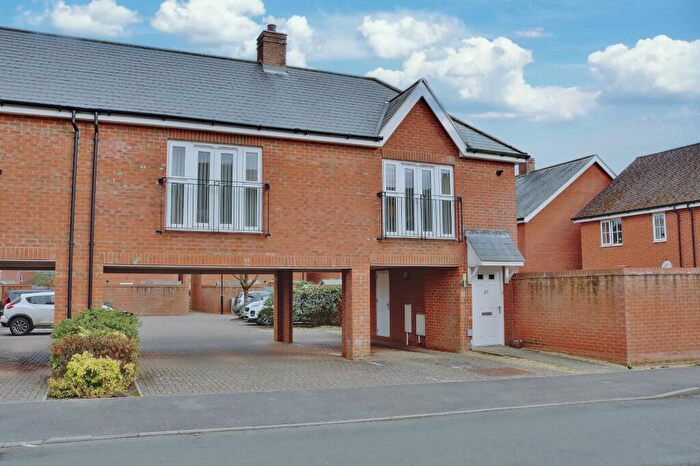
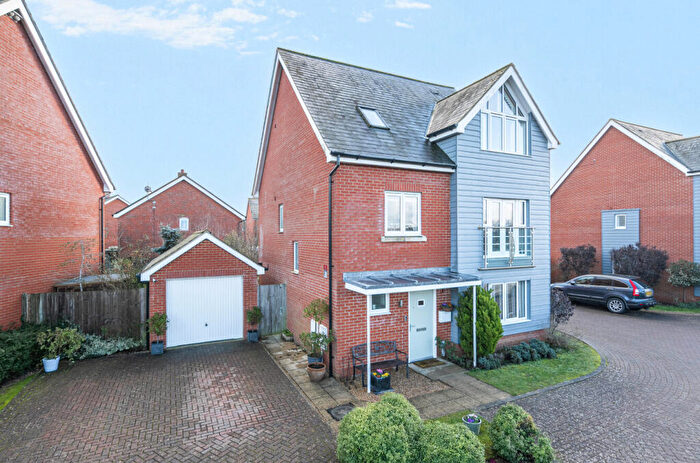
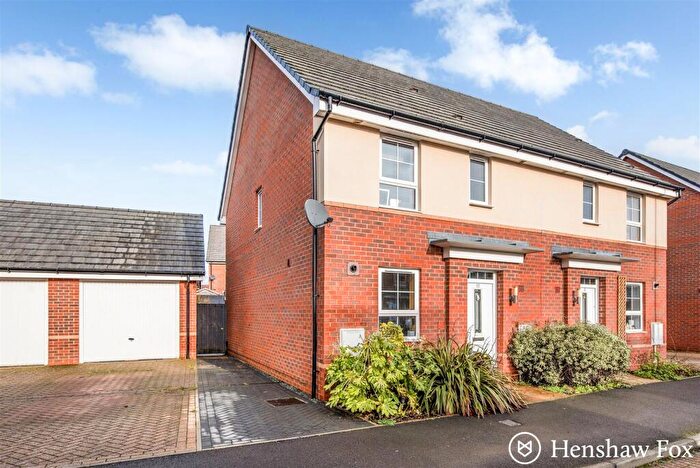
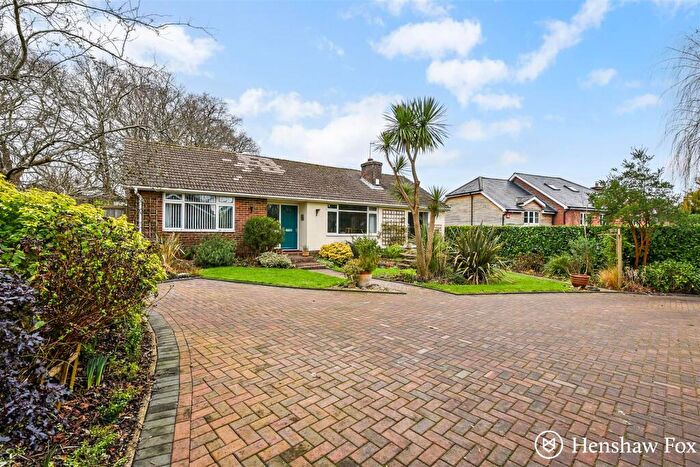
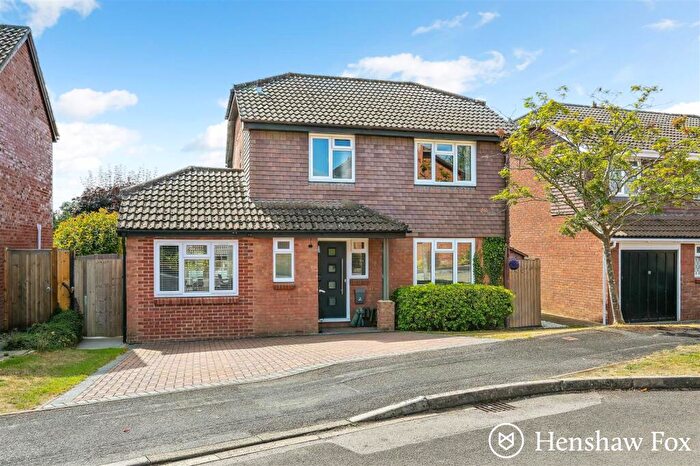
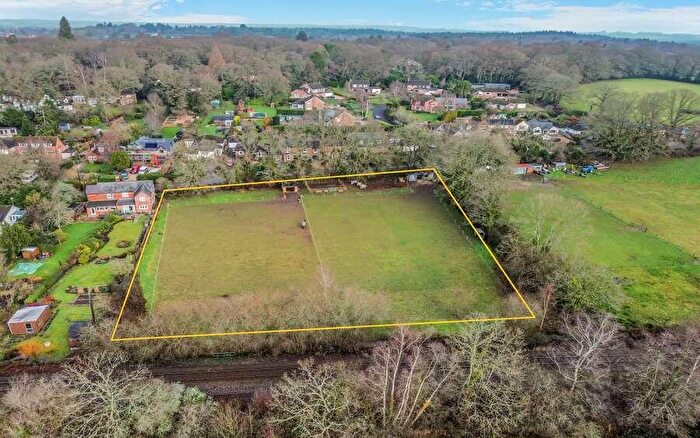
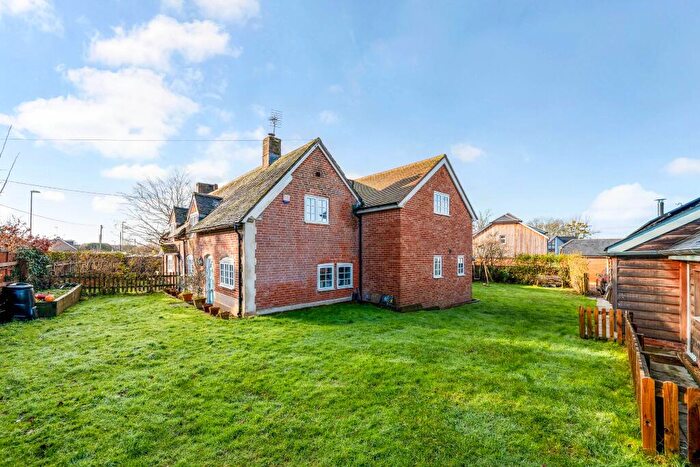
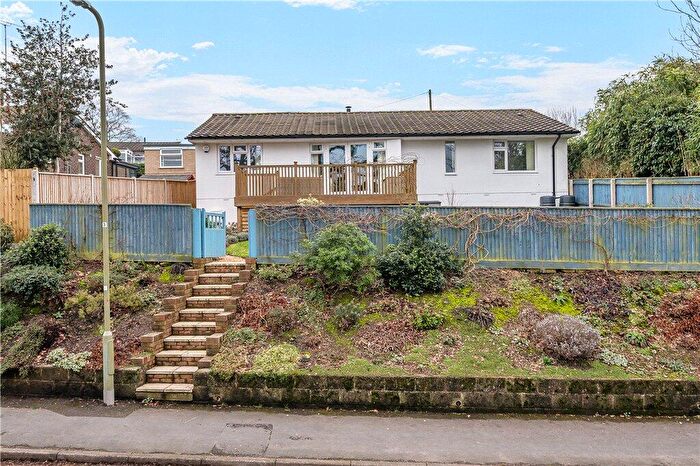
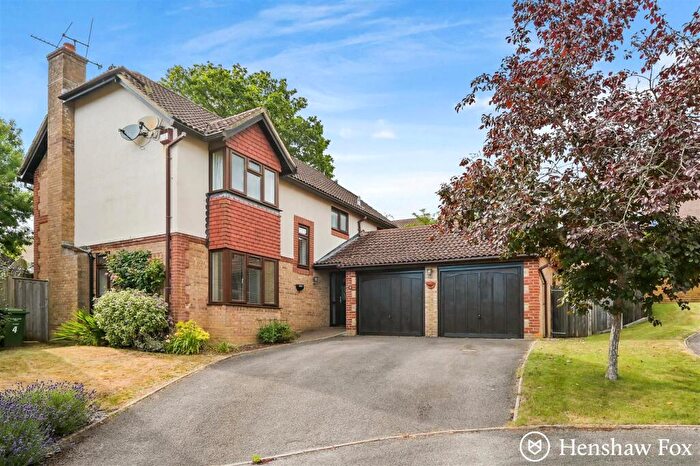
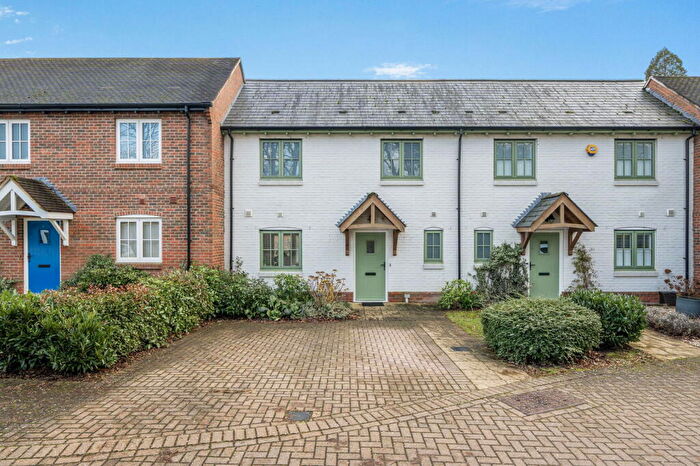
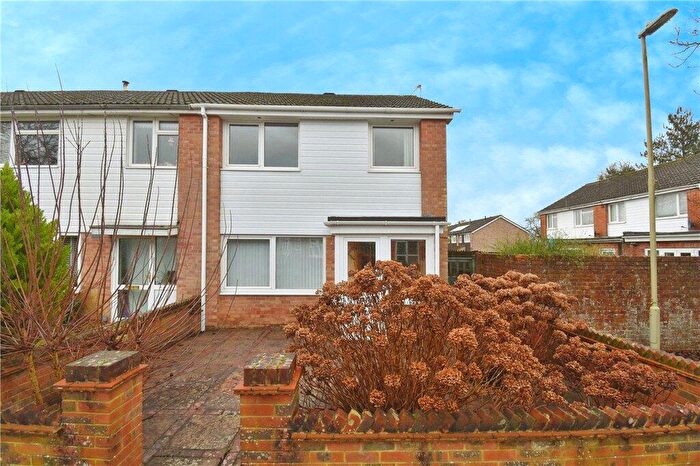
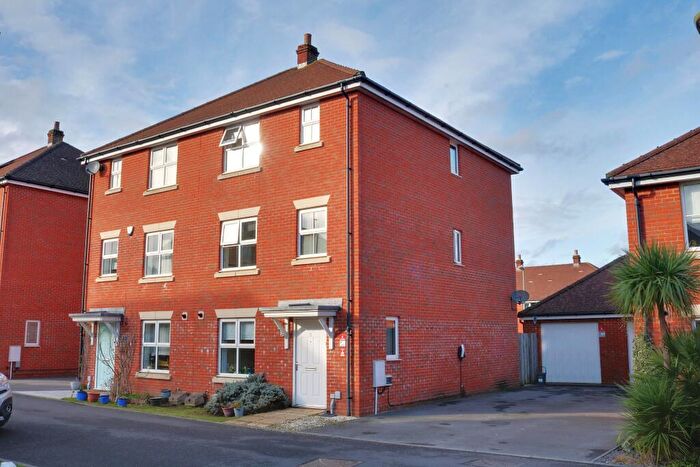
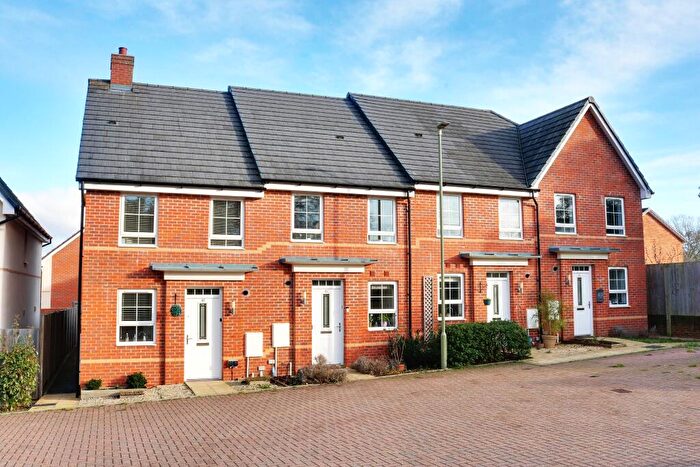
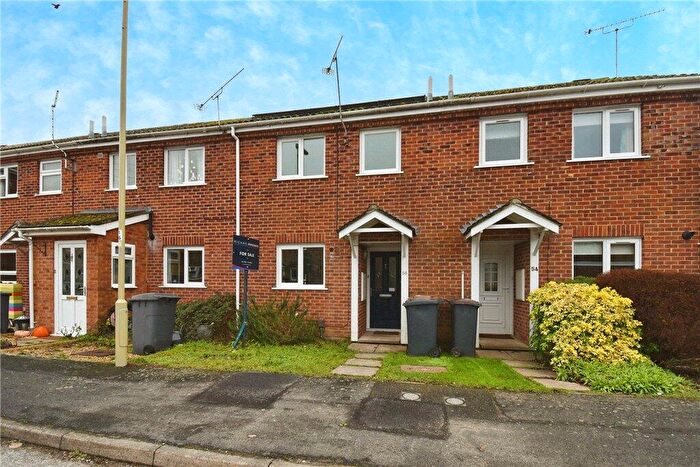
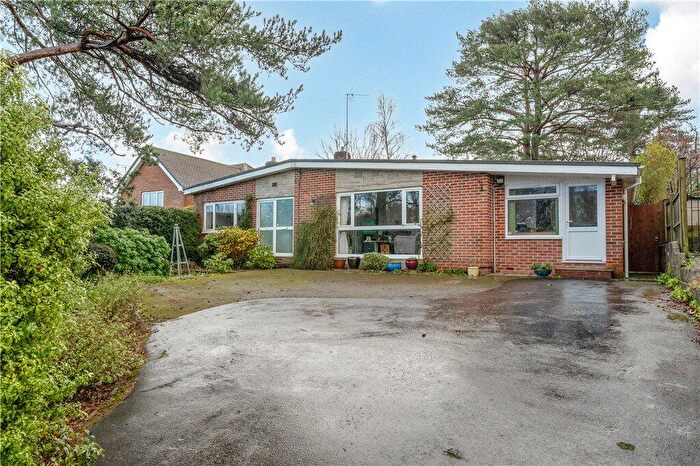
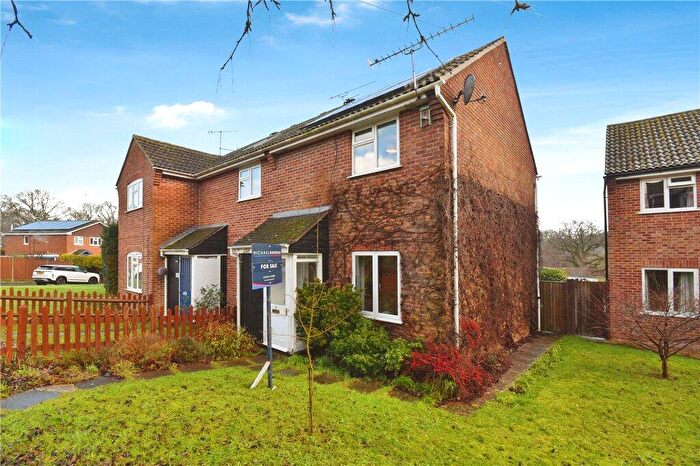
Houses for sale & to rent in Romsey Cupernham, Romsey
House Prices in Romsey Cupernham
Properties in Romsey Cupernham have an average house price of £447,096.00 and had 70 Property Transactions within the last 3 years¹.
Romsey Cupernham is an area in Romsey, Hampshire with 18 households², where the most expensive property was sold for £1,075,000.00.
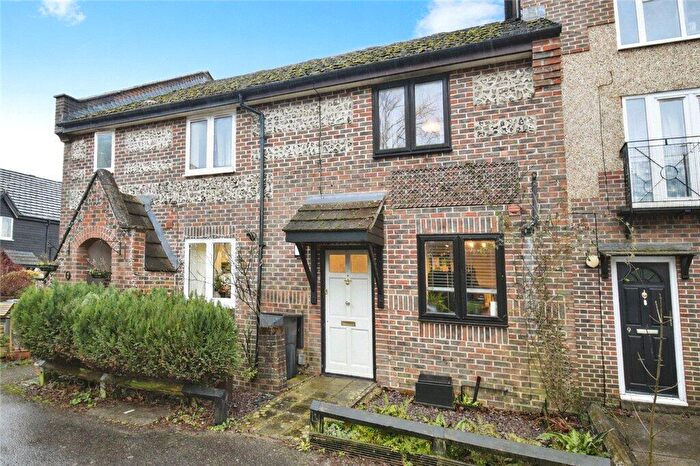
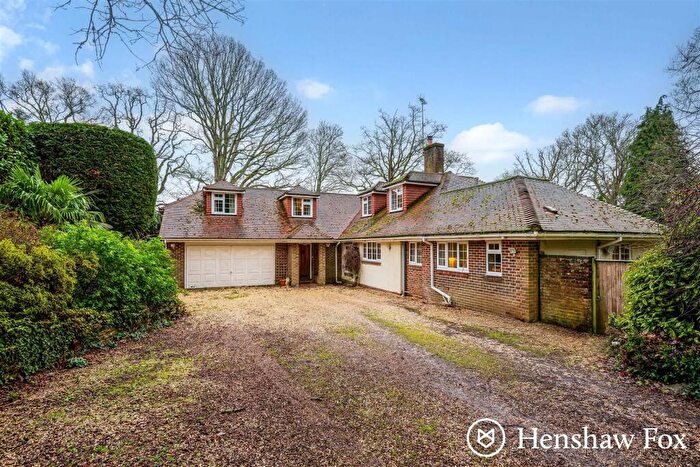
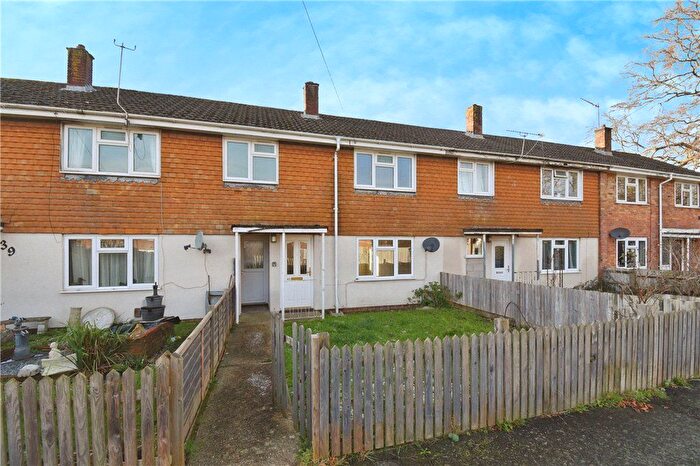
Properties for sale in Romsey Cupernham
Roads and Postcodes in Romsey Cupernham
Navigate through our locations to find the location of your next house in Romsey Cupernham, Romsey for sale or to rent.
| Streets | Postcodes |
|---|---|
| Abbotswood Common Road | SO51 0BX SO51 0DA SO51 0ER SO51 0ES |
| Baroona Close | SO51 7AE |
| Battenberg Close | SO51 7AG |
| Belbins Business Park | SO51 7AA SO51 7JF |
| Cutforth Way | SO51 0BN |
| Diment Crescent | SO51 0BP |
| Doris Bunting Road | SO51 0DH SO51 0DJ |
| Doswell Avenue | SO51 0DL |
| Dowling Crescent | SO51 0DN |
| Furze Drive | SO51 0BJ |
| Ganger Farm Lane | SO51 0PA |
| Ganger Farm Way | SO51 0DF SO51 0DG SO51 0EE |
| Greatbridge Road | SO51 0HP |
| Hodinott Close | SO51 0BB |
| Lawes Walk | SO51 0BU SO51 0BZ |
| Marshall Road | SO51 0DQ |
| Minchin Road | SO51 0BL SO51 0DD |
| Minstead Place | SO51 0DT |
| Osprey Place | SO51 7AL |
| Oxlease Meadows | SO51 7AB SO51 7AJ |
| Radcliffe Row | SO51 0DU |
| Scoreys Crescent | SO51 0DP |
| Silverwood Rise | SO51 7AD |
| Tate Close | SO51 0BE |
| Treviglio Close | SO51 7AF |
| Walnut Close | SO51 0EQ |
| Winchester Hill | SO51 7NW SO51 7UT SO51 7YD SO51 7YY SO51 7ZA |
| Woodley Lane | SO51 7PE |
| Wynford Industrial Park | SO51 0PW |
| SO51 0DB SO51 7PA |
Transport near Romsey Cupernham
- FAQ
- Price Paid By Year
- Property Type Price
Frequently asked questions about Romsey Cupernham
What is the average price for a property for sale in Romsey Cupernham?
The average price for a property for sale in Romsey Cupernham is £447,096. This amount is 4% lower than the average price in Romsey. There are 2,774 property listings for sale in Romsey Cupernham.
What streets have the most expensive properties for sale in Romsey Cupernham?
The streets with the most expensive properties for sale in Romsey Cupernham are Oxlease Meadows at an average of £889,000, Winchester Hill at an average of £740,000 and Hodinott Close at an average of £650,000.
What streets have the most affordable properties for sale in Romsey Cupernham?
The streets with the most affordable properties for sale in Romsey Cupernham are Diment Crescent at an average of £197,000, Radcliffe Row at an average of £245,000 and Abbotswood Common Road at an average of £335,000.
Which train stations are available in or near Romsey Cupernham?
Some of the train stations available in or near Romsey Cupernham are Romsey, Mottisfont and Dunbridge and Chandlers Ford.
Property Price Paid in Romsey Cupernham by Year
The average sold property price by year was:
| Year | Average Sold Price | Price Change |
Sold Properties
|
|---|---|---|---|
| 2025 | £467,771 | -1% |
23 Properties |
| 2024 | £473,303 | 19% |
28 Properties |
| 2023 | £383,447 | -38% |
19 Properties |
| 2022 | £527,600 | 13% |
25 Properties |
| 2021 | £457,136 | 5% |
65 Properties |
| 2020 | £435,403 | -16% |
78 Properties |
| 2019 | £504,555 | 9% |
129 Properties |
| 2018 | £457,794 | 30% |
109 Properties |
| 2017 | £319,163 | - |
45 Properties |
| 2016 | £319,134 | -6% |
71 Properties |
| 2015 | £336,791 | 5% |
49 Properties |
| 2014 | £319,000 | - |
12 Properties |
Property Price per Property Type in Romsey Cupernham
Here you can find historic sold price data in order to help with your property search.
The average Property Paid Price for specific property types in the last three years are:
| Property Type | Average Sold Price | Sold Properties |
|---|---|---|
| Semi Detached House | £377,828.00 | 16 Semi Detached Houses |
| Terraced House | £359,500.00 | 27 Terraced Houses |
| Flat | £213,000.00 | 3 Flats |
| Detached House | £621,083.00 | 24 Detached Houses |

