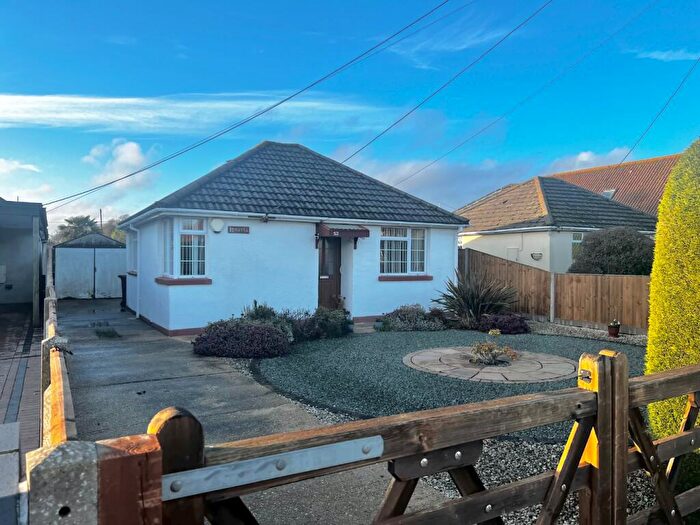
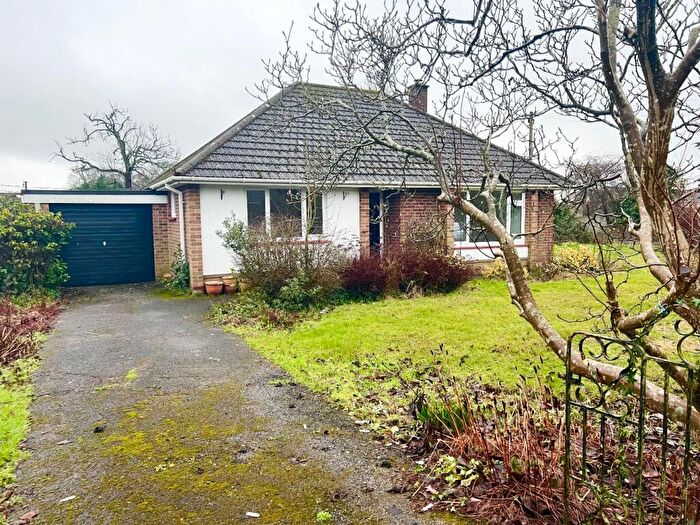
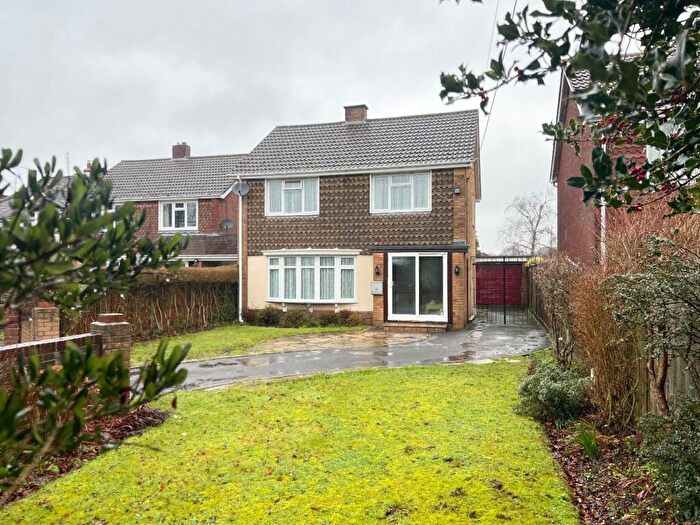
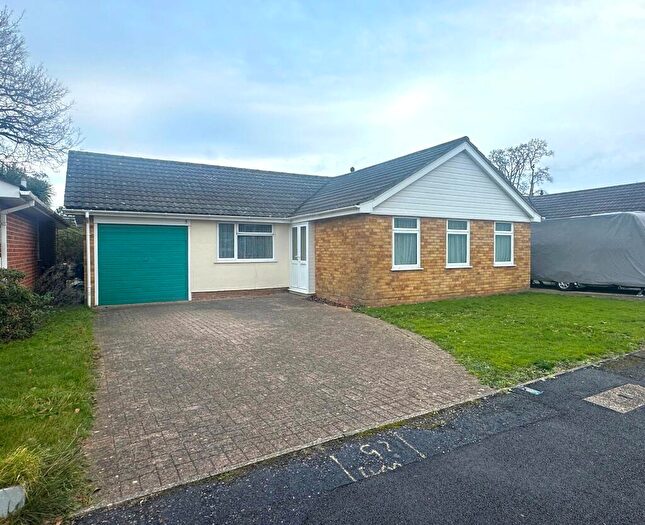
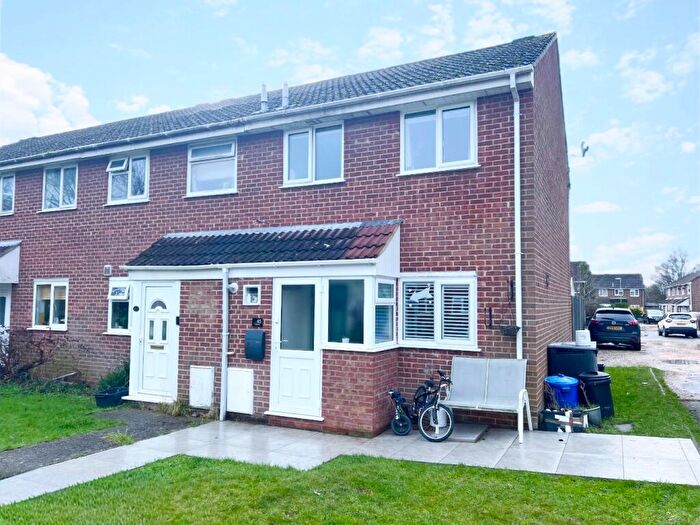
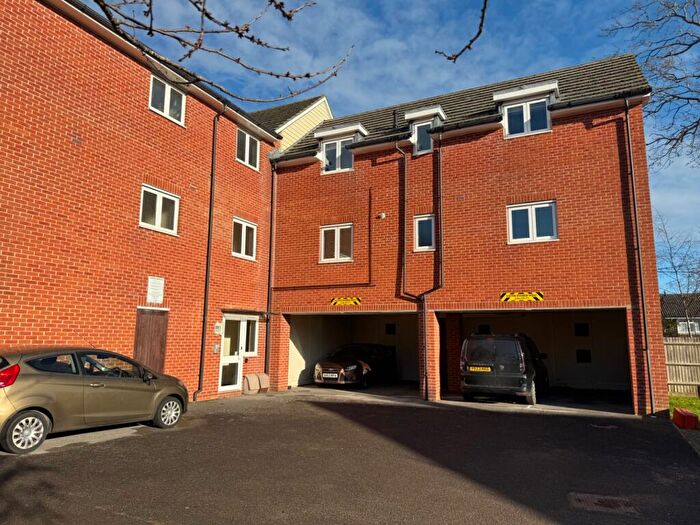
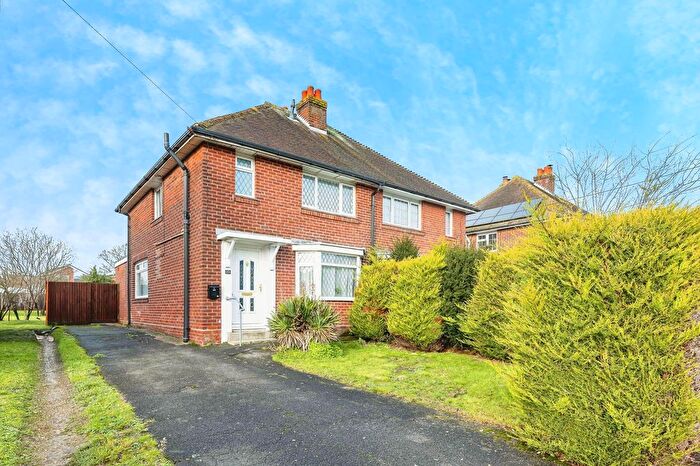
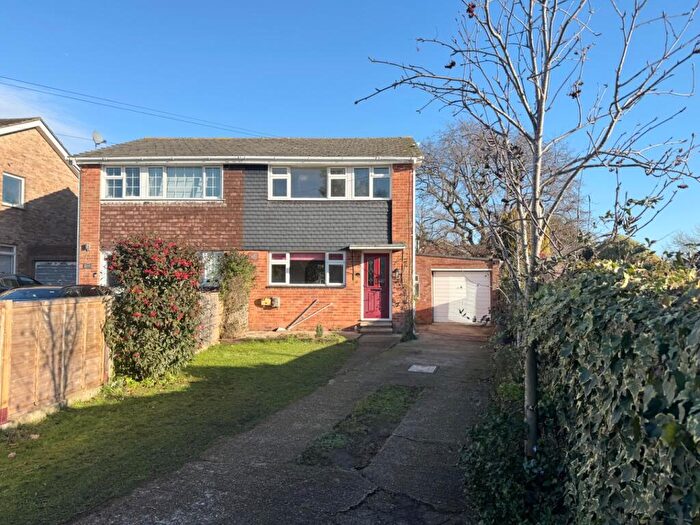
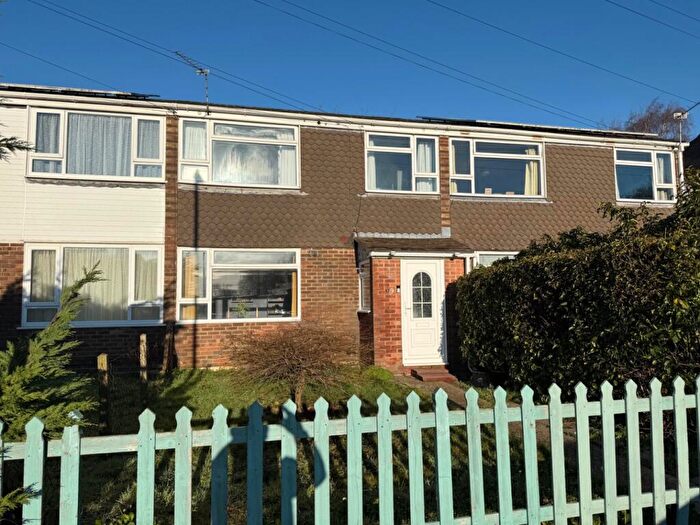
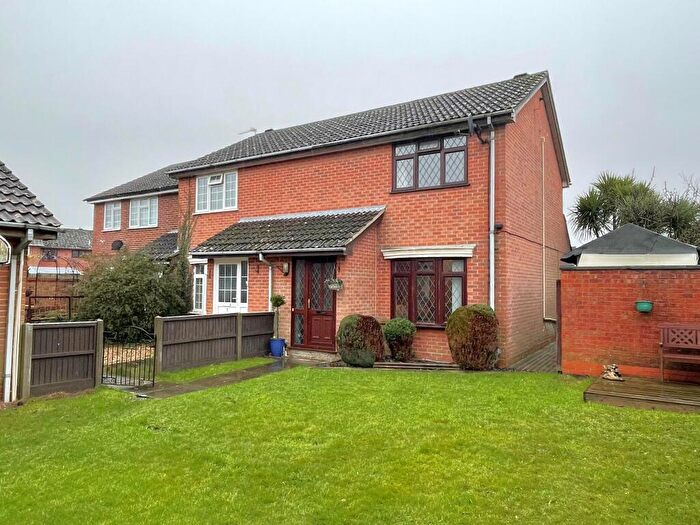
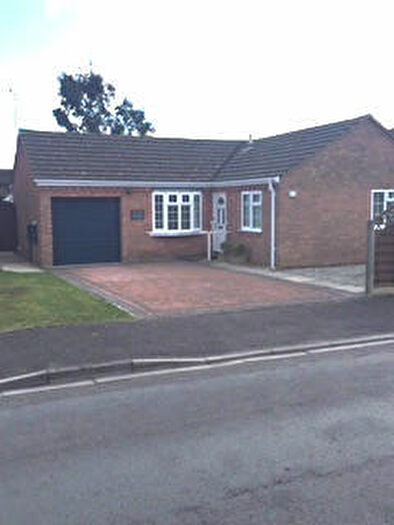
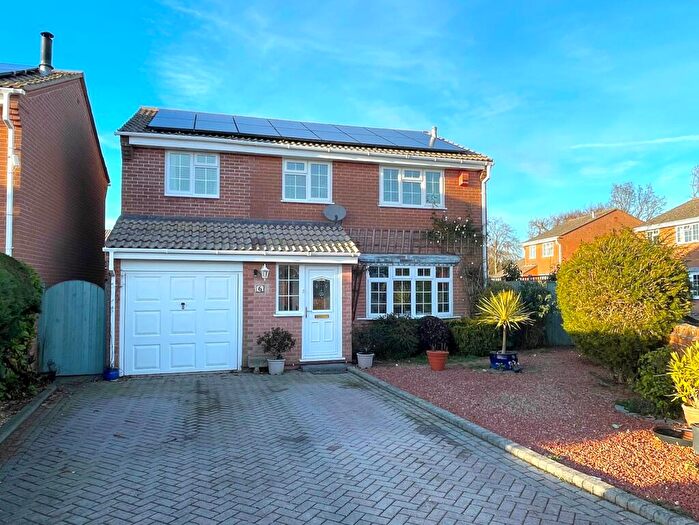
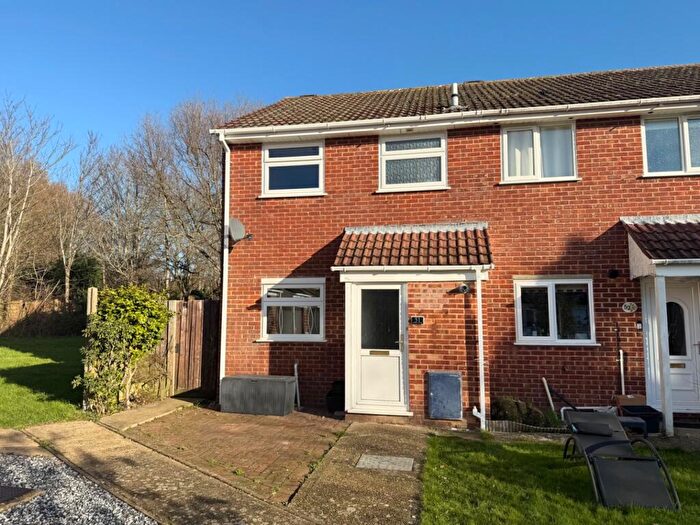
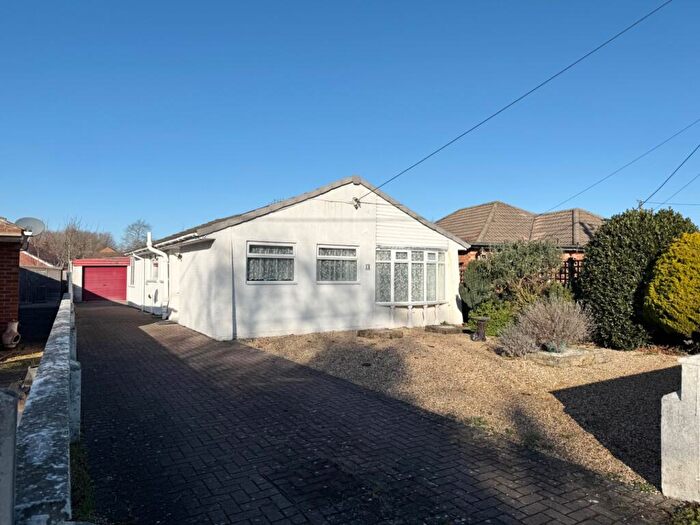
Houses for sale & to rent in Fawley, Blackfield And Langley, Southampton
House Prices in Fawley, Blackfield And Langley
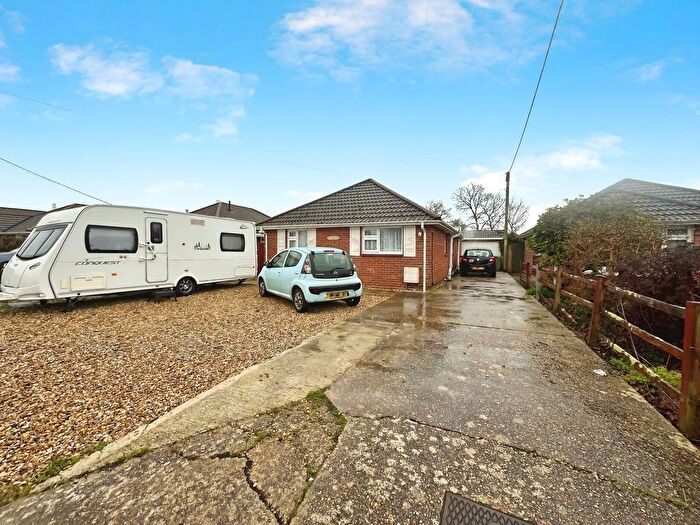
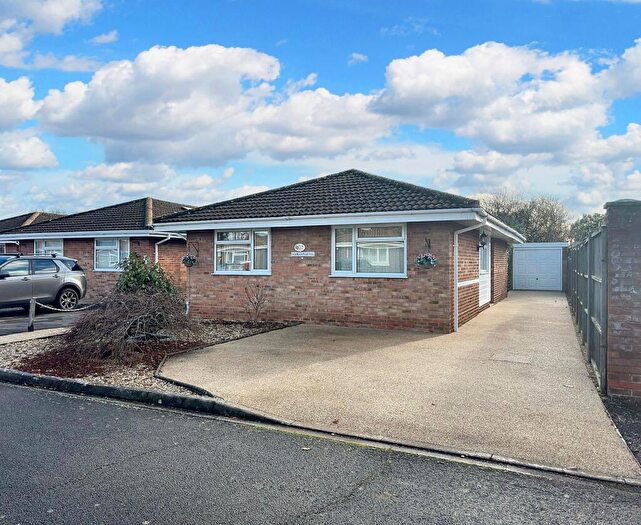
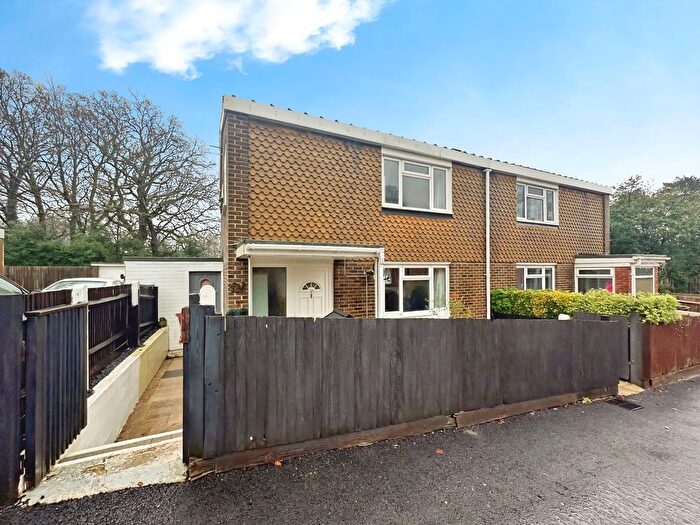
Properties in Fawley, Blackfield And Langley have an average house price of £368,123.00 and had 283 Property Transactions within the last 3 years¹.
Fawley, Blackfield And Langley is an area in Southampton, Hampshire with 2,586 households², where the most expensive property was sold for £850,000.00.
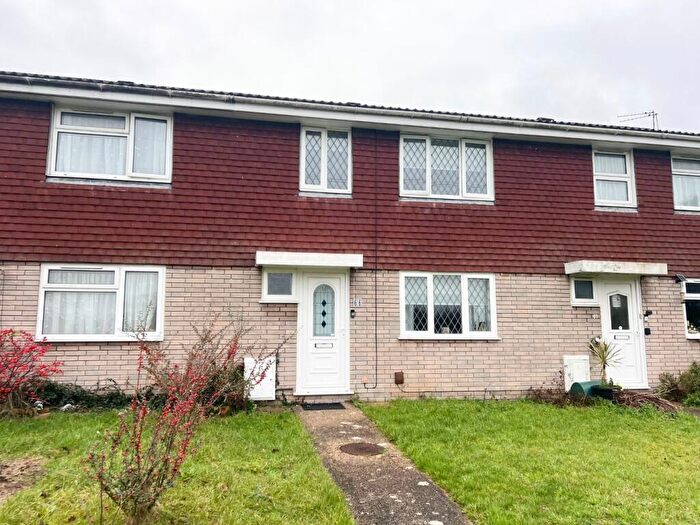
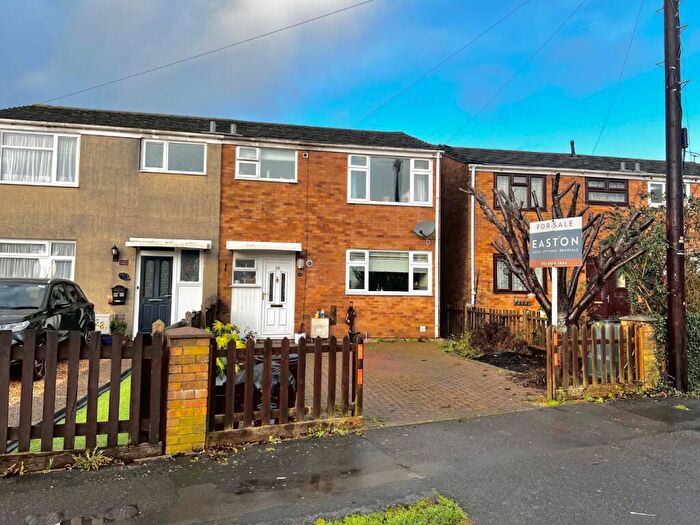
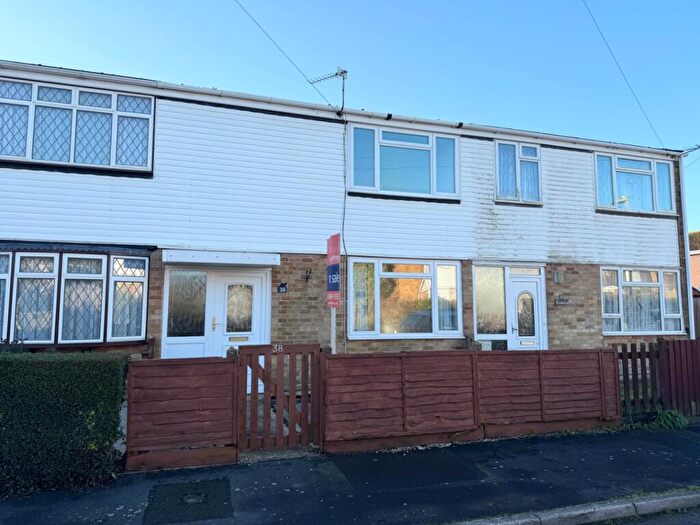
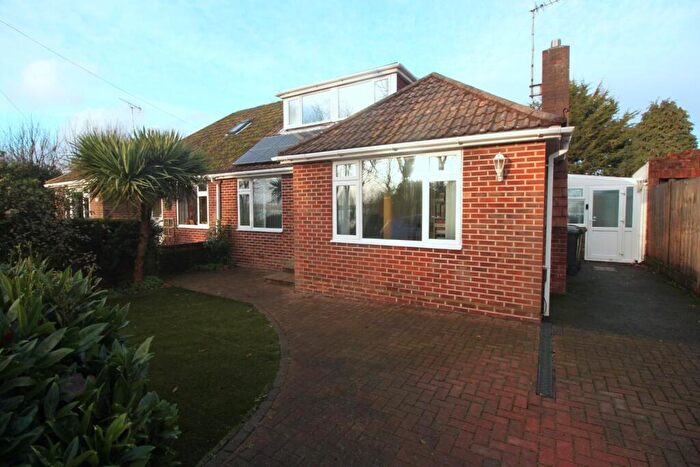
Properties for sale in Fawley, Blackfield And Langley
Roads and Postcodes in Fawley, Blackfield And Langley
Navigate through our locations to find the location of your next house in Fawley, Blackfield And Langley, Southampton for sale or to rent.
| Streets | Postcodes |
|---|---|
| Admirals Close | SO45 1FQ |
| April Gardens | SO45 1ET |
| Ashdown | SO45 2RB |
| Ashdown Road | SO45 1EF |
| Ashlett Close | SO45 1DR |
| Ashlett Creek | SO45 1DT |
| Ashlett Mews | SO45 1FW |
| Ashlett Road | SO45 1DS |
| Badminston Drove | SO45 1BW |
| Bell Lane | SO45 1RY |
| Bernwood Grove | SO45 1ZW |
| Blackfield Road | SO45 1ED SO45 1EG SO45 1WD |
| Bowland Way | SO45 1ZR |
| Bus Drove | SO45 1BG |
| Cadland Road | SO45 3NY SO45 3YY |
| Calshot Beach | SO45 1BS |
| Calshot Close | SO45 1BP |
| Calshot Road | SO45 1BL SO45 1BR SO45 1DW SO45 1BB SO45 1BE |
| Castle Lane | SO45 1BY |
| Cedric Close | SO45 1ZZ |
| Chalewood Road | SO45 1YU |
| Chapel Lane | SO45 1YX SO45 1YY SO45 1YZ |
| Charleston Road | SO45 3BP SO45 3NX |
| Charnwood Way | SO45 1ZL |
| Church Lane | SO45 1DH SO45 1DL |
| Churchfields | SO45 1FY |
| Clare Gardens | SO45 1XZ |
| Coleville Avenue | SO45 1DA |
| Copthorne Lane | SO45 1DP |
| Dane Close | SO45 1ZY |
| Dark Lane | SO45 1WB |
| Denny Close | SO45 1BZ SO45 1FR |
| Edward Close | SO45 1WT |
| Elmfield Lane | SO45 1BJ |
| Exbury Road | SO45 1XE |
| Falcon Fields | SO45 1DE |
| Fawley Road | SO45 2NB SO45 1FJ |
| Fields Close | SO45 1XT |
| Forest Edge | SO45 1FN |
| Forest Gate | SO45 1GW |
| Foresters Gate | SO45 1SP SO45 1SN |
| Forge Road | SO45 1XS |
| Foxglade | SO45 1SE |
| Foxhayes Lane | SO45 1XX |
| Foxlands | SO45 1SB |
| Foxs Walk | SO45 1SD |
| Foxy Paddock | SO45 1SA |
| Green Lane | SO45 1YG |
| Hampton Close | SO45 1WQ |
| Hampton Gardens | SO45 1WP |
| Hampton Lane | SO45 1UB SO45 1WE SO45 1WF SO45 1WL SO45 1WN SO45 1XA SO45 1ZA |
| Hardley | SO45 3NR SO45 3ZG |
| Hartsgrove Avenue | SO45 1WG |
| Hartsgrove Close | SO45 1WW |
| Holly Road | SO45 1WS |
| Hughes Close | SO45 1UZ |
| Hursley Drive | SO45 1ZU |
| Janes Close | SO45 1WJ |
| Kings Copse Road | SO45 1XF |
| Kings Ride | SO45 1ZN |
| Langley Lodge Gardens | SO45 1FZ |
| Lea Road | SO45 1YW |
| Lepe Road | SO45 1SS SO45 1XR SO45 1YT SO45 1HA |
| Linda Road | SO45 1DJ |
| Marsh Lane | SO45 1HB SO45 1TX |
| Meadow Way | SO45 1FP |
| Monks Row | SO45 1XD |
| Mopley | SO45 1YJ SO45 1YR SO45 1YH |
| Mopley Close | SO45 1YL |
| Mulberry Close | SO45 1FH |
| New Forest Park | SO45 1XN |
| New Road | SO45 1WA |
| Newlands Close | SO45 1WH |
| Newlands Copse | SO45 1YB SO45 1YD |
| Nicholas Road | SO45 1YS |
| Norman Road | SO45 1YF |
| Northampton Lane | SO45 1WR |
| Orchard Close | SO45 1EZ |
| Ower Lane | SO45 1BD |
| Page Close | SO45 2GA |
| Pavilion Gardens | SO45 1FE |
| Pentagon Cottages | SO45 1EB |
| Rhyme Hall Mews | SO45 1FX |
| Rollestone Road | SO45 2GD SO45 2HB |
| Rosemerry Place | SO45 1FG |
| Saxon Road | SO45 1WY |
| School Road | SO45 1EA |
| Selwood Place | SO45 1FA |
| Sherringham Close | SO45 1SQ |
| Sherwood Way | SO45 1ZQ |
| Solent View | SO45 1BH |
| Spratts Down | SO45 1BU |
| St Francis Close | SO45 1XQ |
| St Francis Road | SO45 1XU |
| St Georges Court | SO45 1FD |
| St Michaels Close | SO45 1AP |
| Stag Gates | SO45 1SR |
| Stanswood Road | SO45 1AA SO45 1BT SO45 1AB |
| Stonehills | SO45 1DU |
| The Driveway | SO45 1RS |
| The Drove | SO45 1XB |
| The Glade | SO45 1ZP |
| The Lane | SO45 1DX SO45 1EY |
| The Mews | SO45 1XY |
| The Paddocks | SO45 1FL |
| The Pentagon | SO45 1EE |
| The Square | SO45 1DD SO45 1DF |
| Thornbury Avenue | SO45 1YP SO45 1YQ |
| Tristan Close | SO45 1BN |
| Viking Close | SO45 1ZX |
| Walkers Lane North | SO45 1YA SO45 1YE |
| Walkers Lane South | SO45 1YN |
| Wessex Close | SO45 1WZ |
| West Common | SO45 1XJ SO45 1XL SO45 1XP |
| Wheelers Walk | SO45 1WX |
| Whites Lane | SO45 1DG |
| Woodland Gardens | SO45 1GD |
| Woodville Road | SO45 1DB |
| Wychwood Drive | SO45 1ZT |
| SO45 1BX SO45 1TW |
Transport near Fawley, Blackfield And Langley
-
Hamble Station
-
Netley Station
-
Bursledon Station
-
Sholing Station
-
Woolston Station
-
Swanwick Station
-
Southampton Central Station
-
Beaulieu Road Station
-
Bitterne Station
-
Millbrook (Hampshire) Station
- FAQ
- Price Paid By Year
- Property Type Price
Frequently asked questions about Fawley, Blackfield And Langley
What is the average price for a property for sale in Fawley, Blackfield And Langley?
The average price for a property for sale in Fawley, Blackfield And Langley is £368,123. This amount is 6% lower than the average price in Southampton. There are 1,543 property listings for sale in Fawley, Blackfield And Langley.
What streets have the most expensive properties for sale in Fawley, Blackfield And Langley?
The streets with the most expensive properties for sale in Fawley, Blackfield And Langley are Kings Copse Road at an average of £670,000, West Common at an average of £640,000 and Pentagon Cottages at an average of £545,000.
What streets have the most affordable properties for sale in Fawley, Blackfield And Langley?
The streets with the most affordable properties for sale in Fawley, Blackfield And Langley are Pavilion Gardens at an average of £140,500, Tristan Close at an average of £218,050 and Forest Edge at an average of £242,550.
Which train stations are available in or near Fawley, Blackfield And Langley?
Some of the train stations available in or near Fawley, Blackfield And Langley are Hamble, Netley and Bursledon.
Property Price Paid in Fawley, Blackfield And Langley by Year
The average sold property price by year was:
| Year | Average Sold Price | Price Change |
Sold Properties
|
|---|---|---|---|
| 2025 | £370,321 | 2% |
60 Properties |
| 2024 | £362,259 | -8% |
77 Properties |
| 2023 | £390,969 | 9% |
56 Properties |
| 2022 | £357,460 | 1% |
90 Properties |
| 2021 | £354,510 | 4% |
121 Properties |
| 2020 | £338,768 | 6% |
79 Properties |
| 2019 | £319,776 | 2% |
111 Properties |
| 2018 | £313,939 | 4% |
69 Properties |
| 2017 | £300,840 | 5% |
107 Properties |
| 2016 | £286,181 | 5% |
90 Properties |
| 2015 | £271,431 | 11% |
107 Properties |
| 2014 | £242,841 | 2% |
105 Properties |
| 2013 | £238,123 | 1% |
81 Properties |
| 2012 | £235,615 | 1% |
71 Properties |
| 2011 | £232,593 | -4% |
66 Properties |
| 2010 | £243,037 | 14% |
66 Properties |
| 2009 | £210,169 | -3% |
64 Properties |
| 2008 | £216,166 | -5% |
81 Properties |
| 2007 | £227,397 | 11% |
108 Properties |
| 2006 | £202,525 | -4% |
114 Properties |
| 2005 | £211,562 | -1% |
83 Properties |
| 2004 | £213,619 | 12% |
109 Properties |
| 2003 | £187,260 | 20% |
100 Properties |
| 2002 | £149,789 | 11% |
115 Properties |
| 2001 | £133,508 | 6% |
111 Properties |
| 2000 | £125,874 | 23% |
109 Properties |
| 1999 | £96,502 | 4% |
152 Properties |
| 1998 | £92,348 | 11% |
132 Properties |
| 1997 | £82,563 | 11% |
121 Properties |
| 1996 | £73,763 | 8% |
103 Properties |
| 1995 | £67,752 | - |
87 Properties |
Property Price per Property Type in Fawley, Blackfield And Langley
Here you can find historic sold price data in order to help with your property search.
The average Property Paid Price for specific property types in the last three years are:
| Property Type | Average Sold Price | Sold Properties |
|---|---|---|
| Semi Detached House | £325,043.00 | 56 Semi Detached Houses |
| Detached House | £417,120.00 | 178 Detached Houses |
| Terraced House | £269,252.00 | 35 Terraced Houses |
| Flat | £164,666.00 | 14 Flats |

