
Houses for sale & to rent in SO45 1SD, Foxs Walk, Fawley, Blackfield And Langley, Southampton
House Prices in SO45 1SD, Foxs Walk, Fawley, Blackfield And Langley
Properties in SO45 1SD have an average house price of £335,000.00 and had 1 Property Transaction within the last 3 years.¹ SO45 1SD is a postcode in Foxs Walk located in Fawley, Blackfield And Langley, an area in Southampton, Hampshire, with 3 households², where the most expensive property was sold for £335,000.00.
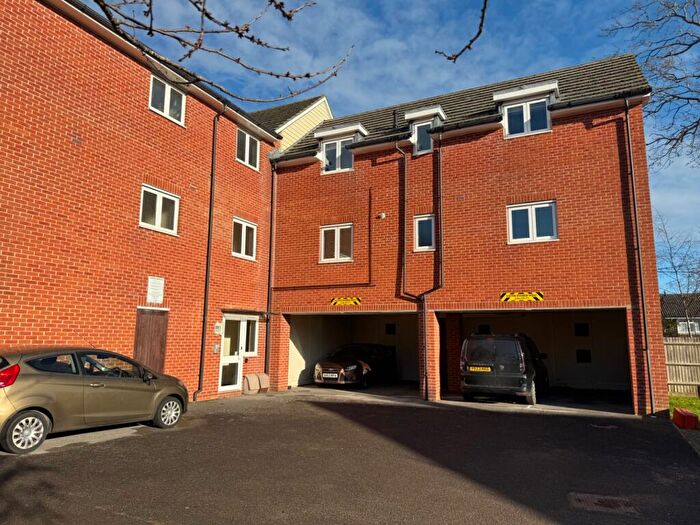
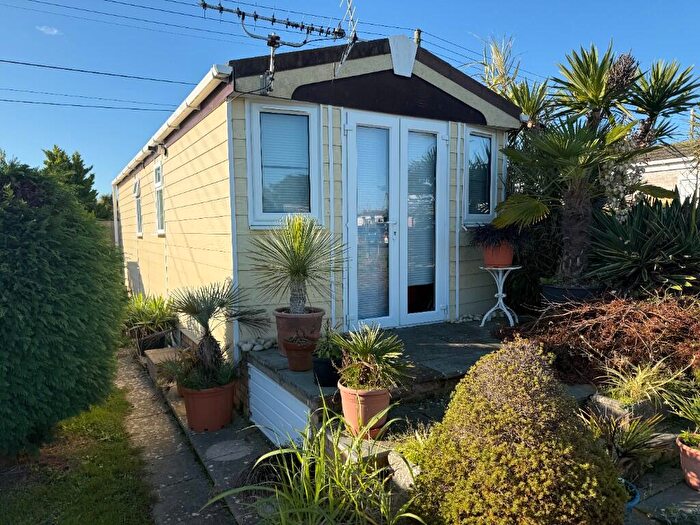
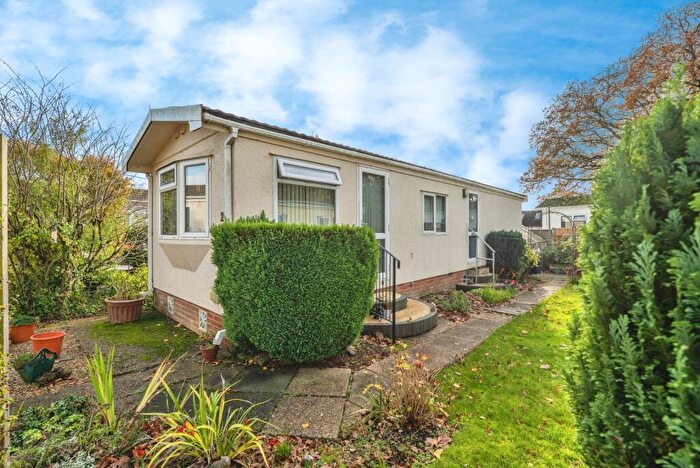
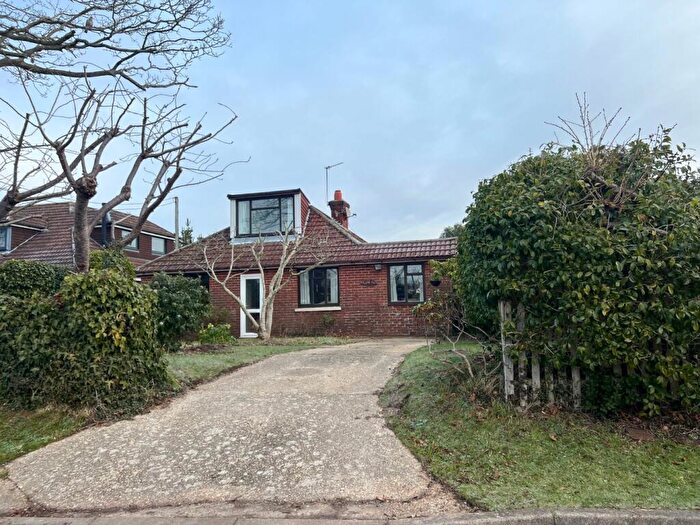
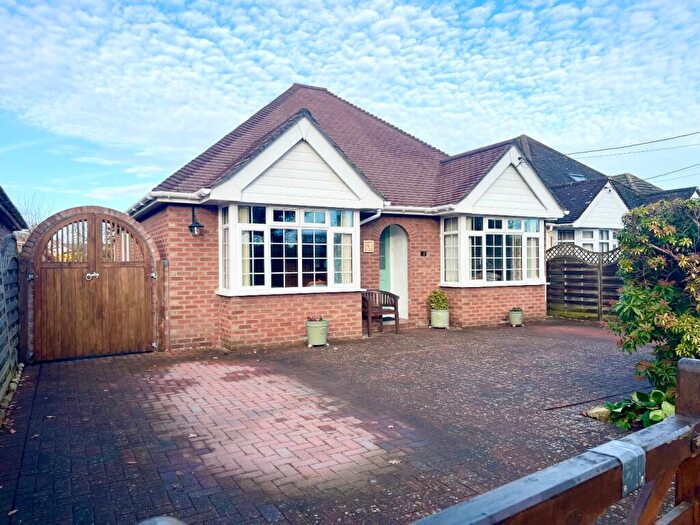
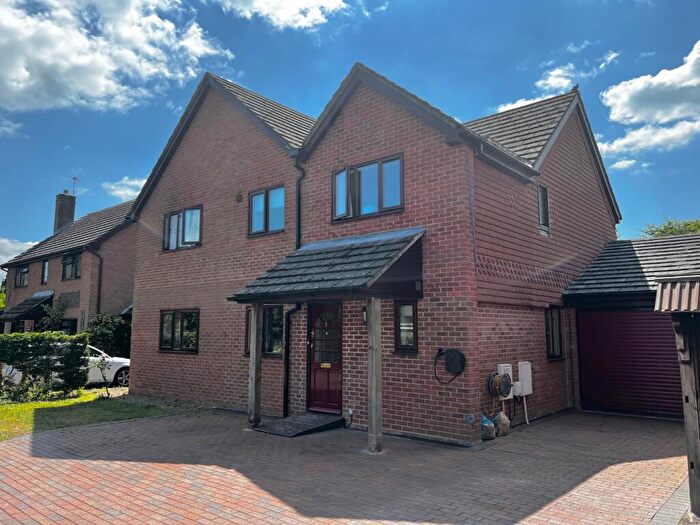
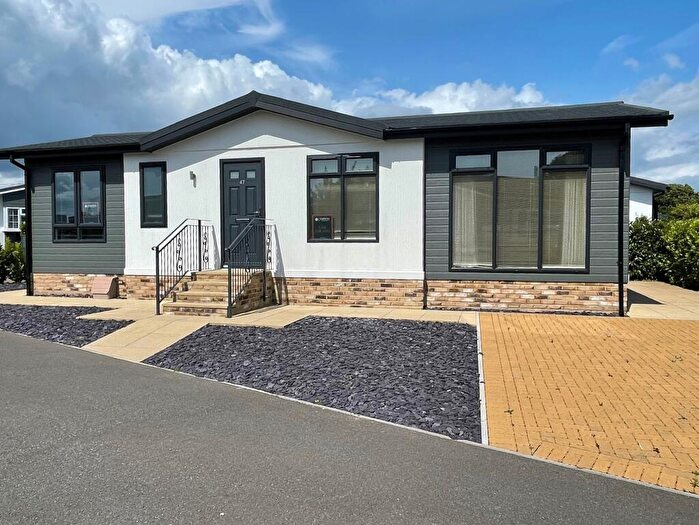
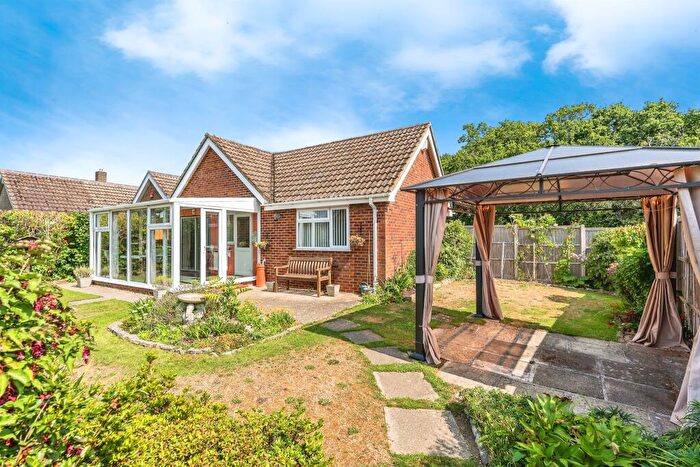
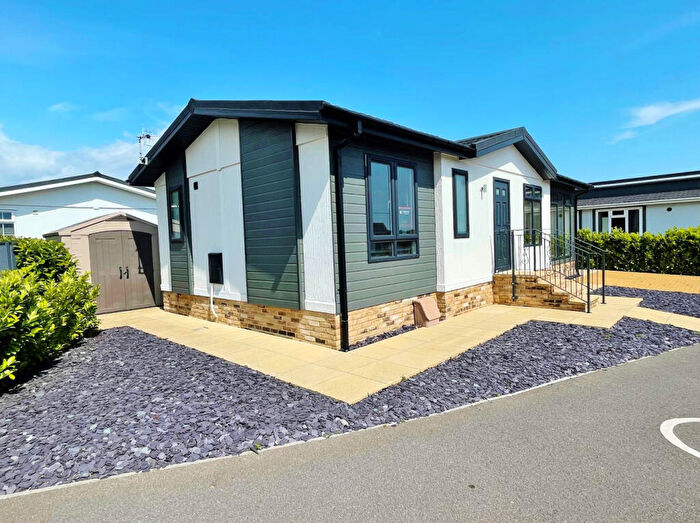
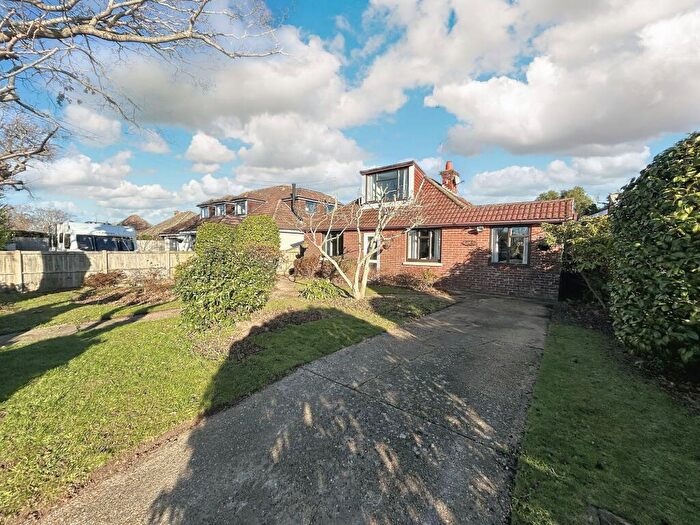
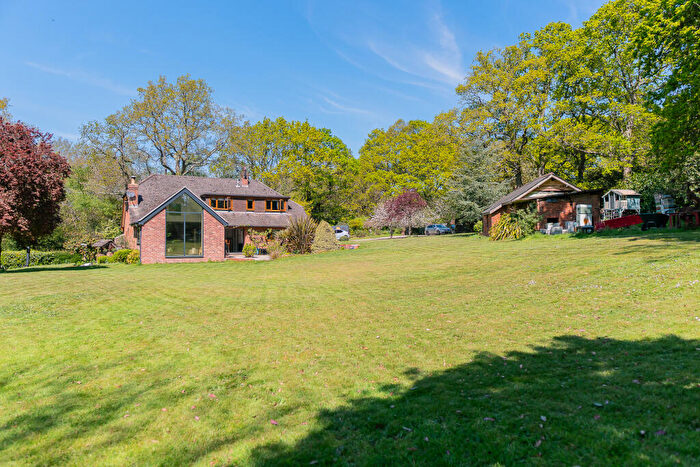
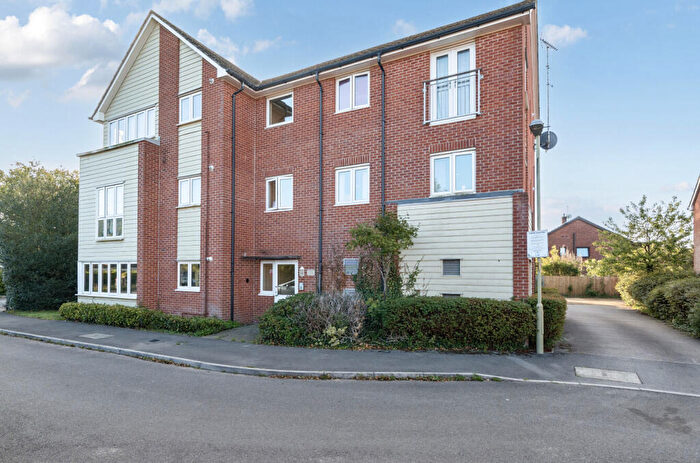
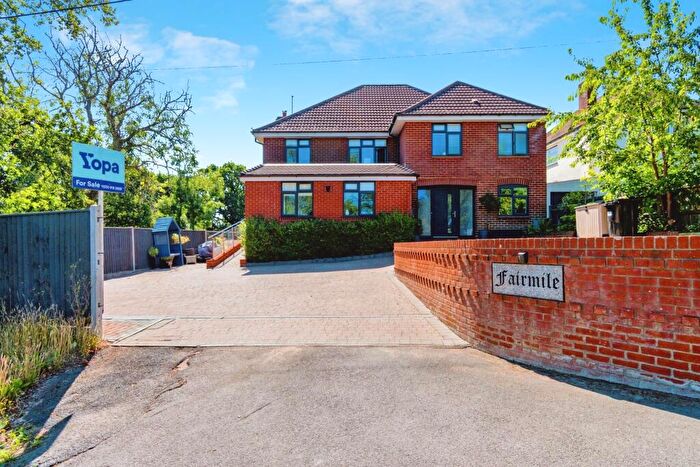
Properties for sale near SO45 1SD, Foxs Walk
![]()
If you are looking to sell your house, let it out, or receive a property valuation, an expert can help you.
Click the button below to get started.


Price Paid in Foxs Walk, SO45 1SD, Fawley, Blackfield And Langley
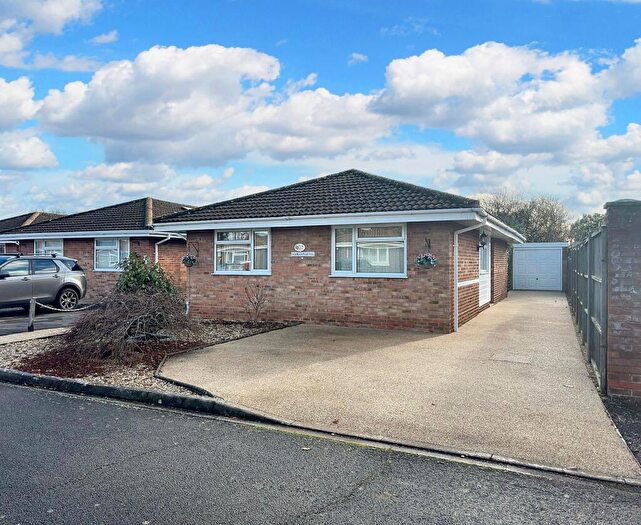
3 Foxs Walk, SO45 1SD, Fawley, Blackfield And Langley Southampton
Property 3 has been sold 2 times. The last time it was sold was in 24/09/2024 and the sold price was £335,000.00.
This detached house, sold as a freehold on 24/09/2024, is a 73 sqm detached bungalow with an EPC rating of C.
| Date | Price | Property Type | Tenure | Classification |
|---|---|---|---|---|
| 24/09/2024 | £335,000.00 | Detached House | freehold | Established Building |
| 02/04/2009 | £207,500.00 | Detached House | freehold | Established Building |
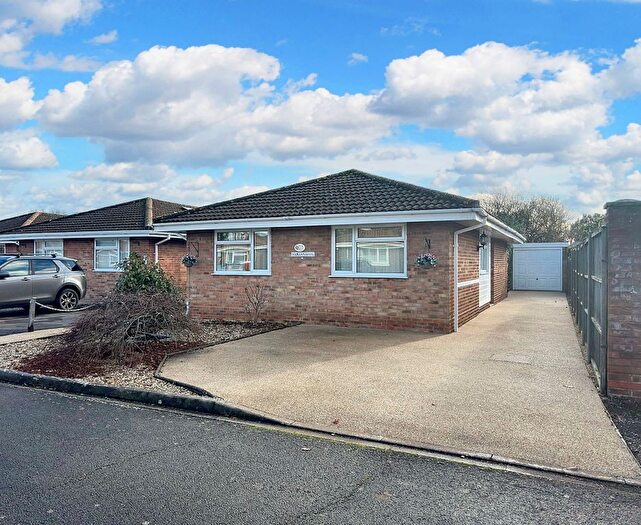
2 Foxs Walk, SO45 1SD, Fawley, Blackfield And Langley Southampton
Property 2 has been sold 2 times. The last time it was sold was in 23/08/2012 and the sold price was £245,000.00.
This detached house, sold as a freehold on 23/08/2012, is a 59 sqm detached bungalow with an EPC rating of D.
| Date | Price | Property Type | Tenure | Classification |
|---|---|---|---|---|
| 23/08/2012 | £245,000.00 | Detached House | freehold | Established Building |
| 21/10/2004 | £234,500.00 | Detached House | freehold | Established Building |
Transport near SO45 1SD, Foxs Walk
-
 Hamble Station
 -
Netley Station
-
Bursledon Station
-
Sholing Station
-
Woolston Station
-
Swanwick Station
-
Beaulieu Road Station
-
Southampton Central Station
-
Bitterne Station
-
Millbrook (Hampshire) Station
House price paid reports for SO45 1SD, Foxs Walk
Click on the buttons below to see price paid reports by year or property price:
- Price Paid By Year
- Property Type Price
Property Price Paid in SO45 1SD, Foxs Walk by Year
The average sold property price by year was:
| Year | Average Sold Price | Price Change |
Sold Properties
|
|---|---|---|---|
| 2024 | £335,000 | 27% |
1 Property |
| 2012 | £245,000 | 15% |
1 Property |
| 2009 | £207,500 | -13% |
1 Property |
| 2004 | £234,500 | - |
1 Property |
Property Price per Property Type in SO45 1SD, Foxs Walk
Here you can find historic sold price data in order to help with your property search.
The average Property Paid Price for specific property types in the last three years are:
| Property Type | Average Sold Price | Sold Properties |
|---|---|---|
| Detached House | £335,000.00 | 1 Detached House |