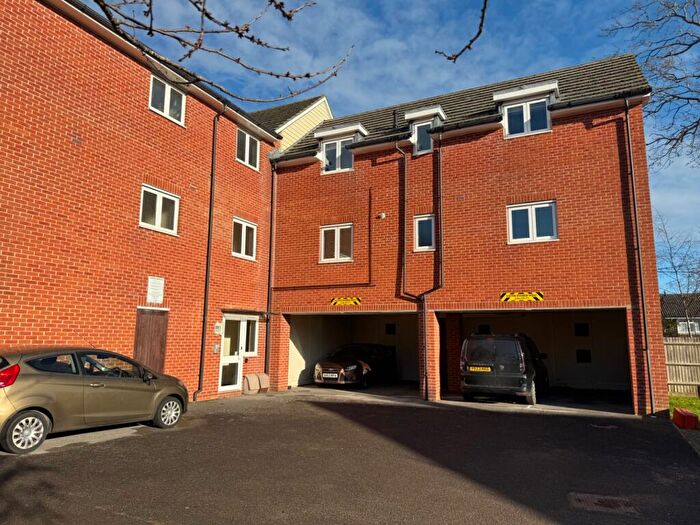
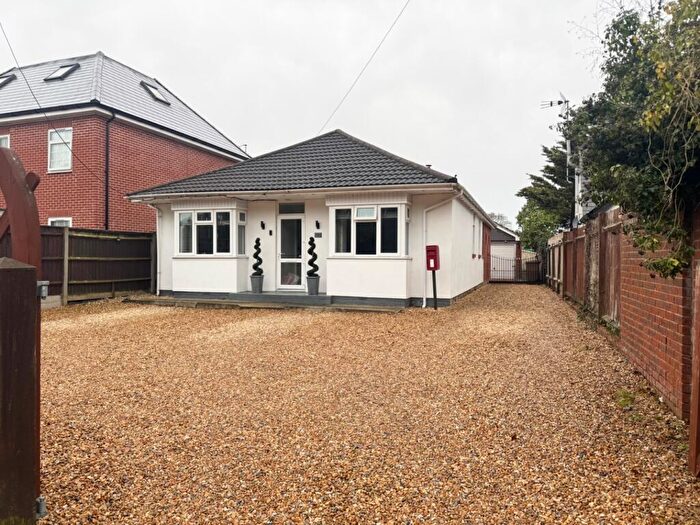
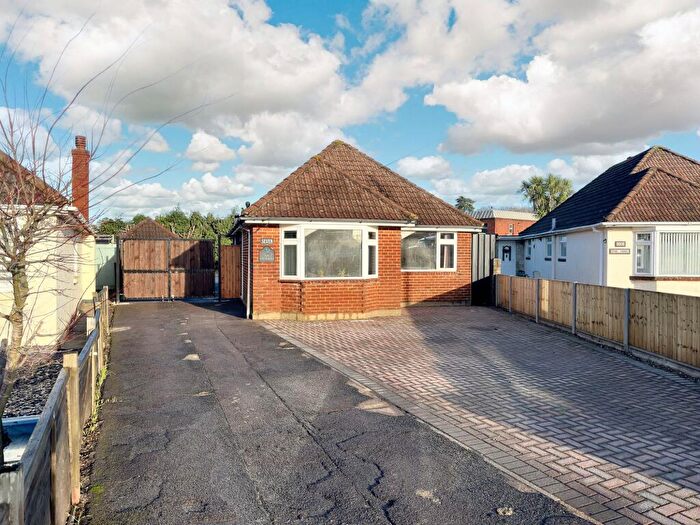
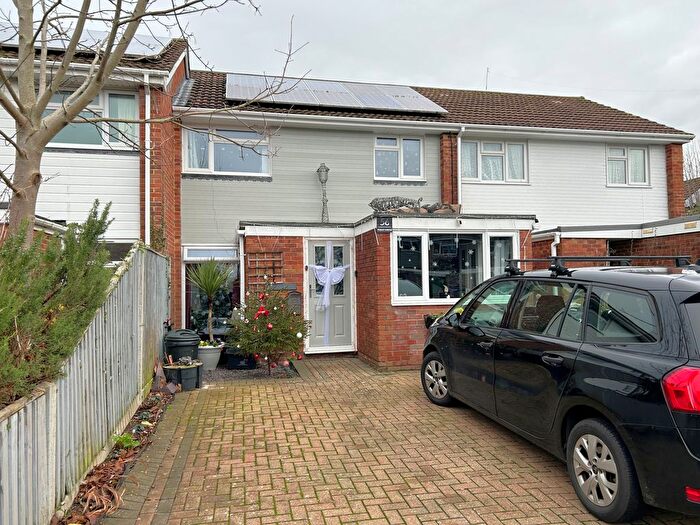
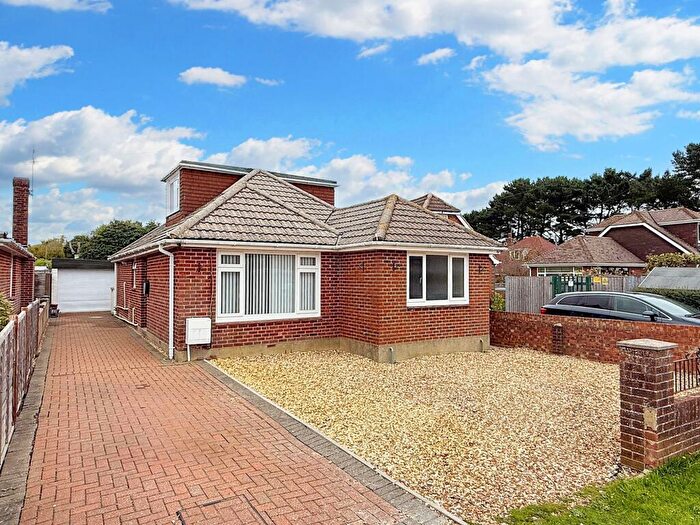
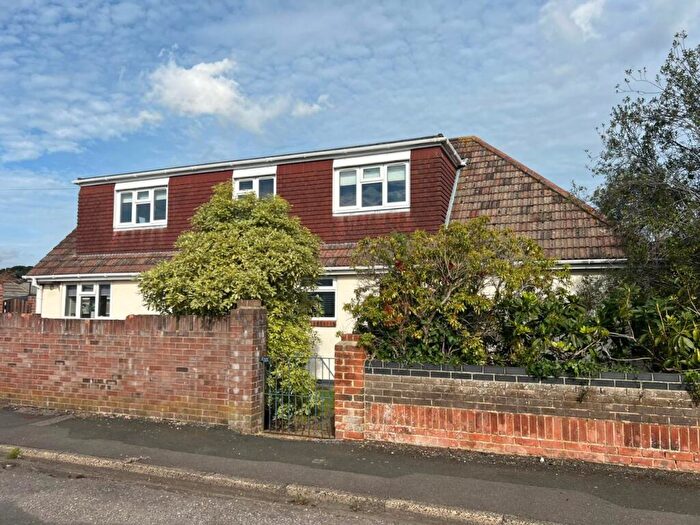
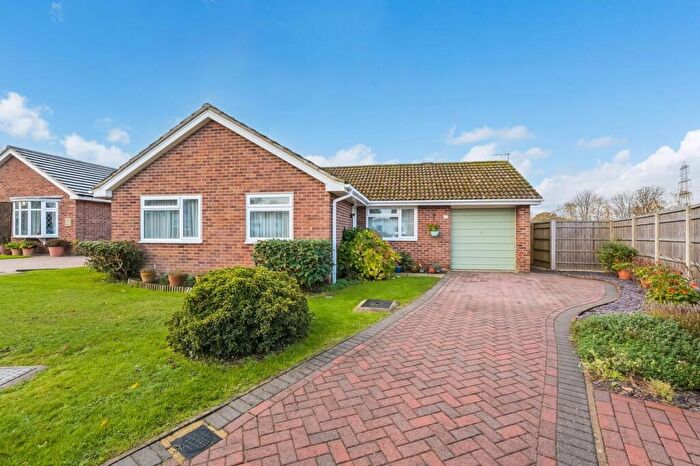
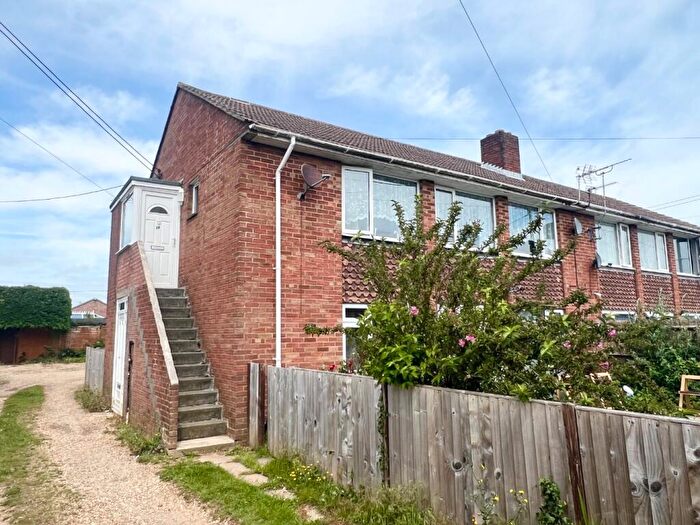
Houses for sale & to rent in Holbury And North Blackfield, Southampton
House Prices in Holbury And North Blackfield
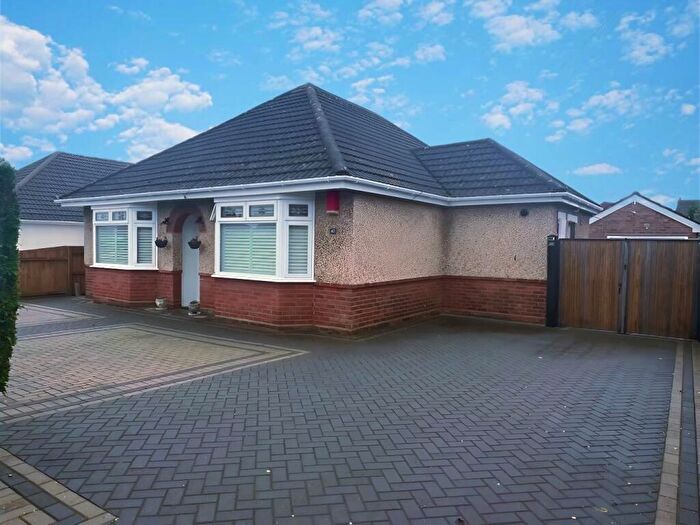
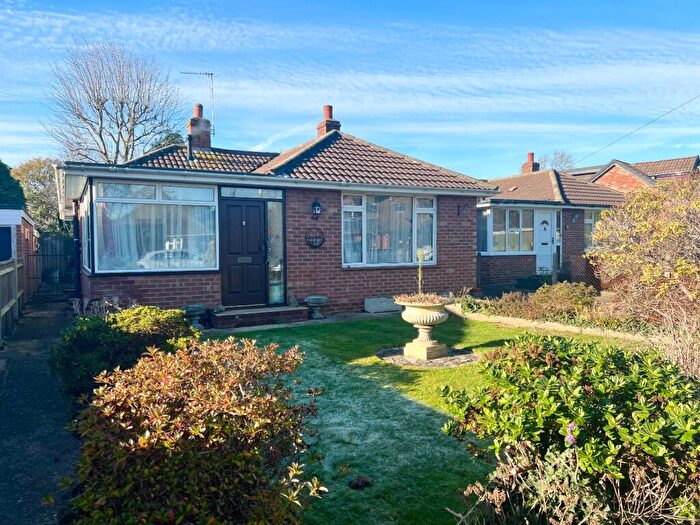
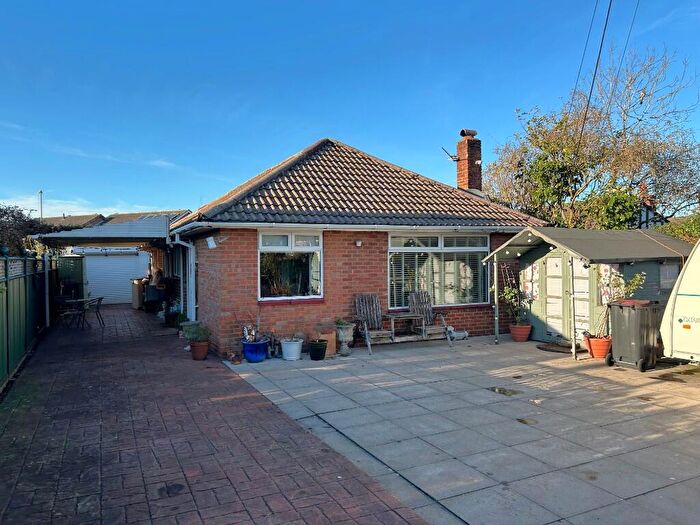
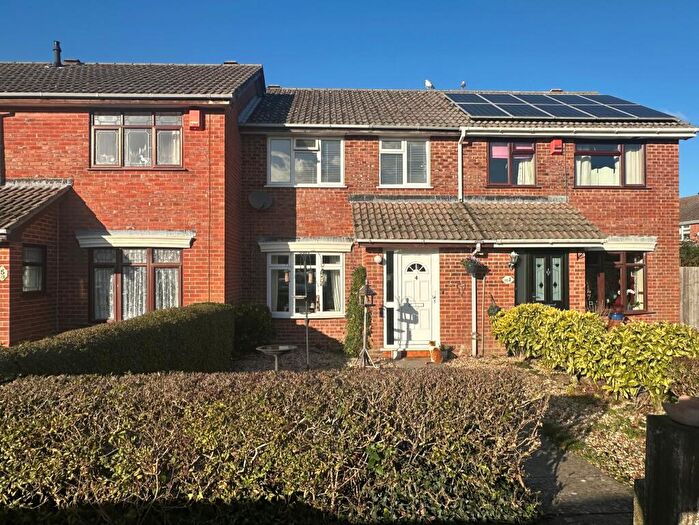
Properties in Holbury And North Blackfield have an average house price of £305,038.00 and had 284 Property Transactions within the last 3 years¹.
Holbury And North Blackfield is an area in Southampton, Hampshire with 2,750 households², where the most expensive property was sold for £715,000.00.
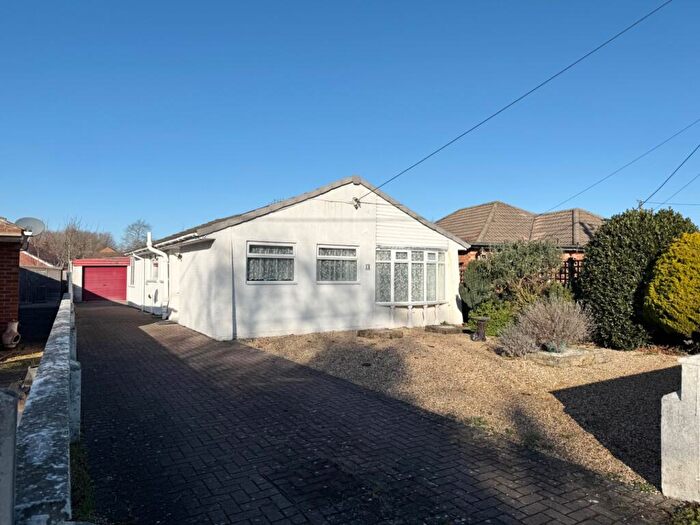
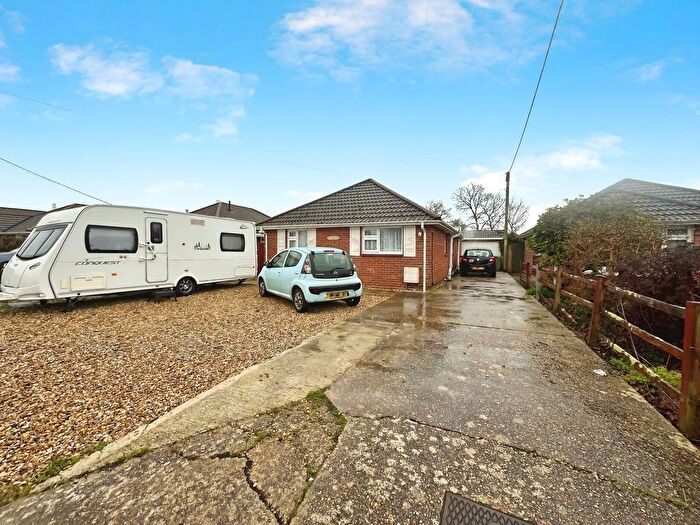
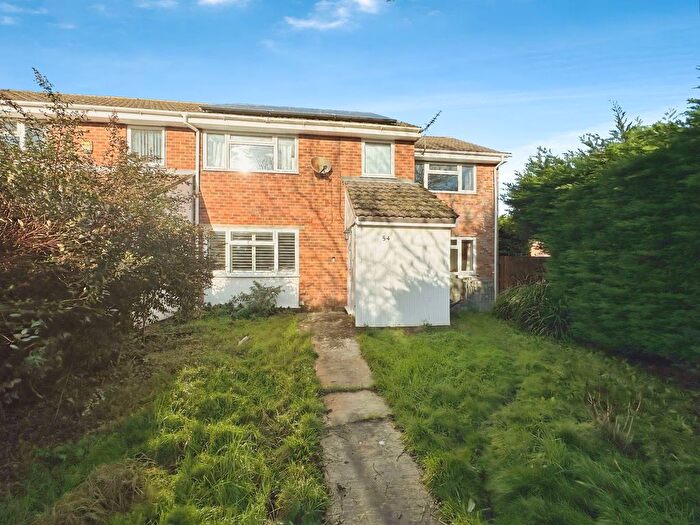
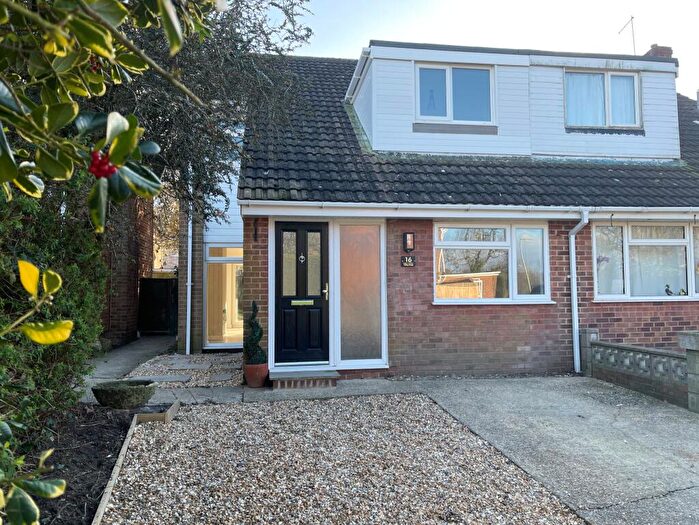
Properties for sale in Holbury And North Blackfield
Roads and Postcodes in Holbury And North Blackfield
Navigate through our locations to find the location of your next house in Holbury And North Blackfield, Southampton for sale or to rent.
| Streets | Postcodes |
|---|---|
| Albany Road | SO45 2NP |
| Alum Close | SO45 2GX SO45 2GY |
| Ashley Cross Close | SO45 2JQ |
| Beechwood Road | SO45 2JA SO45 2JB SO45 2JD |
| Bell Close | SO45 1RE |
| Bevis Close | SO45 1RG |
| Blackfield Road | SO45 1EH |
| Bower Close | SO45 2PR |
| Bramble Close | SO45 2JP |
| Broadley Close | SO45 2PN |
| Broadoak Close | SO45 2PU |
| Burbush Close | SO45 2HU |
| Cherryton Gardens | SO45 2FS |
| Crawte Avenue | SO45 2GN SO45 2GP SO45 2GQ |
| Depedene Close | SO45 2PQ |
| Eastcot Close | SO45 2FG |
| Faircross Close | SO45 2HR |
| Fernside Close | SO45 2JU |
| Foresters Road | SO45 1EJ |
| Fourshells Close | SO45 1EN |
| Foxcroft Drive | SO45 2FE SO45 2FF |
| Fry Close | SO45 1RN |
| Furzey Close | SO45 1EX |
| Glyn Jones Close | SO45 1RJ |
| Great Elms Close | SO45 2FD |
| Hamilton Court | SO45 2AN |
| Harvey Court | SO45 1SG |
| Hayward Court | SO45 2PL |
| Heather Road | SO45 1EL SO45 1ER SO45 1EW SO45 1DZ SO45 1EU |
| Hedley Close | SO45 1RH |
| Hobson Way | SO45 2GE SO45 2GF |
| Holbury Drove | SO45 2FJ SO45 2NE SO45 2NF SO45 2NG SO45 2NH SO45 2PX |
| Ipers Bridge | SO45 2HD |
| Ivor Close | SO45 2NY |
| Larkspur Gardens | SO45 2QH |
| Lightning Close | SO45 1RD |
| Long Copse | SO45 2LA SO45 2LD |
| Long Lane | SO45 2LF SO45 2LG SO45 2ND SO45 2NZ SO45 2PA |
| Long Lane Close | SO45 2LE |
| Manor Road | SO45 2NN SO45 2NQ |
| Mary Drake Close | SO45 2AP |
| May Close | SO45 2GG |
| May Copse | SO45 2GL |
| May Crescent | SO45 2GS |
| Milliken Close | SO45 1RL |
| Moat Close | SO45 2FH |
| Myvern Close | SO45 2HZ |
| Nelson Close | SO45 2JG |
| Newlands Road | SO45 1GA |
| Oakley Close | SO45 2PJ |
| Parkhill Close | SO45 2JE |
| Pendleton Gardens | SO45 1DQ |
| Perrywood Close | SO45 2HT |
| Pondhead Close | SO45 2JF |
| Priest Croft Drive | SO45 1SF SO45 1SL |
| Raymond Close | SO45 2GH |
| Redrise Close | SO45 2PT |
| Renda Road | SO45 2LX SO45 2LY SO45 2LZ SO45 2NA |
| Richard Close | SO45 1RB |
| Ridley Close | SO45 2NR |
| Roewood Close | SO45 2JT |
| Roewood Road | SO45 2JH SO45 2JJ SO45 2JN SO45 2JL |
| Rollestone Road | SO45 2GB SO45 2GZ SO45 2HA |
| Ruxley Close | SO45 2PH |
| Shapton Close | SO45 2QJ |
| Sloane Avenue | SO45 2LH |
| Smith Close | SO45 1RF |
| Southbourne Avenue | SO45 2NS SO45 2NT SO45 2NU SO45 2NW SO45 2NX |
| Springfield Avenue | SO45 2LN SO45 2LP SO45 2LQ |
| Springfield Grove | SO45 2LJ SO45 2LL |
| Stagbrake Close | SO45 2PS |
| Stanley Road | SO45 2LR |
| Stephen Court | SO45 2GU |
| Stockley Close | SO45 2HQ |
| Stonymoor Close | SO45 2HL |
| Studley Avenue | SO45 2PP |
| Teachers Way | SO45 2QG |
| The Close | SO45 2PG |
| The Fowey | SO45 1SH |
| The Greenwich | SO45 1SJ |
| The Precinct Drove | SO45 2PW |
| Thornhill Close | SO45 1EQ |
| Thornhill Road | SO45 1EP SO45 1QP SO45 1QQ |
| Timberly Close | SO45 2QE |
| Toomer Close | SO45 1RP |
| Trenley Close | SO45 2HN |
| Valley Close | SO45 1WU |
| Waltons Avenue | SO45 2LS SO45 2LT SO45 2LU |
| Watton Road | SO45 2LW |
| Wedgewood Close | SO45 2QF |
| Wentworth Gardens | SO45 2GR |
| Wentworth Grove | SO45 2LB |
| Westbourne Avenue | SO45 2NJ SO45 2NL |
| Westcot Road | SO45 2FB |
| Whitefield Road | SO45 2HP SO45 2HS SO45 2HW SO45 2HX SO45 2HY |
| Whyte Close | SO45 2FT |
| Williams Close | SO45 2GT |
| Wilverley Place | SO45 1XW |
| Winters Close | SO45 2GJ |
| SO45 2AR |
Transport near Holbury And North Blackfield
- FAQ
- Price Paid By Year
- Property Type Price
Frequently asked questions about Holbury And North Blackfield
What is the average price for a property for sale in Holbury And North Blackfield?
The average price for a property for sale in Holbury And North Blackfield is £305,038. This amount is 22% lower than the average price in Southampton. There are 407 property listings for sale in Holbury And North Blackfield.
What streets have the most expensive properties for sale in Holbury And North Blackfield?
The streets with the most expensive properties for sale in Holbury And North Blackfield are Newlands Road at an average of £650,000, Springfield Grove at an average of £440,400 and Rollestone Road at an average of £434,600.
What streets have the most affordable properties for sale in Holbury And North Blackfield?
The streets with the most affordable properties for sale in Holbury And North Blackfield are Long Lane at an average of £169,375, Sloane Avenue at an average of £196,687 and Pondhead Close at an average of £211,666.
Which train stations are available in or near Holbury And North Blackfield?
Some of the train stations available in or near Holbury And North Blackfield are Netley, Hamble and Sholing.
Property Price Paid in Holbury And North Blackfield by Year
The average sold property price by year was:
| Year | Average Sold Price | Price Change |
Sold Properties
|
|---|---|---|---|
| 2025 | £292,327 | -8% |
48 Properties |
| 2024 | £314,970 | 7% |
86 Properties |
| 2023 | £291,619 | -7% |
66 Properties |
| 2022 | £312,678 | 6% |
84 Properties |
| 2021 | £293,841 | 10% |
117 Properties |
| 2020 | £265,834 | -4% |
69 Properties |
| 2019 | £276,385 | 7% |
71 Properties |
| 2018 | £256,835 | -2% |
84 Properties |
| 2017 | £263,030 | 8% |
70 Properties |
| 2016 | £243,152 | 14% |
102 Properties |
| 2015 | £208,972 | 2% |
98 Properties |
| 2014 | £204,219 | 5% |
107 Properties |
| 2013 | £193,292 | 2% |
84 Properties |
| 2012 | £189,085 | 2% |
60 Properties |
| 2011 | £184,607 | 3% |
63 Properties |
| 2010 | £179,715 | 1% |
69 Properties |
| 2009 | £177,751 | -3% |
108 Properties |
| 2008 | £183,478 | -1% |
56 Properties |
| 2007 | £185,631 | 7% |
131 Properties |
| 2006 | £173,449 | 3% |
127 Properties |
| 2005 | £169,087 | 1% |
70 Properties |
| 2004 | £167,684 | 10% |
92 Properties |
| 2003 | £151,163 | 20% |
93 Properties |
| 2002 | £121,234 | 15% |
131 Properties |
| 2001 | £102,452 | 9% |
134 Properties |
| 2000 | £93,374 | 15% |
112 Properties |
| 1999 | £79,571 | 8% |
141 Properties |
| 1998 | £72,859 | 7% |
120 Properties |
| 1997 | £68,023 | 17% |
118 Properties |
| 1996 | £56,711 | 1% |
97 Properties |
| 1995 | £56,042 | - |
75 Properties |
Property Price per Property Type in Holbury And North Blackfield
Here you can find historic sold price data in order to help with your property search.
The average Property Paid Price for specific property types in the last three years are:
| Property Type | Average Sold Price | Sold Properties |
|---|---|---|
| Semi Detached House | £296,720.00 | 72 Semi Detached Houses |
| Detached House | £387,516.00 | 94 Detached Houses |
| Terraced House | £263,816.00 | 95 Terraced Houses |
| Flat | £164,258.00 | 23 Flats |

