
Houses for sale & to rent in SO52 9FN, Seymour Lane, North Baddesley, Southampton
House Prices in SO52 9FN, Seymour Lane, North Baddesley
Properties in SO52 9FN have an average house price of £285k and had 2 Property Transactions within the last 3 years.¹ SO52 9FN is a postcode in Seymour Lane located in North Baddesley, an area in Southampton, Hampshire, with 13 households², where the most expensive property was sold for £294k.
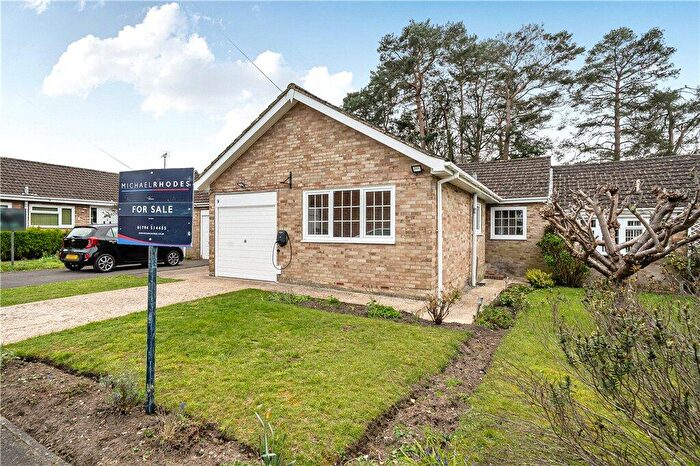
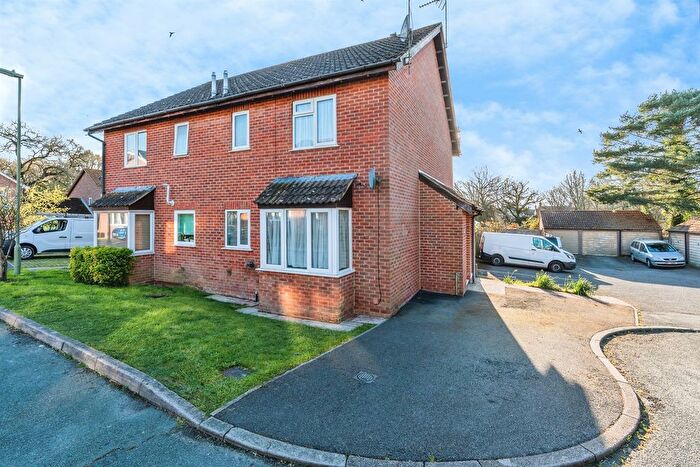
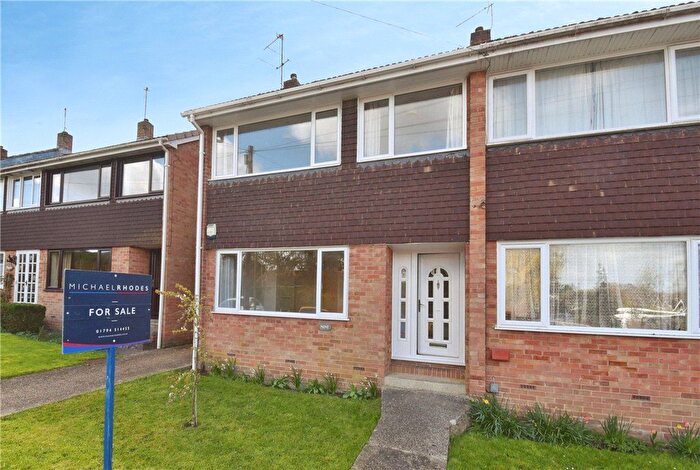
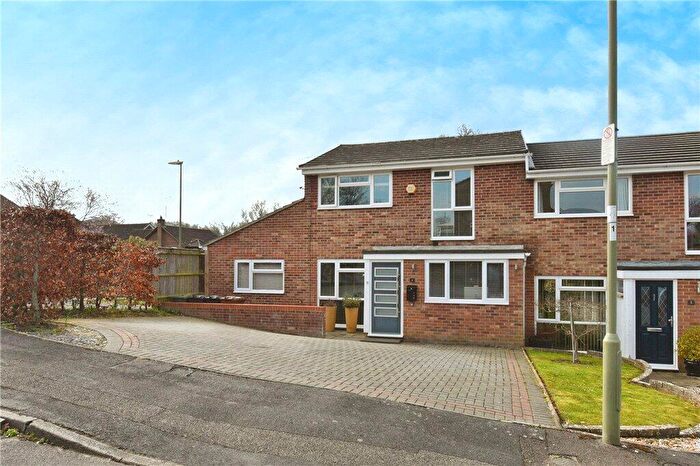
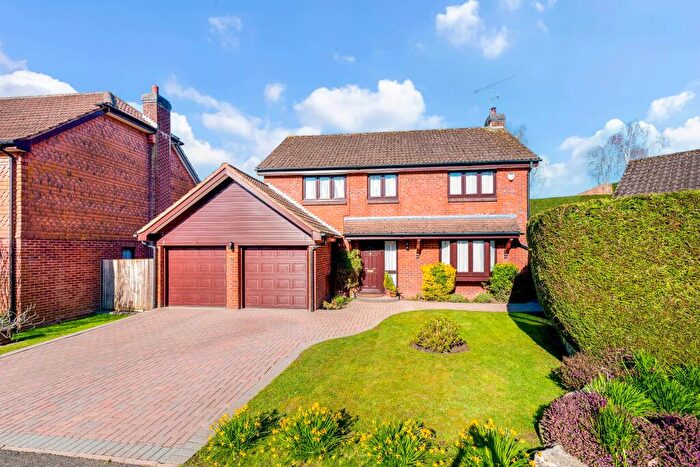
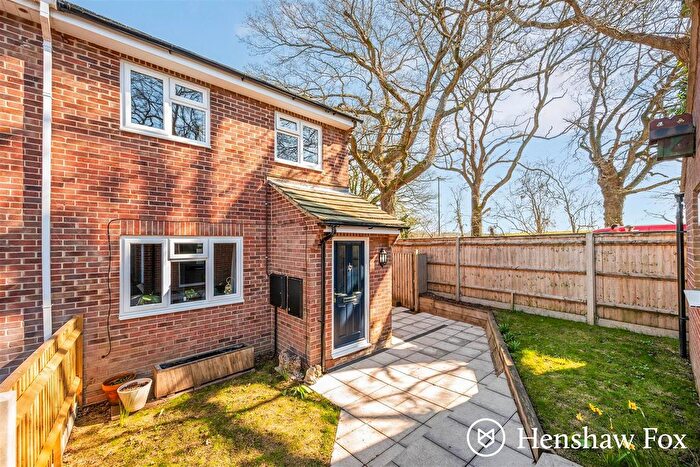
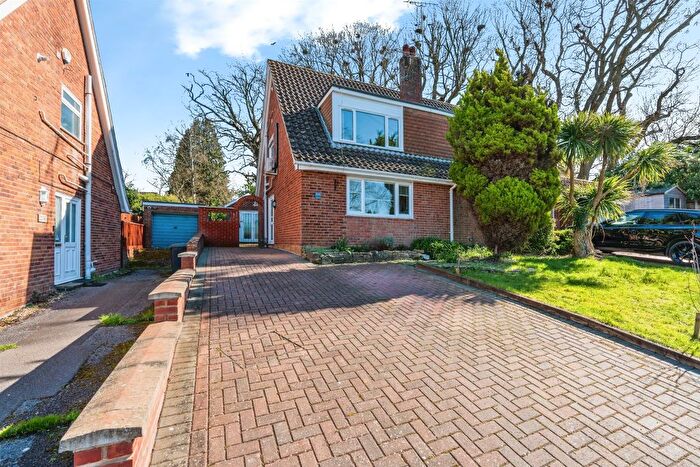
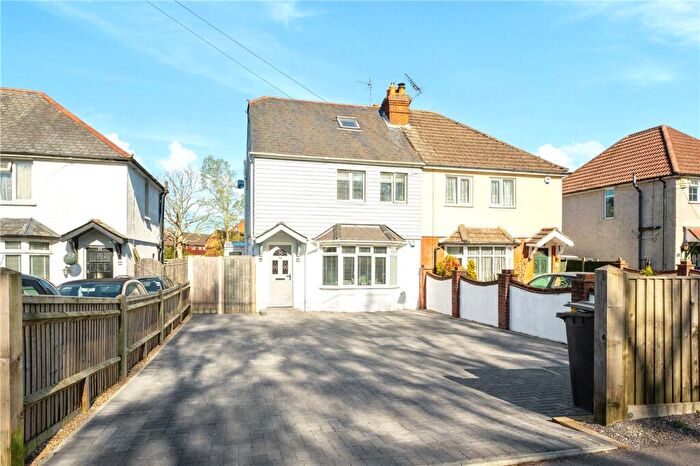
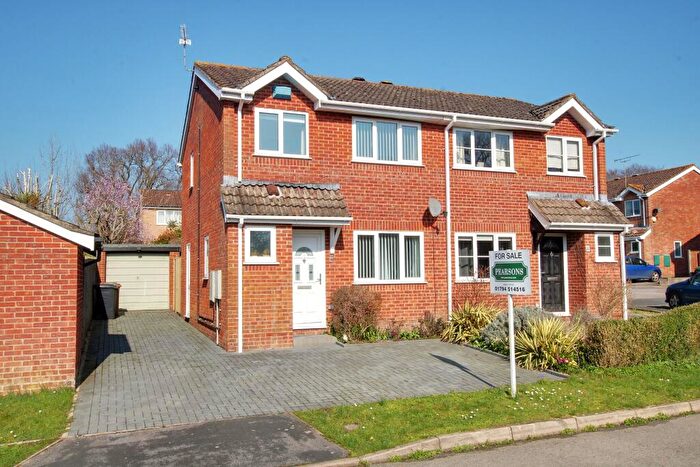
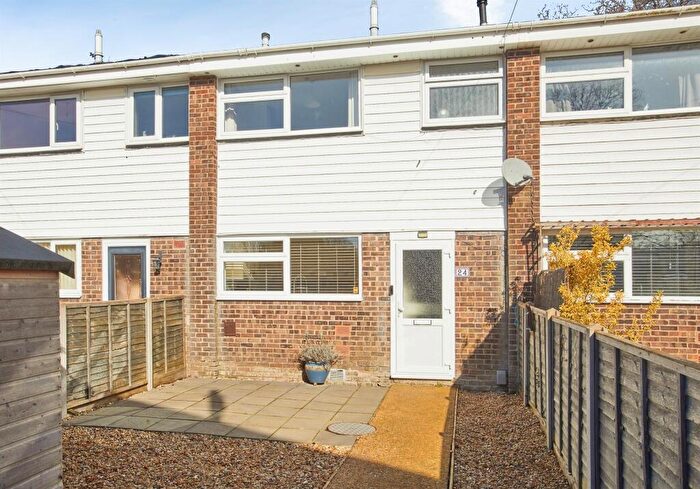
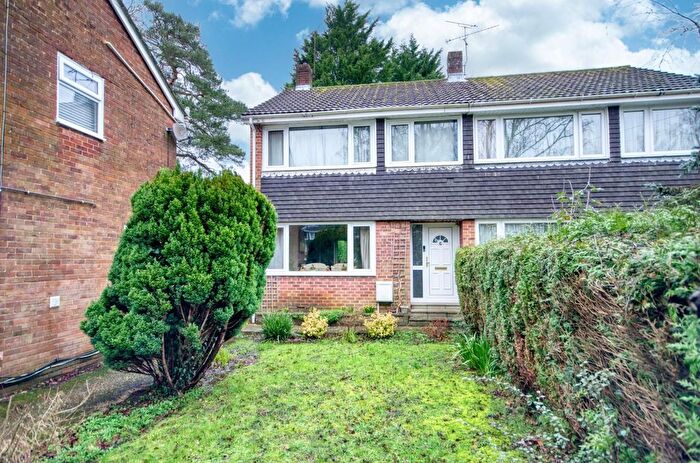
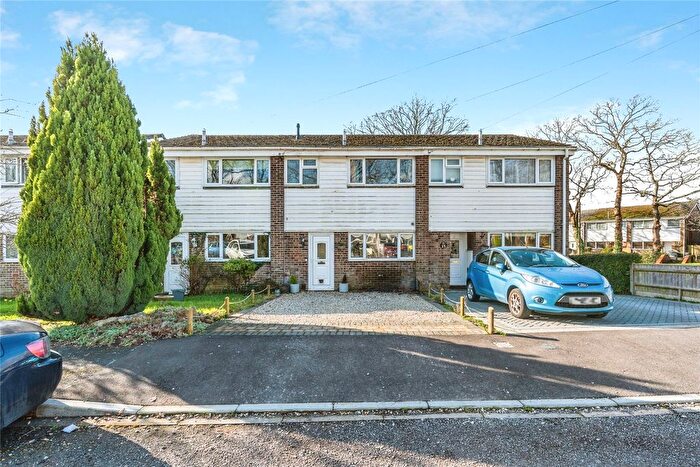
Properties for sale near SO52 9FN, Seymour Lane

![]()
If you are looking to sell your house, let it out, or receive a property valuation, an expert can help you.
Click the button below to get started.


Price Paid in Seymour Lane, SO52 9FN, North Baddesley
18 Seymour Lane, SO52 9FN, North Baddesley Southampton
Property 18 has been sold 2 times. The last time it was sold was in 26/06/2025 and the sold price was £293,500.00.
This semi detached house, sold as a freehold on 26/06/2025, is a 73 sqm semi-detached house with an EPC rating of D.
| Date | Price | Property Type | Tenure | Classification |
|---|---|---|---|---|
| 26/06/2025 | £293,500.00 | Semi Detached House | freehold | Established Building |
| 30/09/2011 | £184,000.00 | Semi Detached House | freehold | Established Building |
19 Seymour Lane, SO52 9FN, North Baddesley Southampton
Property 19 has been sold 2 times. The last time it was sold was in 14/08/2024 and the sold price was £276,000.00.
This semi detached house, sold as a freehold on 14/08/2024, is a 61 sqm semi-detached house with an EPC rating of C.
| Date | Price | Property Type | Tenure | Classification |
|---|---|---|---|---|
| 14/08/2024 | £276,000.00 | Semi Detached House | freehold | Established Building |
| 30/04/1997 | £54,250.00 | Semi Detached House | freehold | Established Building |
SEYMOUR PARADE Seymour Lane, SO52 9FN, North Baddesley Southampton
Property SEYMOUR PARADE has been sold 1 time. The last time it was sold was in 19/08/2020 and the sold price was £1,500,000.00.
This is a Other Property which was sold as a freehold in 19/08/2020
| Date | Price | Property Type | Tenure | Classification |
|---|---|---|---|---|
| 19/08/2020 | £1,500,000.00 | Other Property | freehold | Established Building |
12 Seymour Lane, SO52 9FN, North Baddesley Southampton
Property 12 has been sold 3 times. The last time it was sold was in 21/09/2016 and the sold price was £228,000.00.
This terraced house, sold as a freehold on 21/09/2016, is a 66 sqm end-terrace house with an EPC rating of D.
| Date | Price | Property Type | Tenure | Classification |
|---|---|---|---|---|
| 21/09/2016 | £228,000.00 | Terraced House | freehold | Established Building |
| 15/02/2013 | £158,000.00 | Terraced House | freehold | Established Building |
| 09/05/2003 | £122,000.00 | Terraced House | freehold | Established Building |
17 Seymour Lane, SO52 9FN, North Baddesley Southampton
Property 17 has been sold 2 times. The last time it was sold was in 28/08/2014 and the sold price was £195,000.00.
This semi detached house, sold as a freehold on 28/08/2014, is a 63 sqm semi-detached house with an EPC rating of E.
| Date | Price | Property Type | Tenure | Classification |
|---|---|---|---|---|
| 28/08/2014 | £195,000.00 | Semi Detached House | freehold | Established Building |
| 22/02/2002 | £102,000.00 | Semi Detached House | freehold | Established Building |
16 Seymour Lane, SO52 9FN, North Baddesley Southampton
Property 16 has been sold 1 time. The last time it was sold was in 28/08/2007 and the sold price was £150,000.00.
This terraced house, sold as a freehold on 28/08/2007, is a 64 sqm end-terrace house with an EPC rating of C.
| Date | Price | Property Type | Tenure | Classification |
|---|---|---|---|---|
| 28/08/2007 | £150,000.00 | Terraced House | freehold | Established Building |
20 Seymour Lane, SO52 9FN, North Baddesley Southampton
Property 20 has been sold 2 times. The last time it was sold was in 15/09/1995 and the sold price was £70,000.00.
This is a Semi Detached House which was sold as a freehold in 15/09/1995
| Date | Price | Property Type | Tenure | Classification |
|---|---|---|---|---|
| 15/09/1995 | £70,000.00 | Semi Detached House | freehold | Established Building |
| 03/04/1995 | £72,200.00 | Semi Detached House | freehold | Established Building |
4 SEYMOUR LANE NORTH BADDESLEY, SO52 9FN, North Baddesley Southampton
This is a 74 square meter Top-floor Flat with an EPC rating of D. Currently, there is no transaction history available for this property.
Transport near SO52 9FN, Seymour Lane
-
 Romsey Station
 -
Chandlers Ford Station
-
Swaythling Station
-
Redbridge Station
-
Southampton Airport (Parkway) Station
-
Totton Station
-
Eastleigh Station
-
Millbrook (Hampshire) Station
-
St.Denys Station
-
Southampton Central Station
House price paid reports for SO52 9FN, Seymour Lane
Click on the buttons below to see price paid reports by year or property price:
- Price Paid By Year
- Property Type Price
Property Price Paid in SO52 9FN, Seymour Lane by Year
The average sold property price by year was:
| Year | Average Sold Price | Price Change |
Sold Properties
|
|---|---|---|---|
| 2025 | £293,500 | 6% |
1 Property |
| 2024 | £276,000 | 17% |
1 Property |
| 2016 | £228,000 | 14% |
1 Property |
| 2014 | £195,000 | 19% |
1 Property |
| 2013 | £158,000 | -16% |
1 Property |
| 2011 | £184,000 | 18% |
1 Property |
| 2007 | £150,000 | 19% |
1 Property |
| 2003 | £122,000 | 16% |
1 Property |
| 2002 | £102,000 | 47% |
1 Property |
| 1997 | £54,250 | -31% |
1 Property |
| 1995 | £71,100 | - |
2 Properties |
Property Price per Property Type in SO52 9FN, Seymour Lane
Here you can find historic sold price data in order to help with your property search.
The average Property Paid Price for specific property types in the last three years are:
| Property Type | Average Sold Price | Sold Properties |
|---|---|---|
| Semi Detached House | £284,750.00 | 2 Semi Detached Houses |