
Houses for sale & to rent in SO40 8AN, SKYLARK WALK, Totton North, Southampton
House Prices in SO40 8AN, SKYLARK WALK, Totton North
Properties in SO40 8AN have no sales history available within the last 3 years. SO40 8AN is a postcode in SKYLARK WALK located in Totton North, an area in Southampton, Hampshire, with 0 household².
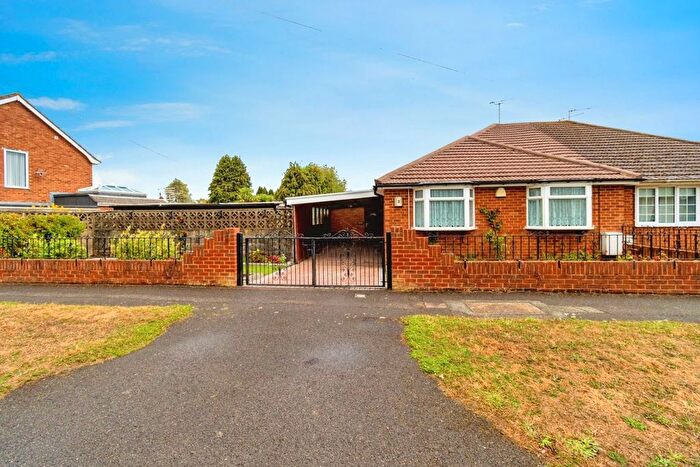
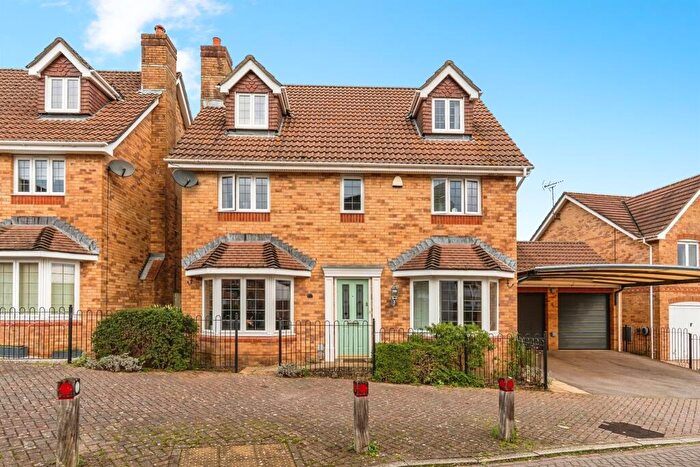
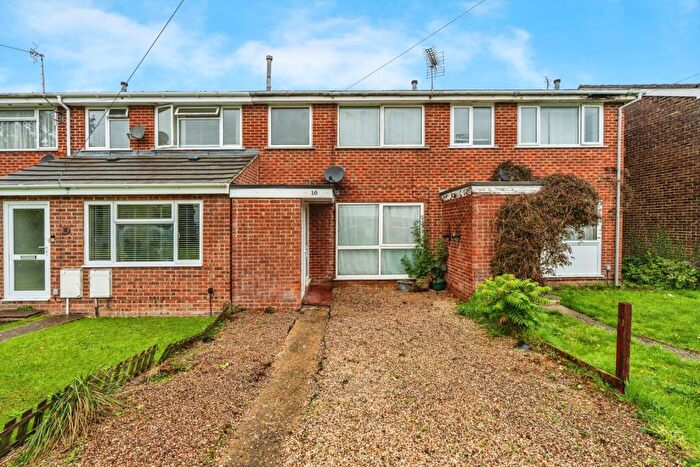
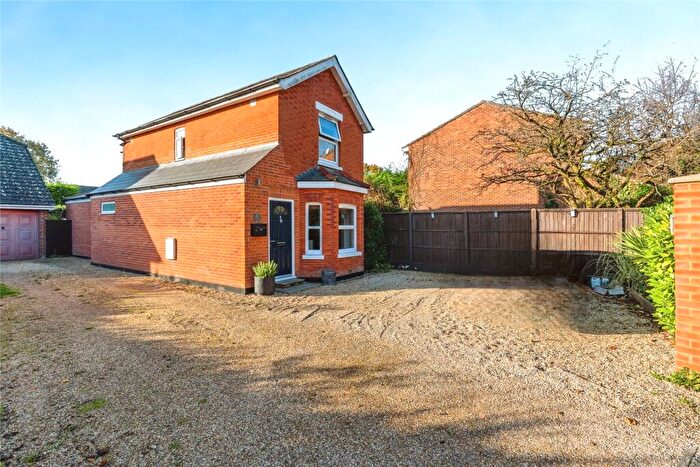
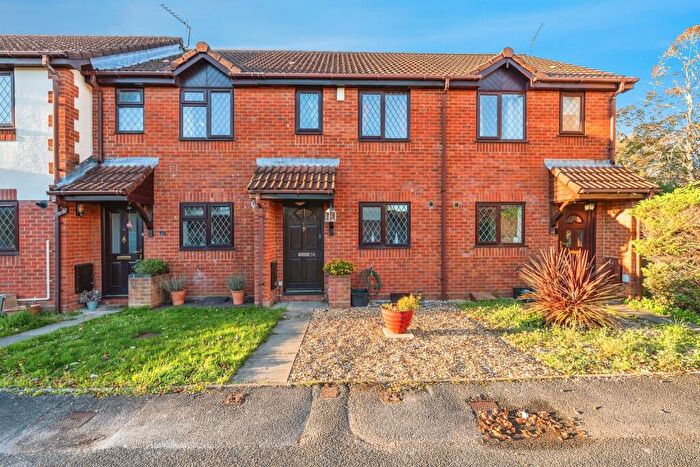
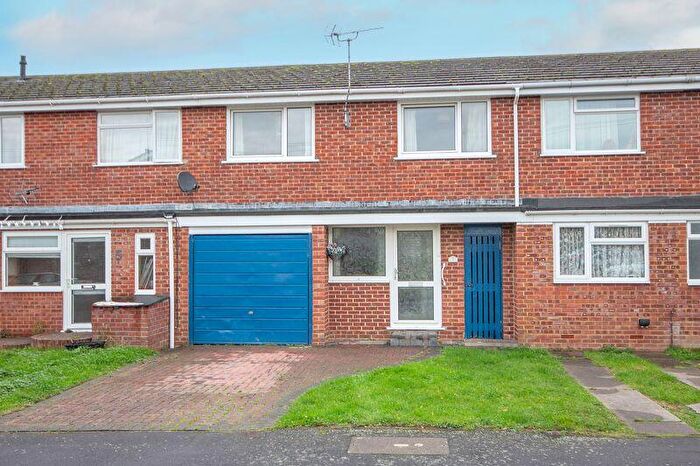
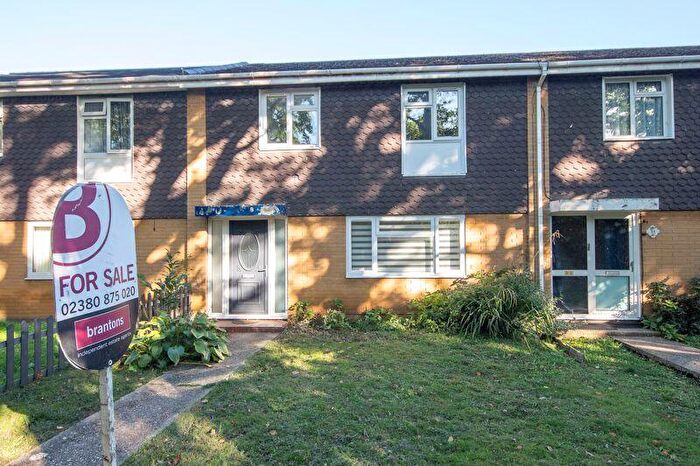
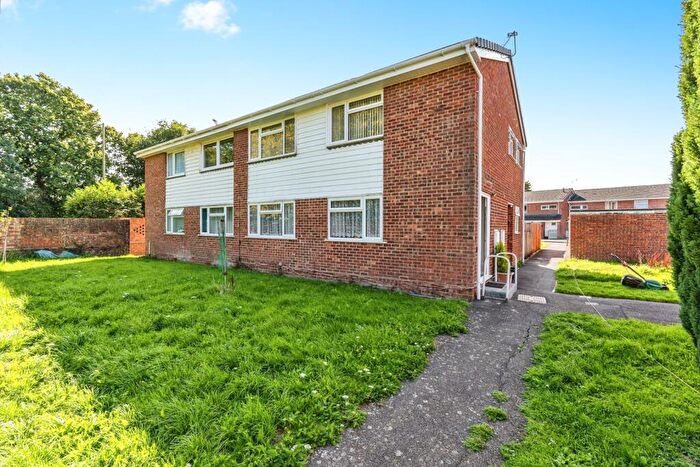
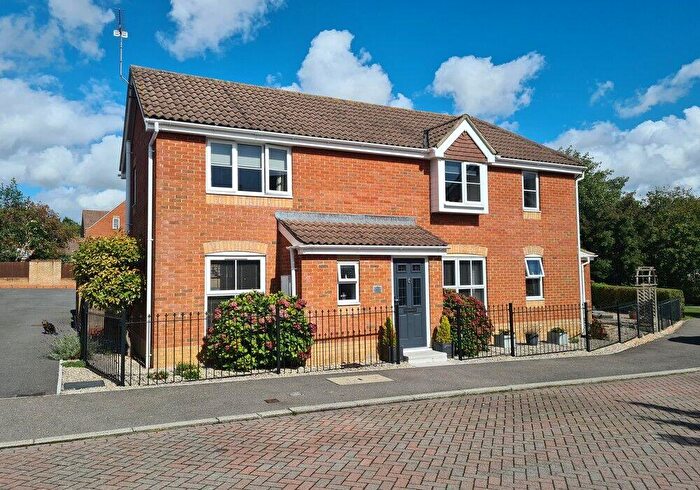
Properties for sale near SO40 8AN, SKYLARK WALK

![]()
If you are looking to sell your house, let it out, or receive a property valuation, an expert can help you.
Click the button below to get started.
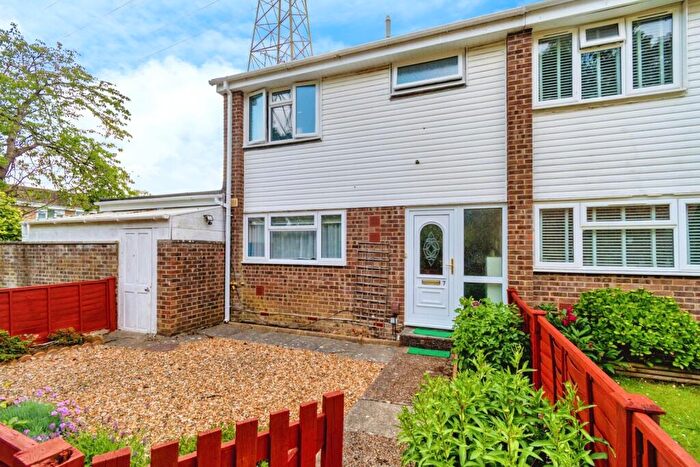
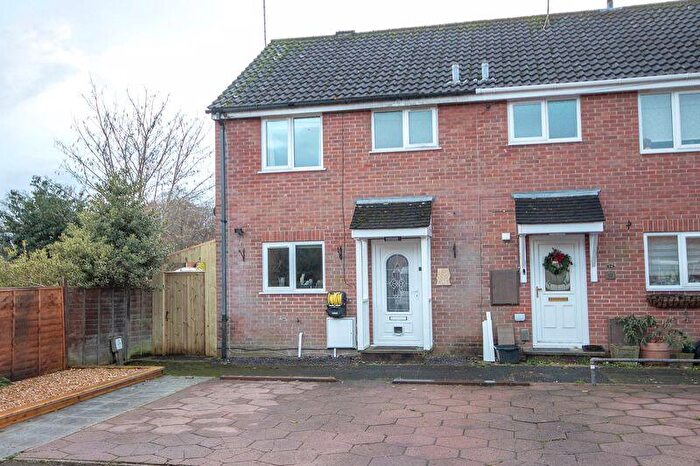
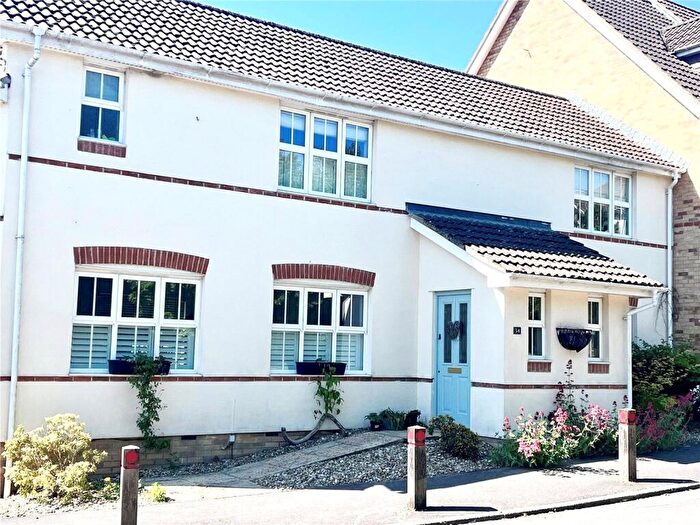
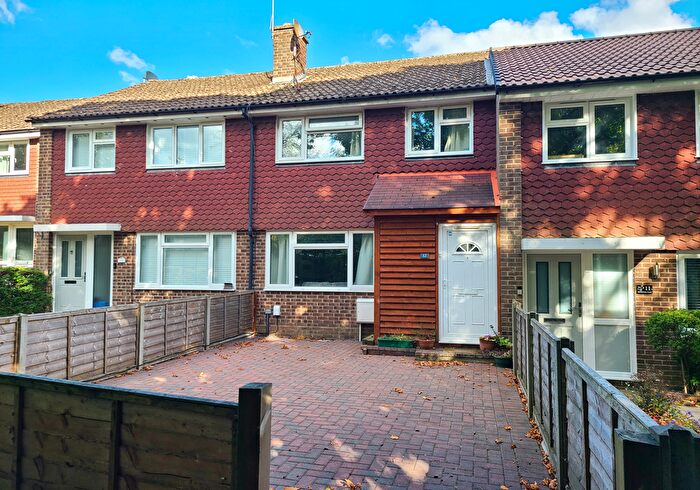
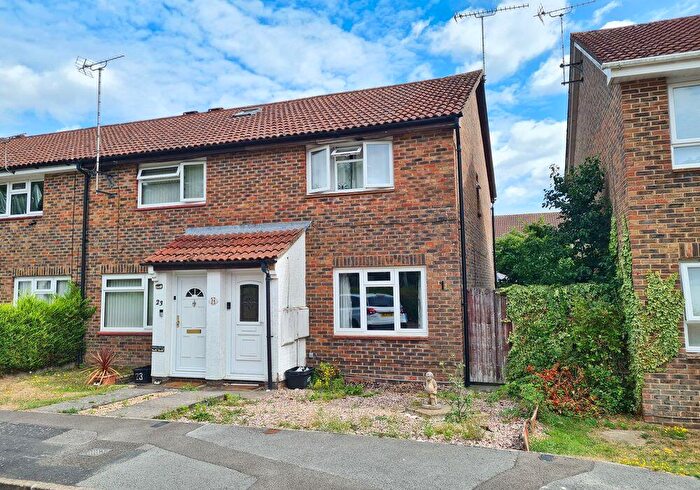
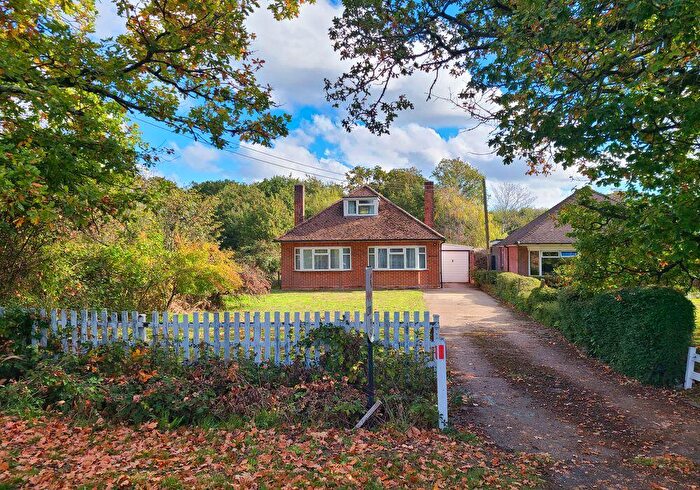

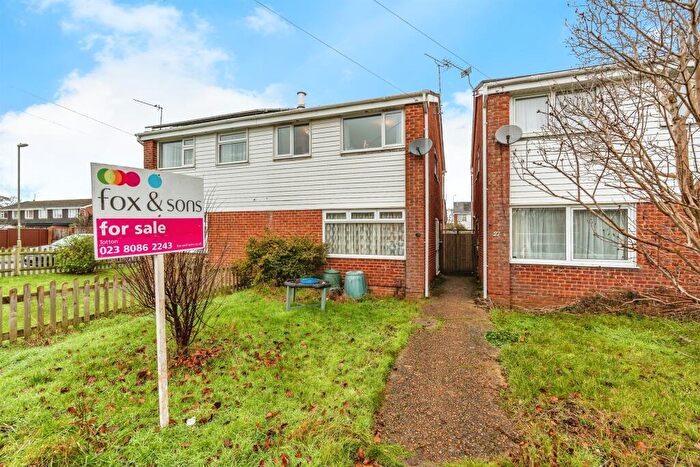
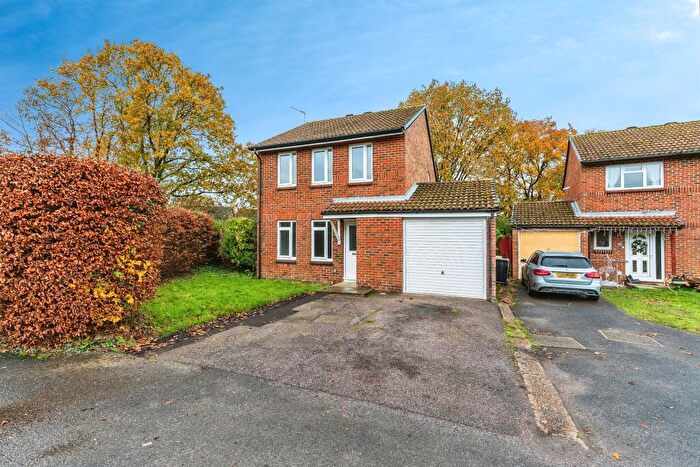
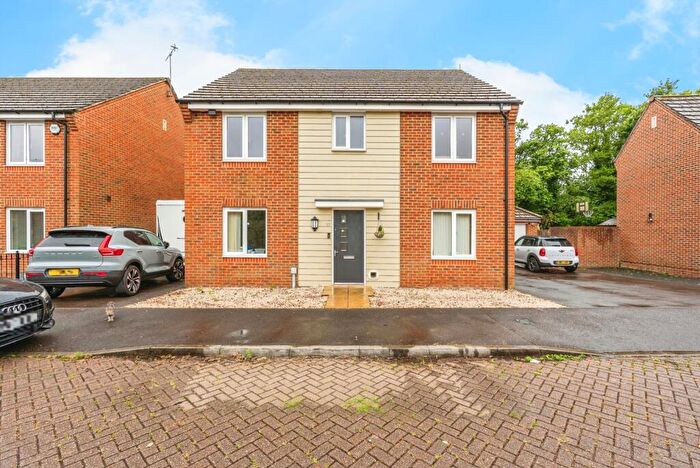
Previously listed properties near SO40 8AN, SKYLARK WALK
![]()
If you are looking to sell your house, let it out, or receive a property valuation, an expert can help you.
Click the button below to get started.
Price Paid in SKYLARK WALK, SO40 8AN, Totton North
7 SKYLARK WALK, SO40 8AN, Totton North Southampton
Property 7 has been sold 2 times. The last time it was sold was in 28/05/2021 and the sold price was £440,000.00.
This detached house, sold as a freehold on 28/05/2021, is a 111 sqm detached house with an EPC rating of B.
| Date | Price | Property Type | Tenure | Classification |
|---|---|---|---|---|
| 28/05/2021 | £440,000.00 | Detached House | freehold | Established Building |
| 12/10/2017 | £400,000.00 | Detached House | freehold | Established Building |
5 SKYLARK WALK, SO40 8AN, Totton North Southampton
Property 5 has been sold 1 time. The last time it was sold was in 25/09/2014 and the sold price was £339,950.00.
This detached house, sold as a freehold on 25/09/2014, is a 111 sqm detached house with an EPC rating of B.
| Date | Price | Property Type | Tenure | Classification |
|---|---|---|---|---|
| 25/09/2014 | £339,950.00 | Detached House | freehold | New Build |
6 SKYLARK WALK, SO40 8AN, Totton North Southampton
Property 6 has been sold 1 time. The last time it was sold was in 29/08/2014 and the sold price was £334,950.00.
This detached house, sold as a freehold on 29/08/2014, is a 111 sqm detached house with an EPC rating of B.
| Date | Price | Property Type | Tenure | Classification |
|---|---|---|---|---|
| 29/08/2014 | £334,950.00 | Detached House | freehold | New Build |
Transport near SO40 8AN, SKYLARK WALK

House price paid reports for SO40 8AN, SKYLARK WALK
Click on the buttons below to see price paid reports by year or property price:
- Price Paid By Year
Property Price Paid in SO40 8AN, SKYLARK WALK by Year
The average sold property price by year was:
| Year | Average Sold Price | Price Change |
Sold Properties
|
|---|---|---|---|
| 2021 | £440,000 | 9% |
1 Property |
| 2017 | £400,000 | 16% |
1 Property |
| 2014 | £337,450 | - |
2 Properties |