
Houses for sale & to rent in SO40 7JL, Kenmore Close, Totton South, Southampton
House Prices in SO40 7JL, Kenmore Close, Totton South
Properties in SO40 7JL have no sales history available within the last 3 years. SO40 7JL is a postcode in Kenmore Close located in Totton South, an area in Southampton, Hampshire, with 5 households².
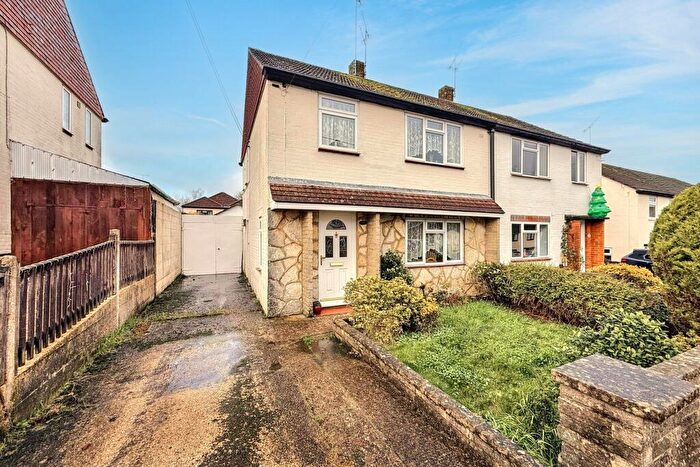
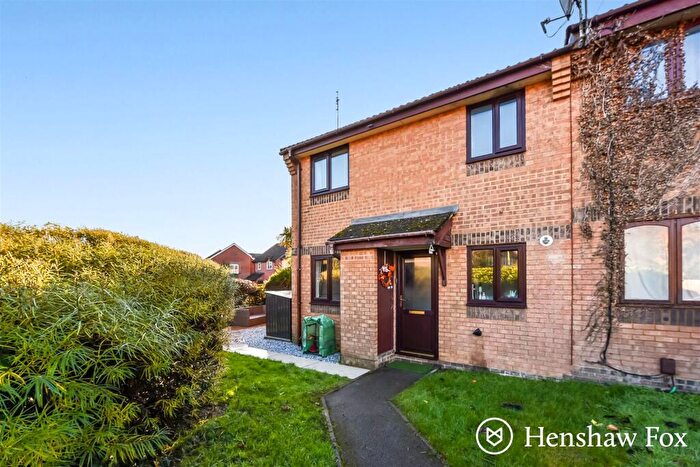
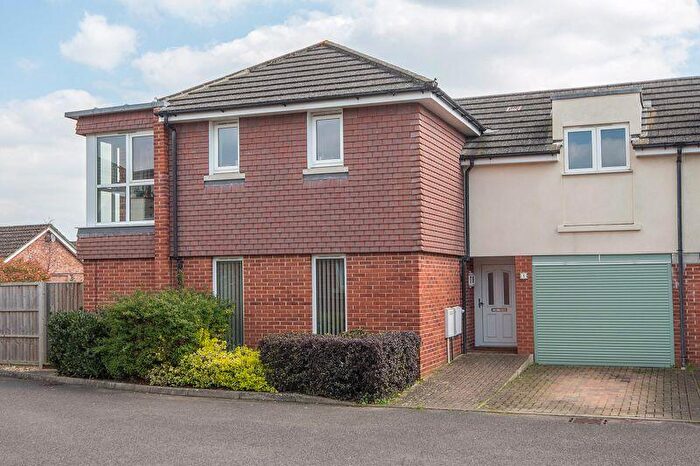
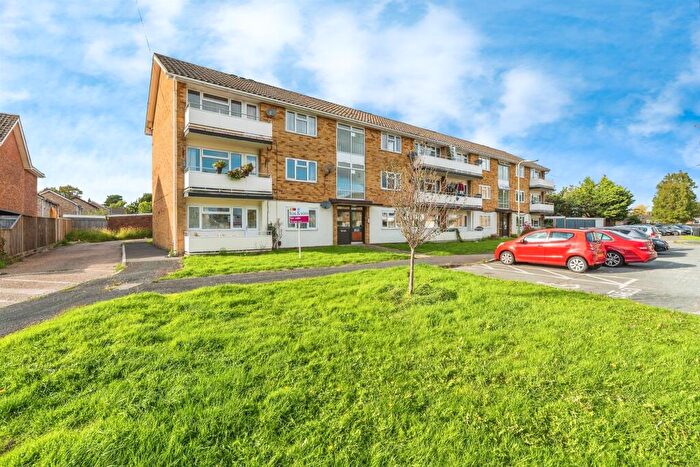
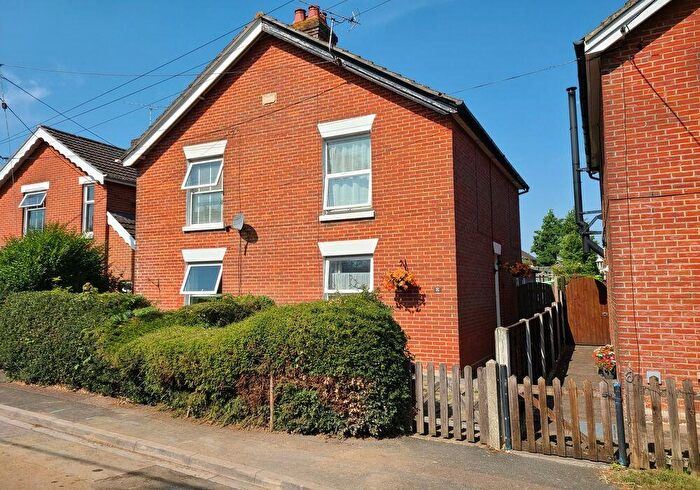
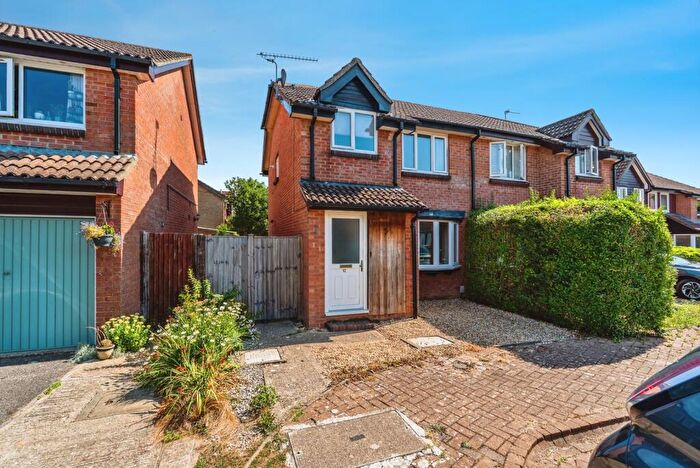
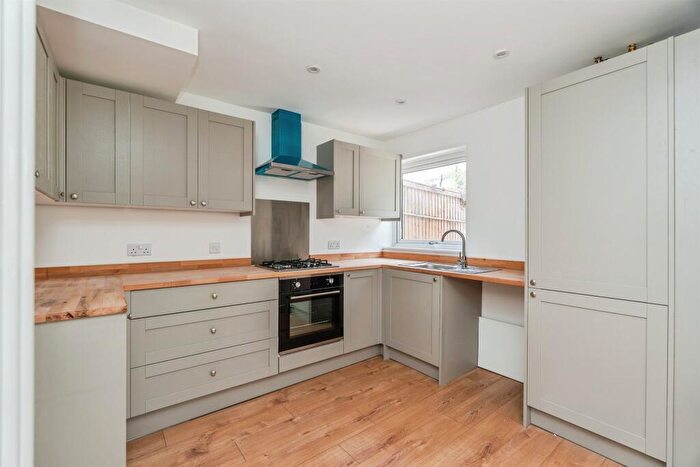
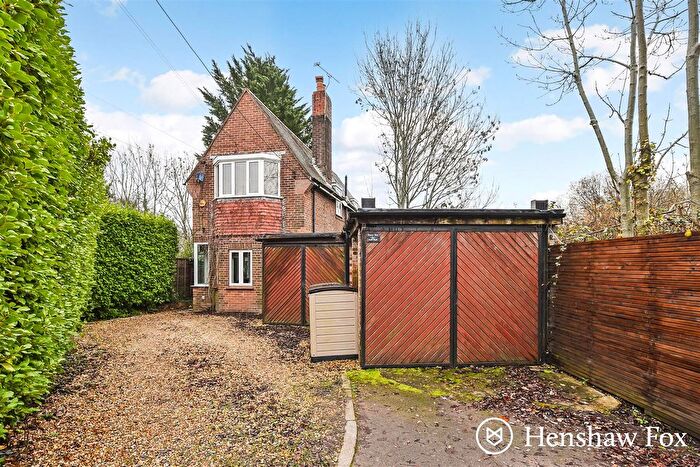
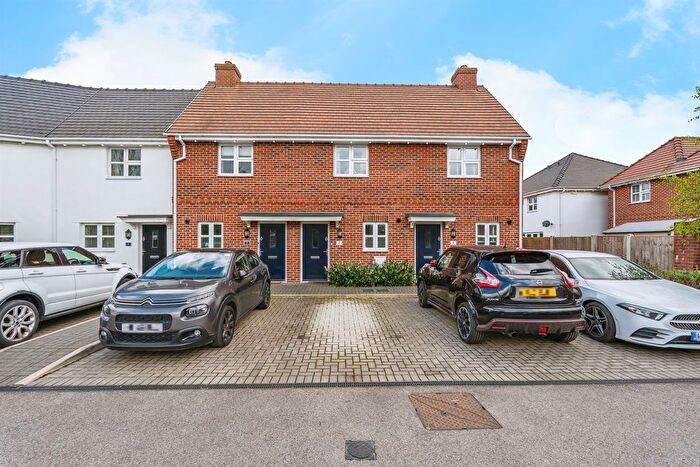
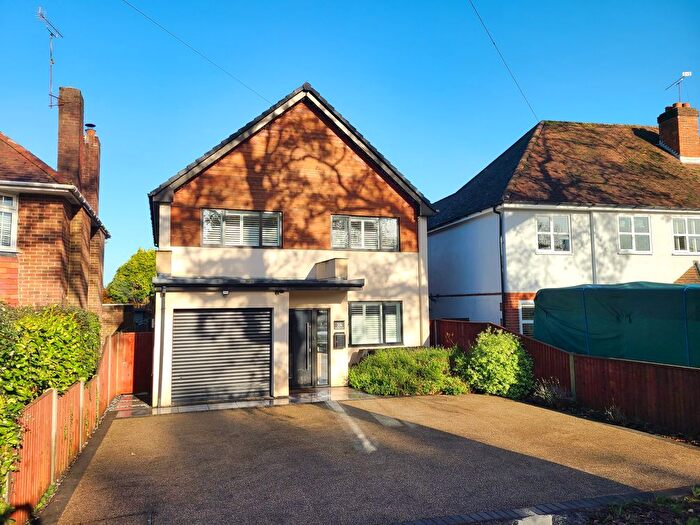
Properties for sale near SO40 7JL, Kenmore Close

![]()
If you are looking to sell your house, let it out, or receive a property valuation, an expert can help you.
Click the button below to get started.
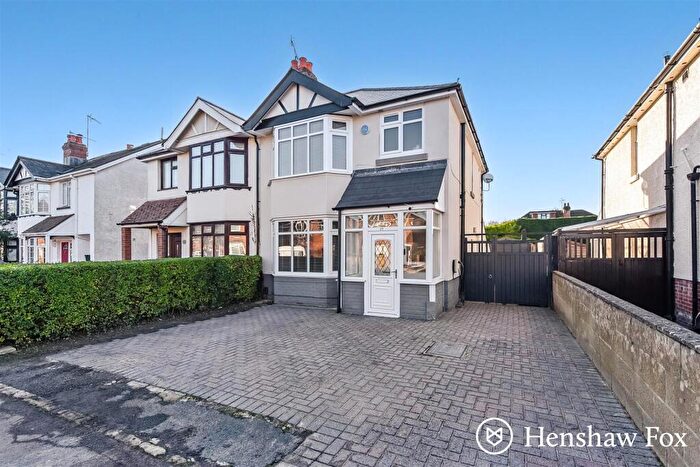
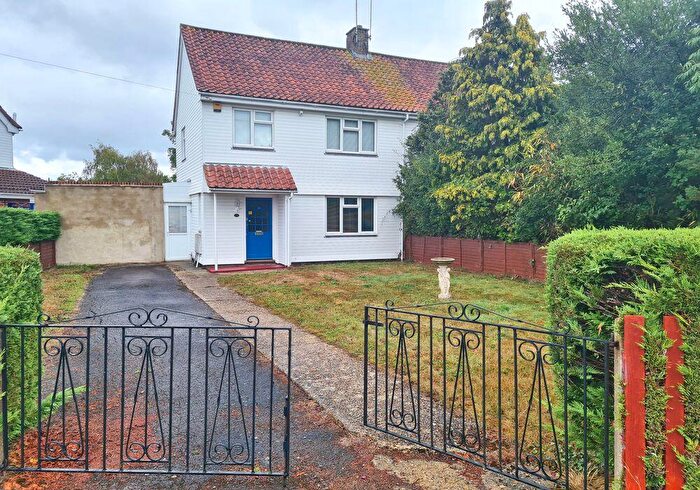
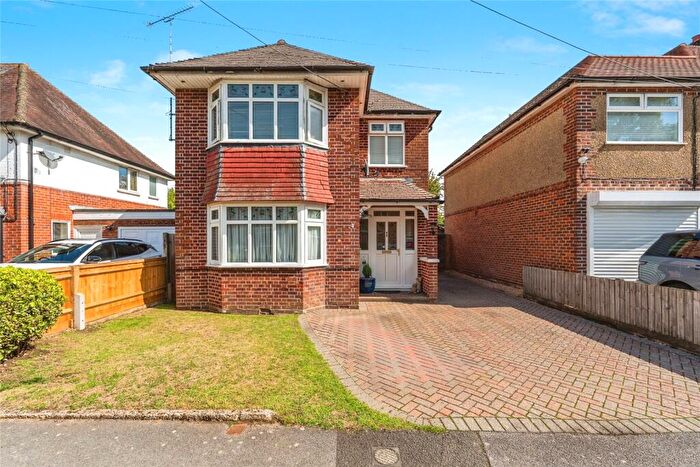
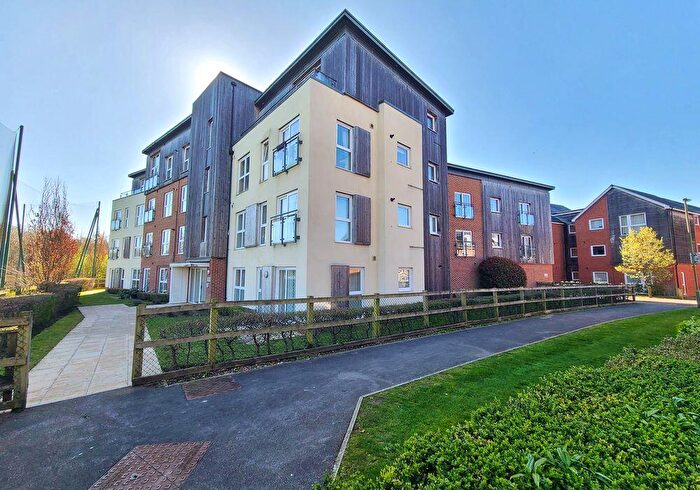
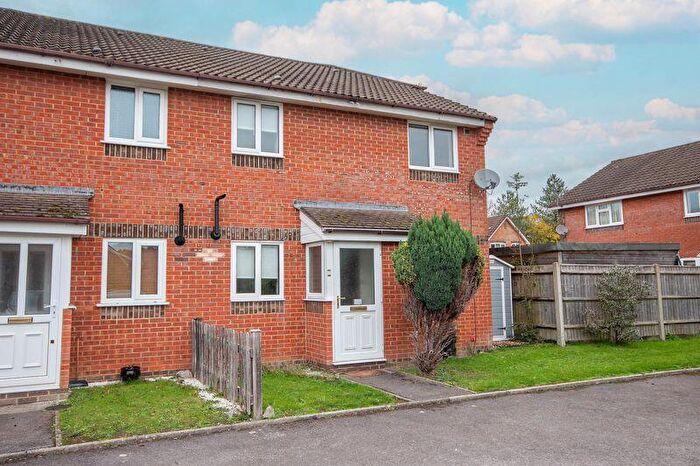
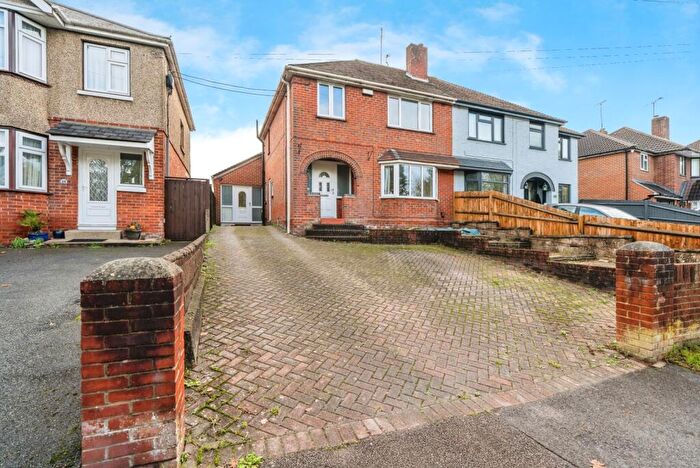
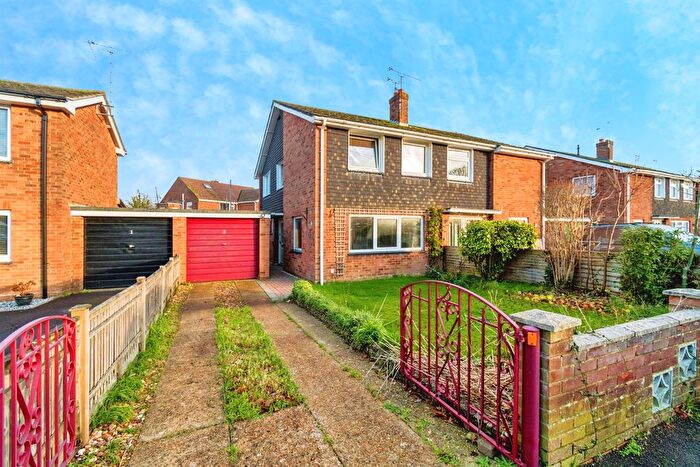
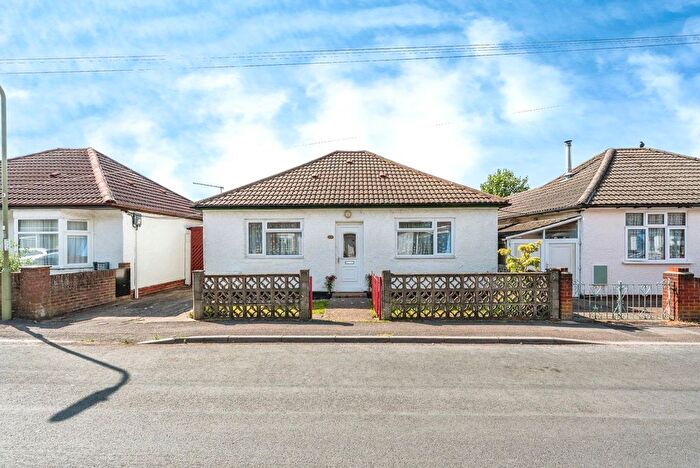
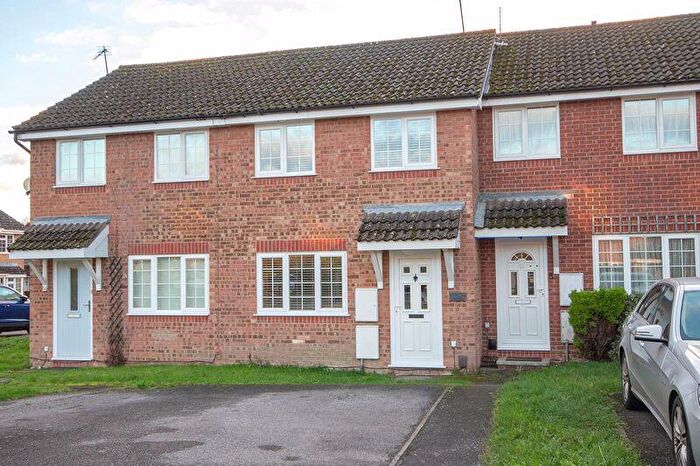
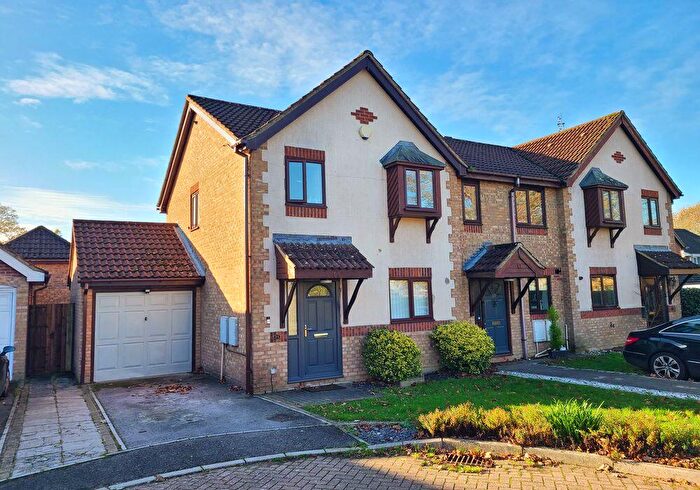
Previously listed properties near SO40 7JL, Kenmore Close
![]()
If you are looking to sell your house, let it out, or receive a property valuation, an expert can help you.
Click the button below to get started.


Price Paid in Kenmore Close, SO40 7JL, Totton South
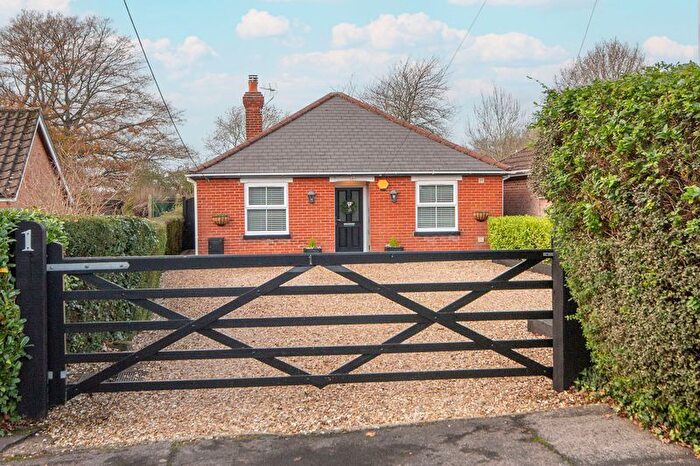
1 Kenmore Close, SO40 7JL, Totton South Southampton
Property 1 has been sold 6 times. The last time it was sold was in 23/09/2020 and the sold price was £431,000.00.
This detached house, sold as a freehold on 23/09/2020, is a 107 sqm detached house with an EPC rating of E.
| Date | Price | Property Type | Tenure | Classification |
|---|---|---|---|---|
| 23/09/2020 | £431,000.00 | Detached House | freehold | Established Building |
| 03/11/2017 | £462,500.00 | Detached House | freehold | Established Building |
| 15/03/2013 | £320,000.00 | Detached House | freehold | Established Building |
| 18/05/2001 | £185,000.00 | Detached House | freehold | Established Building |
| 15/11/1996 | £104,500.00 | Detached House | freehold | Established Building |
| 20/10/1995 | £103,000.00 | Detached House | freehold | Established Building |
4 Kenmore Close, SO40 7JL, Totton South Southampton
Property 4 has been sold 1 time. The last time it was sold was in 23/11/1999 and the sold price was £140,000.00.
This is a Detached House which was sold as a freehold in 23/11/1999
| Date | Price | Property Type | Tenure | Classification |
|---|---|---|---|---|
| 23/11/1999 | £140,000.00 | Detached House | freehold | Established Building |
Transport near SO40 7JL, Kenmore Close

House price paid reports for SO40 7JL, Kenmore Close
Click on the buttons below to see price paid reports by year or property price:
- Price Paid By Year
Property Price Paid in SO40 7JL, Kenmore Close by Year
The average sold property price by year was:
| Year | Average Sold Price | Price Change |
Sold Properties
|
|---|---|---|---|
| 2020 | £431,000 | -7% |
1 Property |
| 2017 | £462,500 | 31% |
1 Property |
| 2013 | £320,000 | 42% |
1 Property |
| 2001 | £185,000 | 24% |
1 Property |
| 1999 | £140,000 | 25% |
1 Property |
| 1996 | £104,500 | 1% |
1 Property |
| 1995 | £103,000 | - |
1 Property |