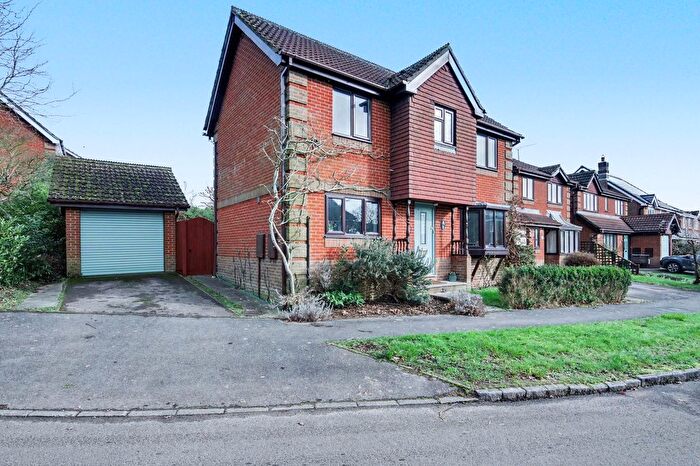
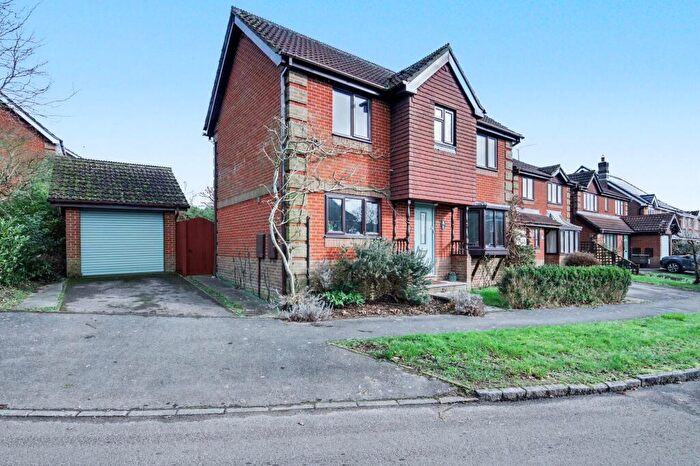
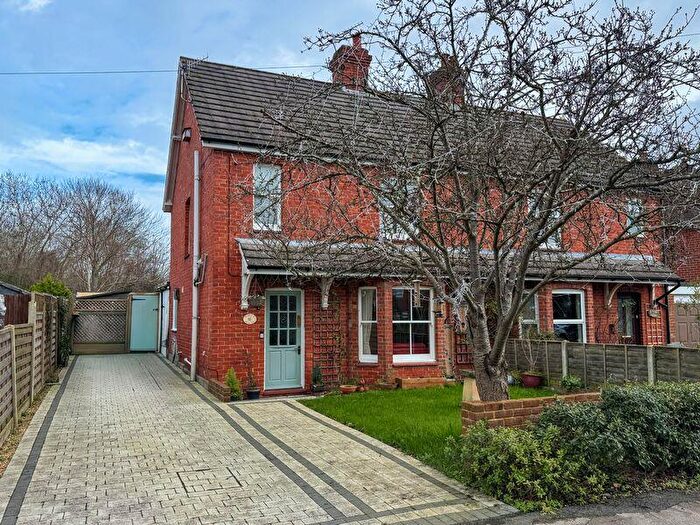
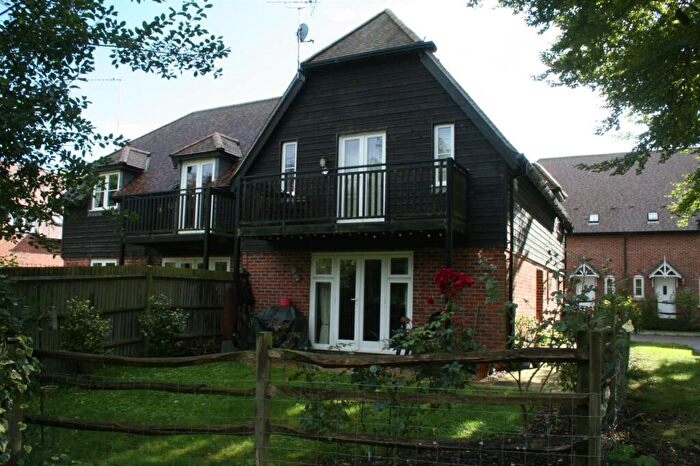
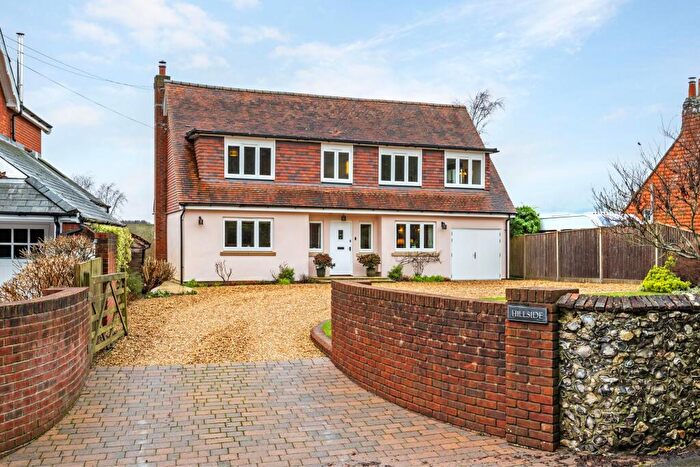
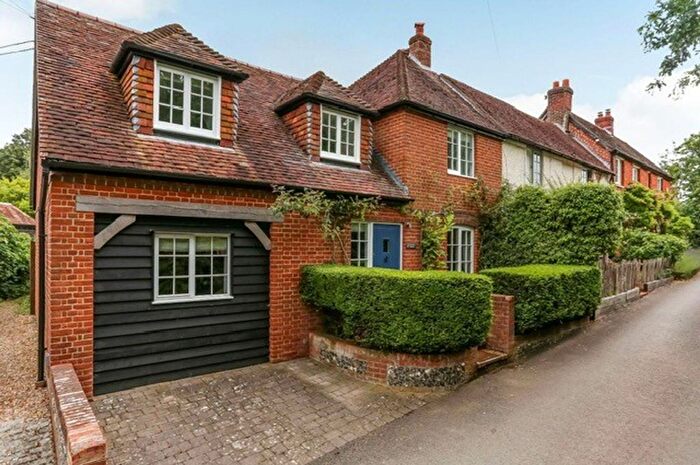
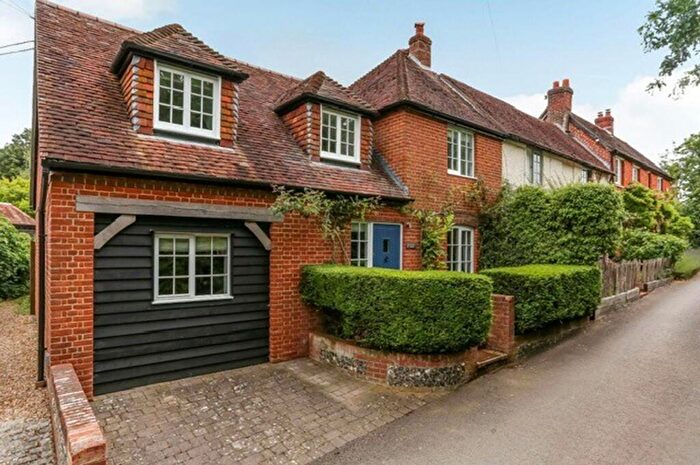
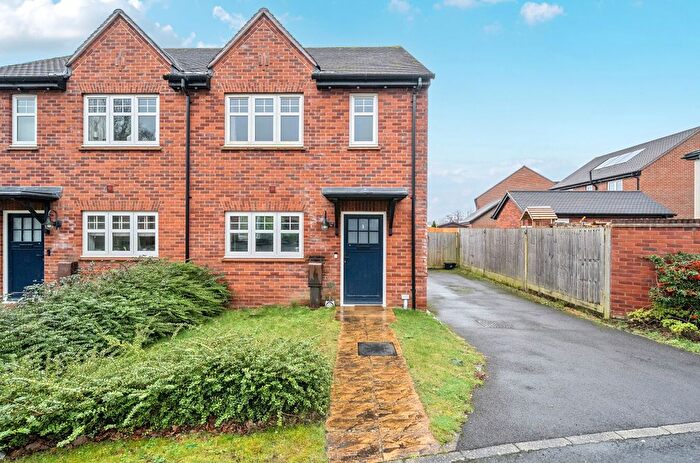
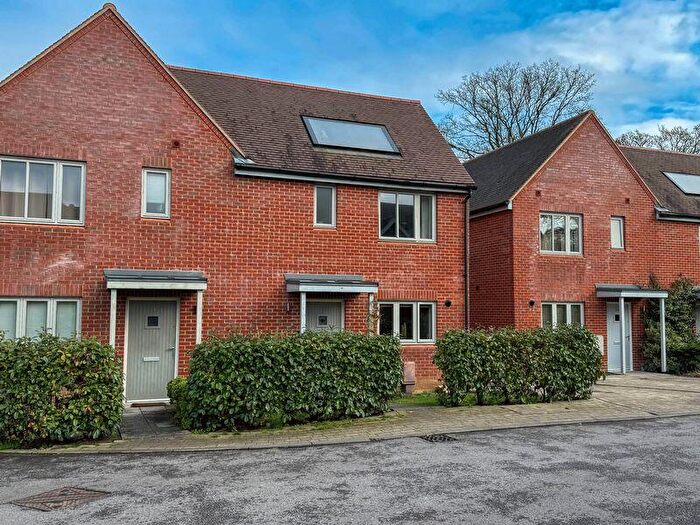
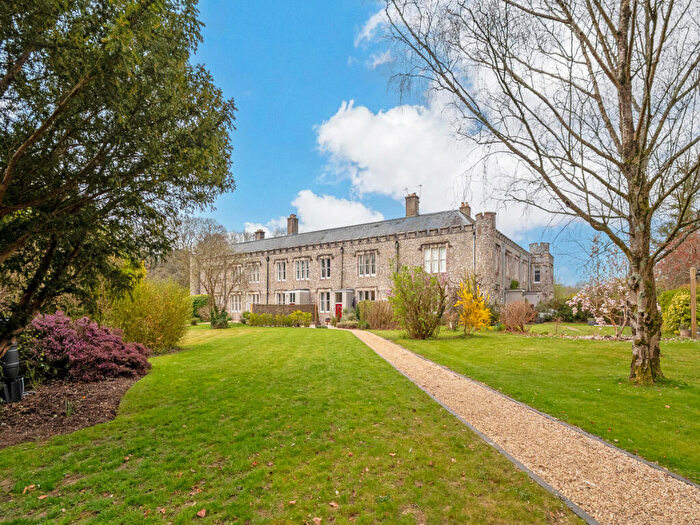
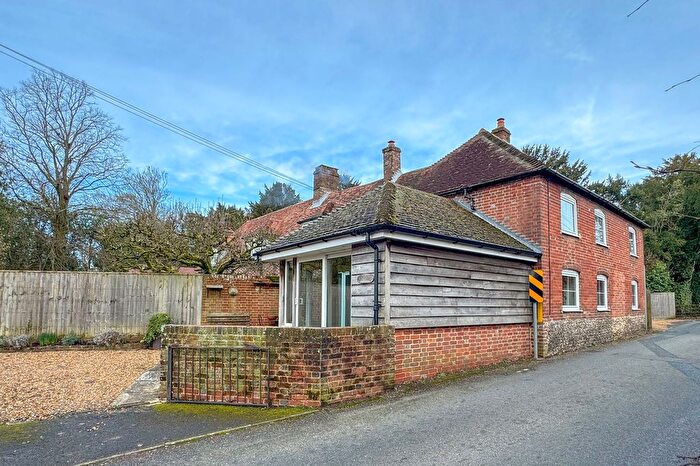
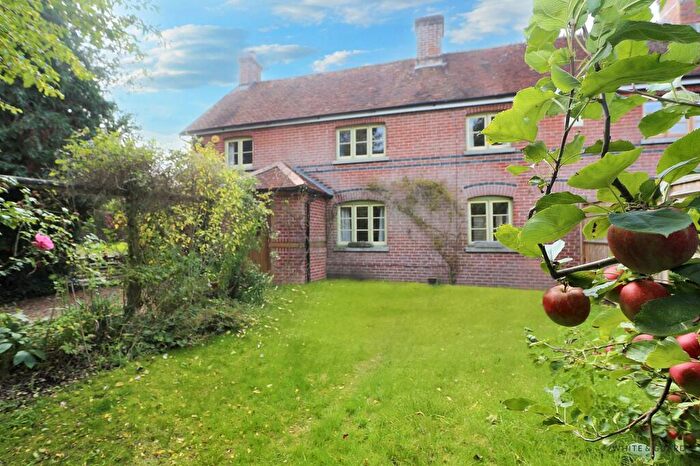
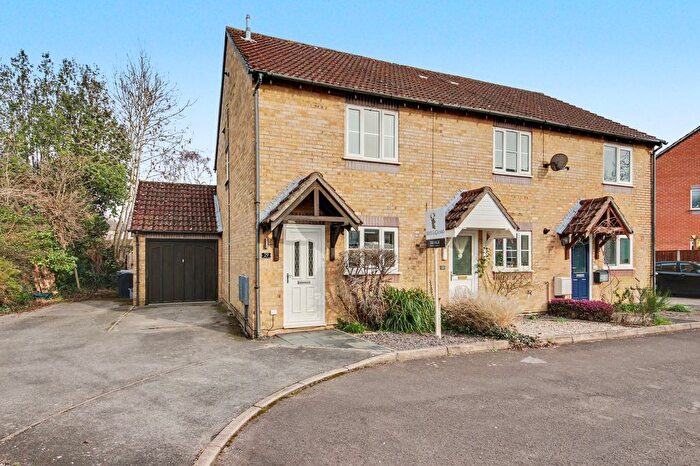
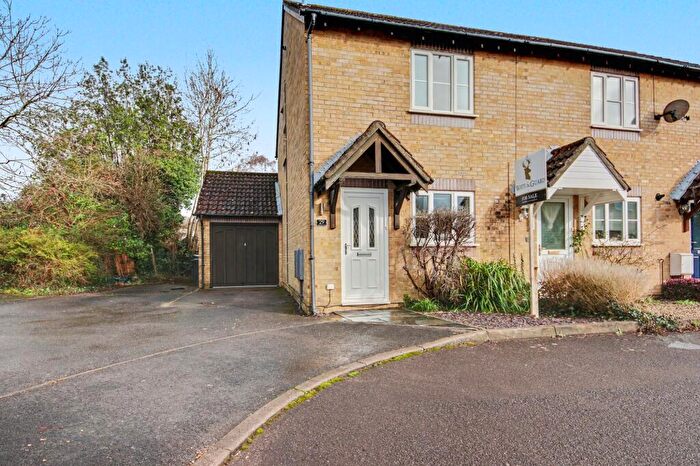
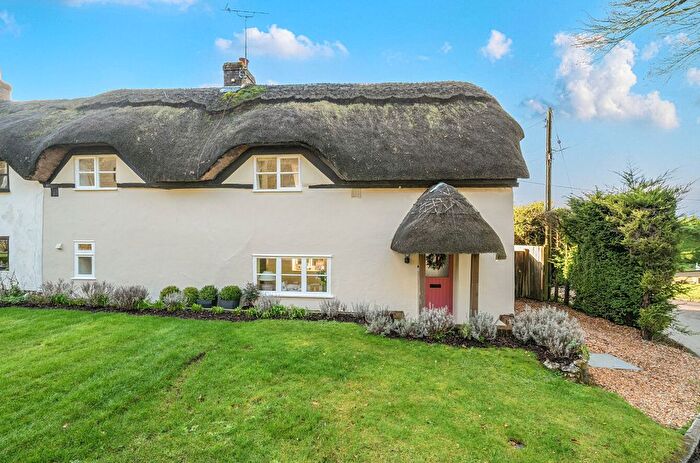
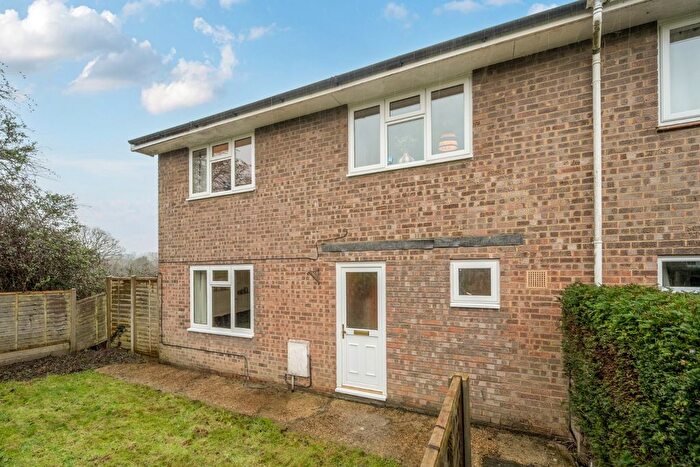
Houses for sale & to rent in Upper Meon Valley, Southampton
House Prices in Upper Meon Valley
Properties in Upper Meon Valley have an average house price of £789,475.00 and had 37 Property Transactions within the last 3 years¹.
Upper Meon Valley is an area in Southampton, Hampshire with 522 households², where the most expensive property was sold for £2,700,000.00.
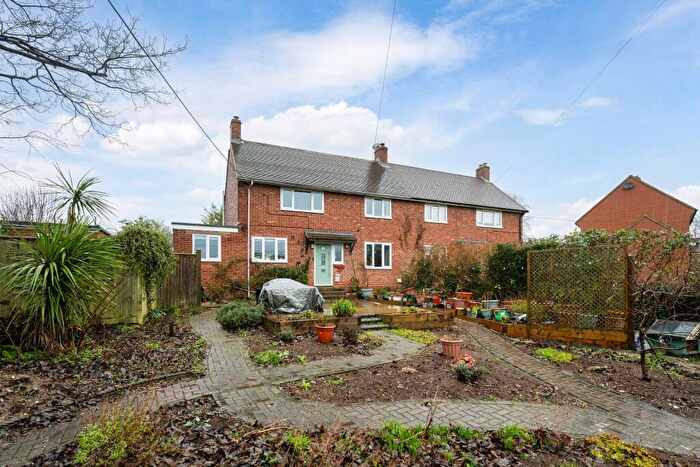
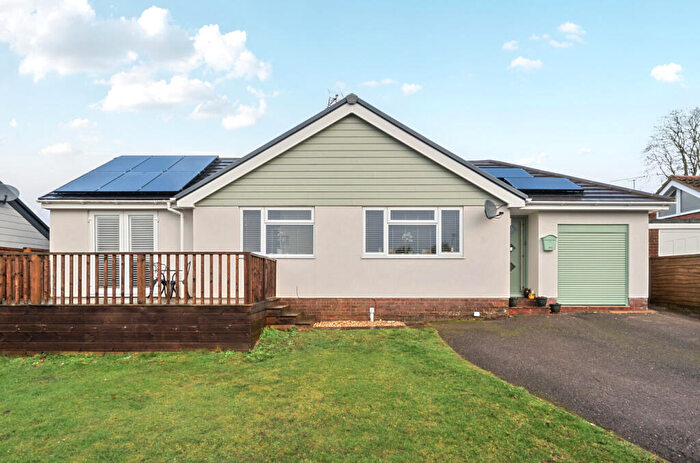
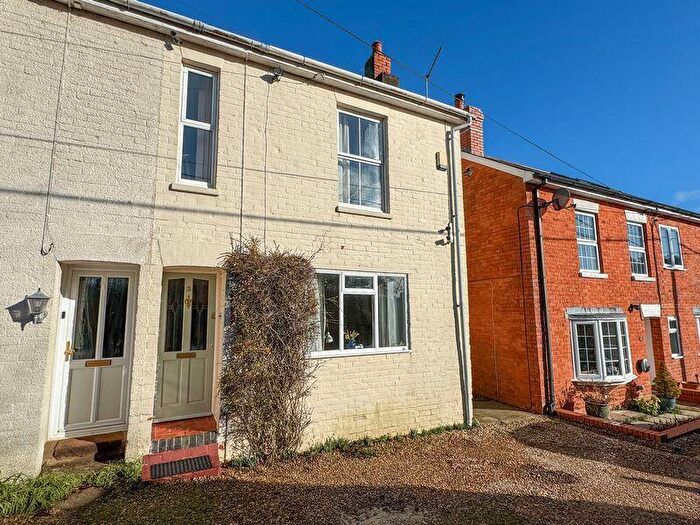
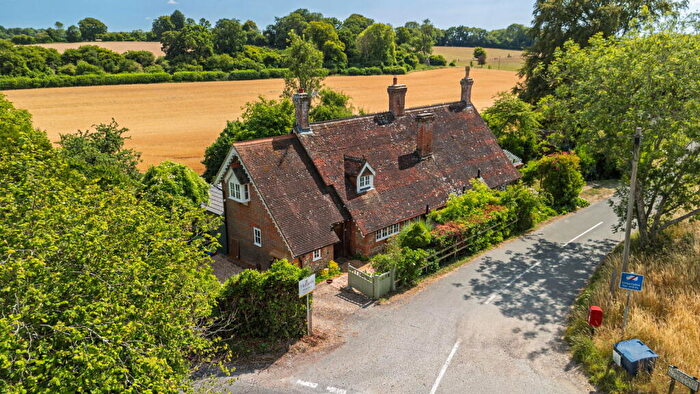
Properties for sale in Upper Meon Valley
Roads and Postcodes in Upper Meon Valley
Navigate through our locations to find the location of your next house in Upper Meon Valley, Southampton for sale or to rent.
| Streets | Postcodes |
|---|---|
| Allens Farm Lane | SO32 3NW |
| Allens Lane | SO32 3NX |
| Baybridge Lane | SO32 1HU |
| Beacon Hill Lane | SO32 3LT SO32 3LW |
| Belmore Lane | SO32 1NQ |
| Belmore Park | SO32 1HQ |
| Bridge Mead | SO32 3DB |
| Brockbridge Road | SO32 3AJ |
| Bucks Head Hill | SO32 3NA |
| Chapel Road | SO32 3NJ |
| Church Lane | SO32 3NE SO32 3NU |
| Corhampton Lane | SO32 3NB |
| Crossways | SO32 3NT |
| De Port Heights | SO32 3DA |
| Frys Lane | SO32 3NL |
| Hayden Lane | SO32 3LF |
| High Barn Cottages | SO32 3LD |
| High Street | SO32 3NH |
| Hoyle Close | SO32 1JQ |
| Lippen Lane | SO32 3LE |
| Lone Barn Lane | SO32 3LN |
| Lower Preshaw Lane | SO32 1QF |
| Millside | SO32 3AG |
| New Road | SO32 3NN |
| Ower Farm Lane | SO32 1HN |
| Oxendown | SO32 3AE |
| Peake New Road | SO32 3LA |
| Pound Cottages | SO32 3NP |
| Preshaw | SO32 1HP |
| Preshaw Estate | SO32 1SU |
| Rectory Lane | SO32 3NF |
| Shavards Lane | SO32 3NR |
| St Andrews Green | SO32 3NG |
| Stakes Lane | SO32 1QA |
| Stocks Lane | SO32 3NQ |
| The Holt | SO32 1HR |
| Torbay Farm | SO32 1QN |
| Warnford Road | SO32 3ND SO32 3NS |
| Watton Lane | SO32 3HA |
| Wheely Down Road | SO32 3LG |
| White Way | SO32 3LU |
| SO32 3LB SO32 3LL SO32 3LQ SO32 1JP SO32 2AL SO32 3LH SO32 3LJ SO32 3LP |
Transport near Upper Meon Valley
-
Botley Station
-
Hedge End Station
-
Shawford Station
-
Eastleigh Station
-
Swanwick Station
-
Winchester Station
-
Fareham Station
-
Petersfield Station
-
Southampton Airport (Parkway) Station
-
Portchester Station
- FAQ
- Price Paid By Year
- Property Type Price
Frequently asked questions about Upper Meon Valley
What is the average price for a property for sale in Upper Meon Valley?
The average price for a property for sale in Upper Meon Valley is £789,475. This amount is 104% higher than the average price in Southampton. There are 947 property listings for sale in Upper Meon Valley.
What streets have the most expensive properties for sale in Upper Meon Valley?
The streets with the most expensive properties for sale in Upper Meon Valley are Beacon Hill Lane at an average of £1,600,000, Rectory Lane at an average of £1,494,166 and Chapel Road at an average of £850,000.
What streets have the most affordable properties for sale in Upper Meon Valley?
The streets with the most affordable properties for sale in Upper Meon Valley are Warnford Road at an average of £349,250, Oxendown at an average of £455,250 and Millside at an average of £520,866.
Which train stations are available in or near Upper Meon Valley?
Some of the train stations available in or near Upper Meon Valley are Botley, Hedge End and Shawford.
Property Price Paid in Upper Meon Valley by Year
The average sold property price by year was:
| Year | Average Sold Price | Price Change |
Sold Properties
|
|---|---|---|---|
| 2025 | £827,791 | 16% |
12 Properties |
| 2024 | £695,750 | -25% |
14 Properties |
| 2023 | £866,963 | 1% |
11 Properties |
| 2022 | £859,375 | 18% |
16 Properties |
| 2021 | £701,177 | -71% |
29 Properties |
| 2020 | £1,199,482 | 54% |
14 Properties |
| 2019 | £557,747 | 3% |
24 Properties |
| 2018 | £538,857 | -28% |
32 Properties |
| 2017 | £692,155 | 12% |
23 Properties |
| 2016 | £606,448 | 4% |
9 Properties |
| 2015 | £582,275 | -16% |
20 Properties |
| 2014 | £677,250 | 12% |
18 Properties |
| 2013 | £592,802 | 31% |
18 Properties |
| 2012 | £410,153 | -32% |
13 Properties |
| 2011 | £540,013 | -16% |
12 Properties |
| 2010 | £628,416 | 48% |
12 Properties |
| 2009 | £328,285 | -21% |
21 Properties |
| 2008 | £397,235 | -9% |
17 Properties |
| 2007 | £432,386 | -1% |
22 Properties |
| 2006 | £436,650 | -6% |
20 Properties |
| 2005 | £462,981 | 6% |
16 Properties |
| 2004 | £434,294 | 20% |
28 Properties |
| 2003 | £348,993 | 1% |
16 Properties |
| 2002 | £345,699 | 21% |
18 Properties |
| 2001 | £273,259 | -9% |
13 Properties |
| 2000 | £296,820 | 18% |
10 Properties |
| 1999 | £242,529 | -5% |
17 Properties |
| 1998 | £255,452 | 21% |
20 Properties |
| 1997 | £202,529 | -7% |
17 Properties |
| 1996 | £216,466 | 25% |
12 Properties |
| 1995 | £162,490 | - |
16 Properties |
Property Price per Property Type in Upper Meon Valley
Here you can find historic sold price data in order to help with your property search.
The average Property Paid Price for specific property types in the last three years are:
| Property Type | Average Sold Price | Sold Properties |
|---|---|---|
| Semi Detached House | £548,054.00 | 11 Semi Detached Houses |
| Detached House | £1,000,225.00 | 20 Detached Houses |
| Terraced House | £529,583.00 | 6 Terraced Houses |

