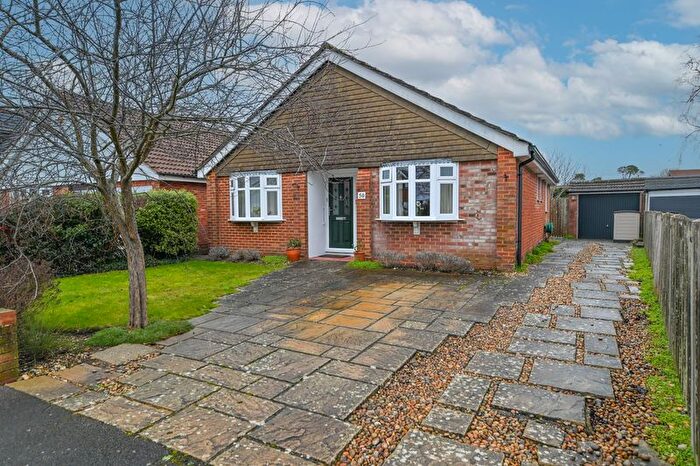
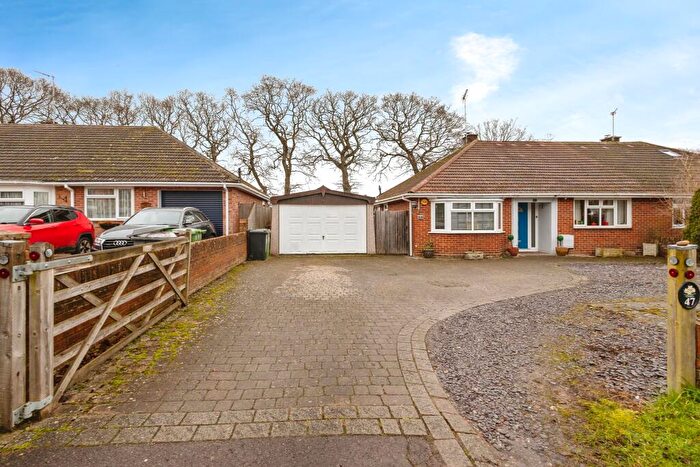
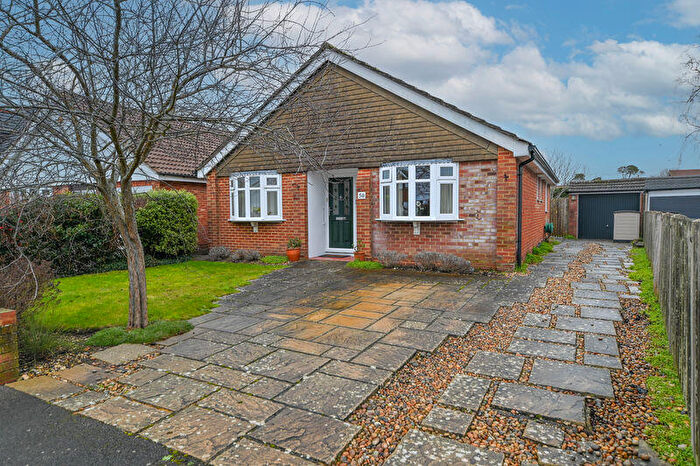
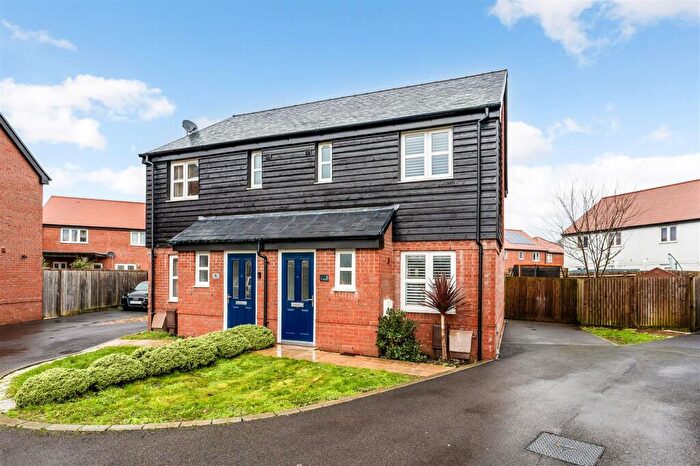
Houses for sale & to rent in Droxford, Soberton And Hambledon, Waterlooville
House Prices in Droxford, Soberton And Hambledon
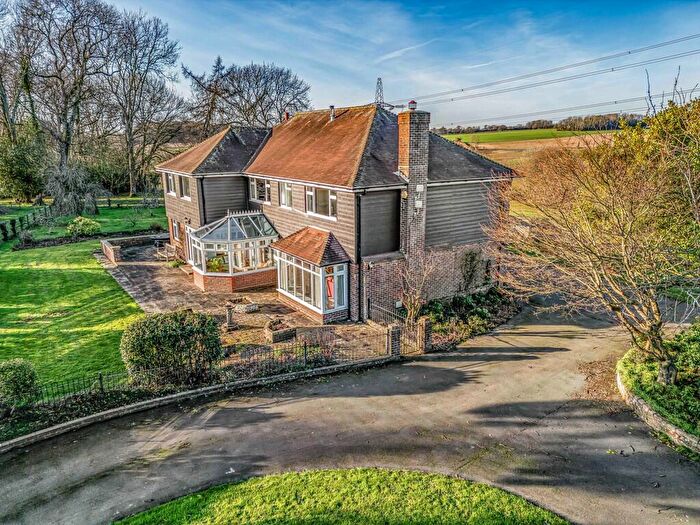
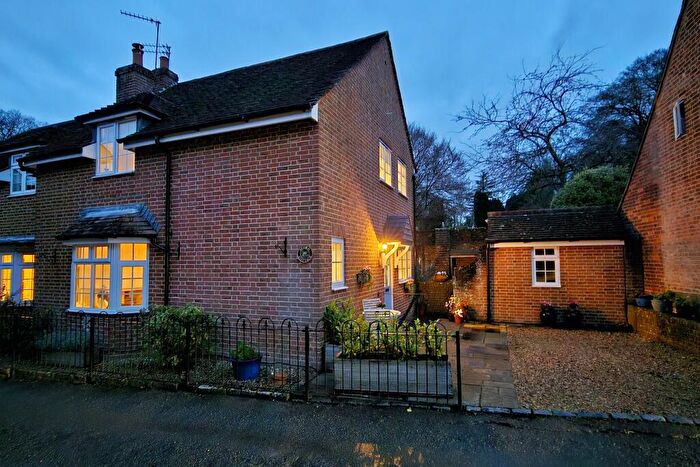
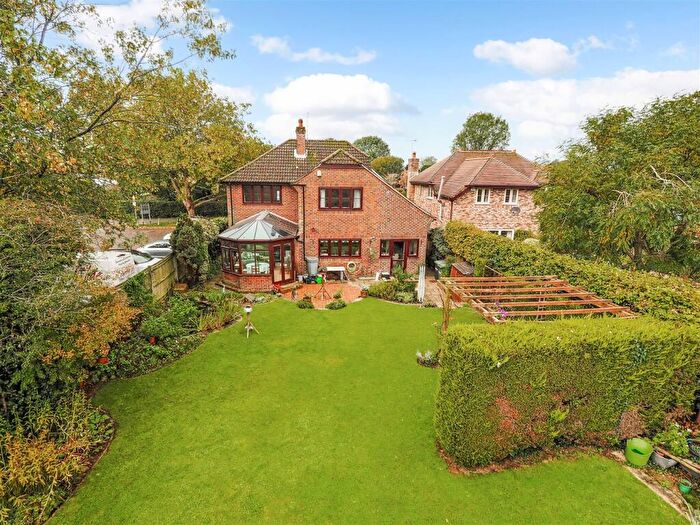
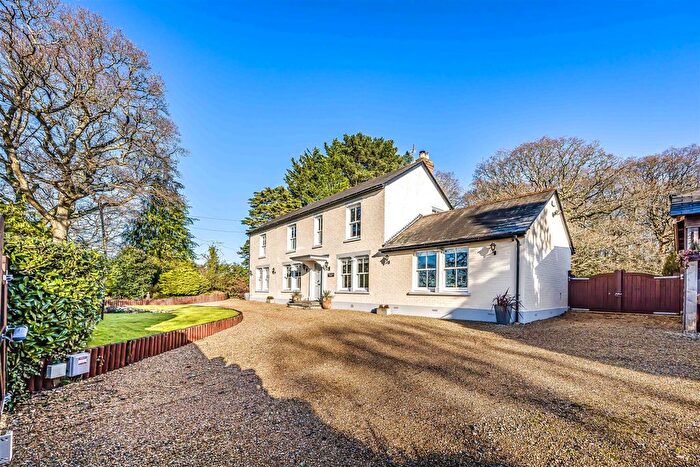
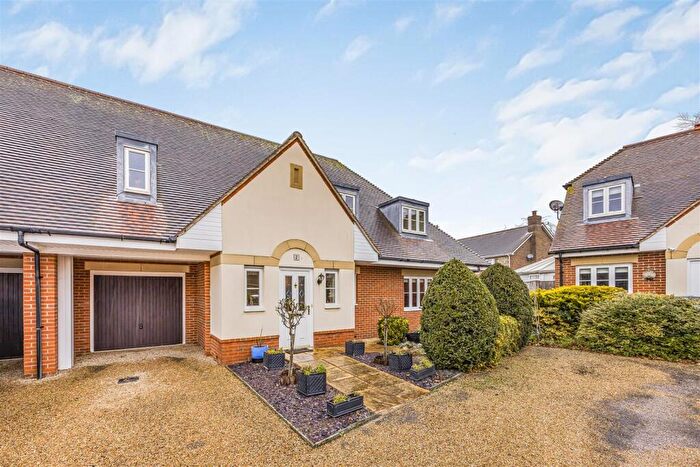
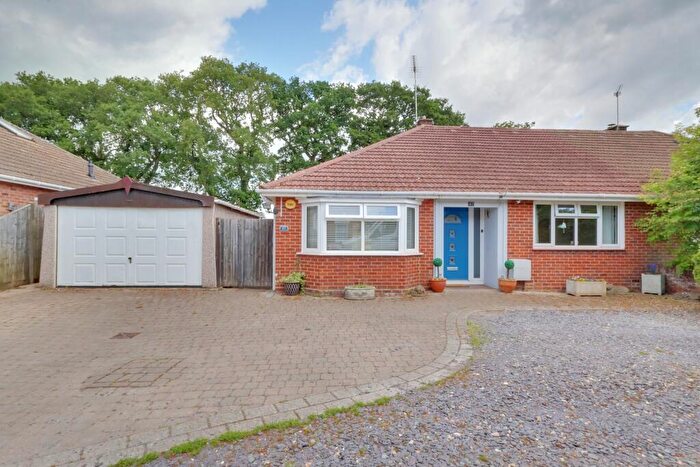
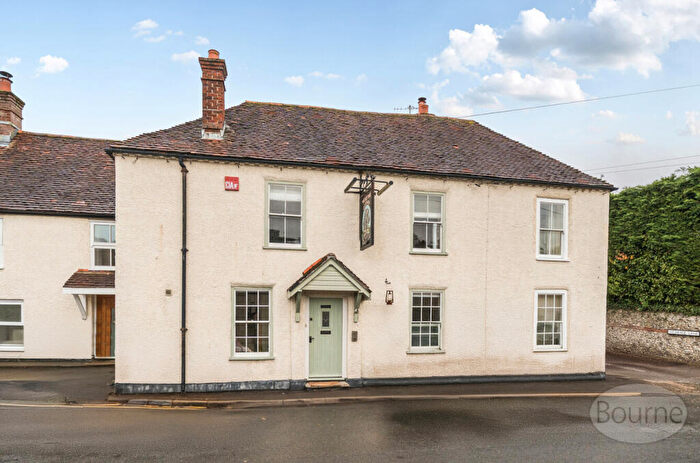
Properties in Droxford, Soberton And Hambledon have an average house price of £766,693.00 and had 31 Property Transactions within the last 3 years¹.
Droxford, Soberton And Hambledon is an area in Waterlooville, Hampshire with 374 households², where the most expensive property was sold for £3,450,000.00.
Properties for sale in Droxford, Soberton And Hambledon
Roads and Postcodes in Droxford, Soberton And Hambledon
Navigate through our locations to find the location of your next house in Droxford, Soberton And Hambledon, Waterlooville for sale or to rent.
| Streets | Postcodes |
|---|---|
| Back Lane | PO7 4AB |
| Brook Lane | PO7 4TF |
| Cams Hill Lane | PO7 4RQ PO7 4SP |
| Chidden | PO7 4TD PO7 4TE |
| Chidden Holt | PO7 4TG |
| Church Lane | PO7 4RT |
| Coachmans Halt | PO7 4RN |
| East Hoe Road | PO7 4SZ |
| East Street | PO7 4RJ PO7 4RL PO7 4RX PO7 4RY PO7 4RZ PO7 4SA PO7 4SB |
| Green Lane | PO7 4SS PO7 4SX PO7 4TB |
| High Street | PO7 4RS |
| Menslands Lane | PO7 4SR |
| New Villas | PO7 4SY |
| Old Barn Crescent | PO7 4SW |
| Old Mill Lane | PO8 0SE |
| Rushmere Lane | PO7 4SG |
| Speltham Hill | PO7 4RU PO7 4SE |
| Stewarts Green | PO7 4SU |
| The Maltings | PO7 4AE |
| The Terrace | PO7 4ST |
| Vicarage Lane | PO7 4RP |
| West Street | PO7 4QL PO7 4RW PO7 4SN |
Transport near Droxford, Soberton And Hambledon
-
Rowland's Castle Station
-
Portchester Station
-
Cosham Station
-
Bedhampton Station
-
Havant Station
-
Hilsea Station
-
Fareham Station
-
Warblington Station
-
Petersfield Station
-
Botley Station
- FAQ
- Price Paid By Year
- Property Type Price
Frequently asked questions about Droxford, Soberton And Hambledon
What is the average price for a property for sale in Droxford, Soberton And Hambledon?
The average price for a property for sale in Droxford, Soberton And Hambledon is £766,693. This amount is 108% higher than the average price in Waterlooville. There are 518 property listings for sale in Droxford, Soberton And Hambledon.
What streets have the most expensive properties for sale in Droxford, Soberton And Hambledon?
The streets with the most expensive properties for sale in Droxford, Soberton And Hambledon are Church Lane at an average of £1,375,000, East Street at an average of £945,625 and High Street at an average of £900,000.
What streets have the most affordable properties for sale in Droxford, Soberton And Hambledon?
The streets with the most affordable properties for sale in Droxford, Soberton And Hambledon are Speltham Hill at an average of £268,000, The Terrace at an average of £270,000 and Old Barn Crescent at an average of £325,000.
Which train stations are available in or near Droxford, Soberton And Hambledon?
Some of the train stations available in or near Droxford, Soberton And Hambledon are Rowland's Castle, Portchester and Cosham.
Property Price Paid in Droxford, Soberton And Hambledon by Year
The average sold property price by year was:
| Year | Average Sold Price | Price Change |
Sold Properties
|
|---|---|---|---|
| 2025 | £838,714 | -1% |
7 Properties |
| 2024 | £847,961 | 26% |
13 Properties |
| 2023 | £624,818 | 8% |
11 Properties |
| 2022 | £576,690 | -28% |
10 Properties |
| 2021 | £739,271 | 20% |
14 Properties |
| 2020 | £591,008 | 22% |
14 Properties |
| 2019 | £458,250 | -135% |
9 Properties |
| 2018 | £1,078,650 | 8% |
10 Properties |
| 2017 | £996,550 | 53% |
10 Properties |
| 2016 | £472,083 | 5% |
12 Properties |
| 2015 | £447,710 | -11% |
19 Properties |
| 2014 | £496,172 | 29% |
9 Properties |
| 2013 | £350,478 | -19% |
14 Properties |
| 2012 | £418,041 | 12% |
24 Properties |
| 2011 | £369,481 | 14% |
21 Properties |
| 2010 | £317,923 | -19% |
13 Properties |
| 2009 | £379,624 | -22% |
8 Properties |
| 2008 | £463,163 | 2% |
15 Properties |
| 2007 | £452,028 | -16% |
16 Properties |
| 2006 | £525,475 | -10% |
20 Properties |
| 2005 | £575,949 | 7% |
20 Properties |
| 2004 | £532,978 | 45% |
22 Properties |
| 2003 | £294,080 | -21% |
10 Properties |
| 2002 | £354,847 | 37% |
23 Properties |
| 2001 | £222,422 | -19% |
20 Properties |
| 2000 | £265,420 | 24% |
22 Properties |
| 1999 | £201,520 | 9% |
17 Properties |
| 1998 | £183,770 | -5% |
12 Properties |
| 1997 | £193,545 | 22% |
11 Properties |
| 1996 | £151,858 | 1% |
12 Properties |
| 1995 | £149,785 | - |
13 Properties |
Property Price per Property Type in Droxford, Soberton And Hambledon
Here you can find historic sold price data in order to help with your property search.
The average Property Paid Price for specific property types in the last three years are:
| Property Type | Average Sold Price | Sold Properties |
|---|---|---|
| Semi Detached House | £597,875.00 | 8 Semi Detached Houses |
| Detached House | £1,167,153.00 | 13 Detached Houses |
| Terraced House | £427,357.00 | 7 Terraced Houses |
| Flat | £273,333.00 | 3 Flats |

