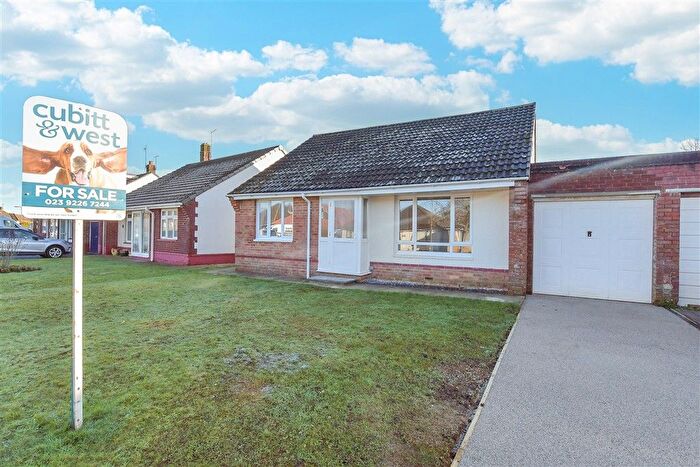
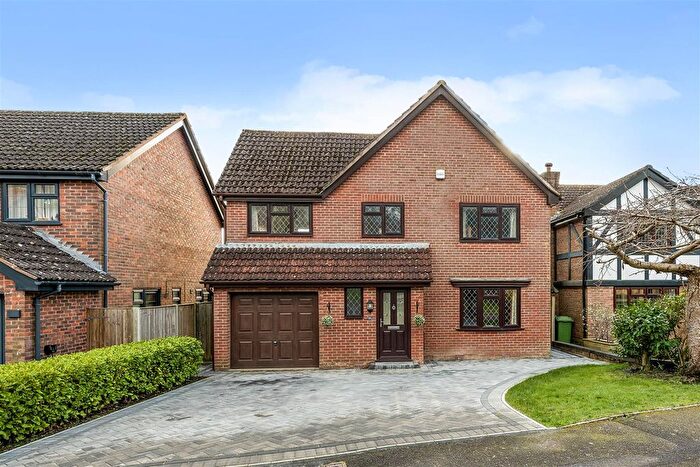
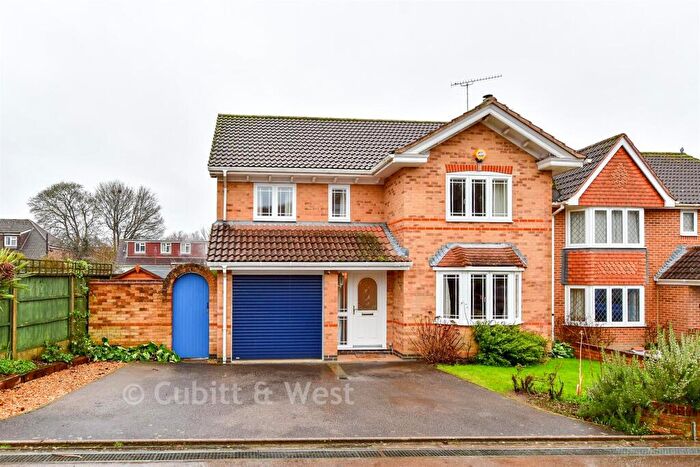
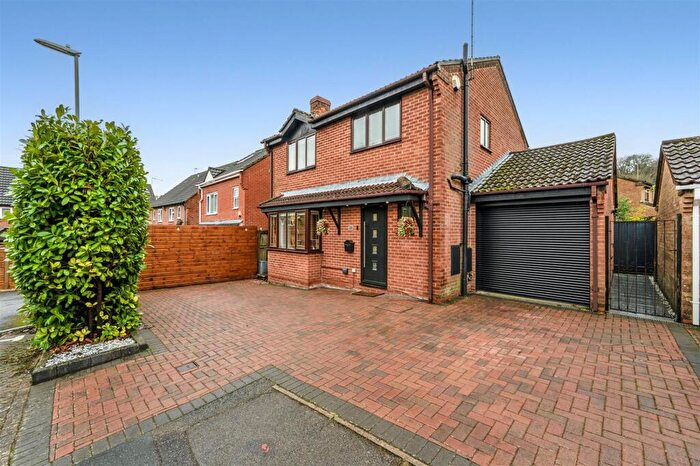
Houses for sale & to rent in Horndean Catherington And Lovedean, Waterlooville
House Prices in Horndean Catherington And Lovedean
Properties in Horndean Catherington And Lovedean have an average house price of £515,592.00 and had 114 Property Transactions within the last 3 years¹.
Horndean Catherington And Lovedean is an area in Waterlooville, Hampshire with 896 households², where the most expensive property was sold for £1,200,000.00.
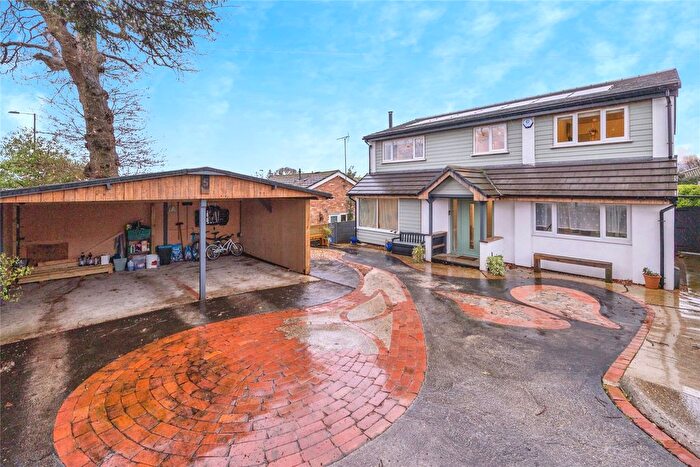
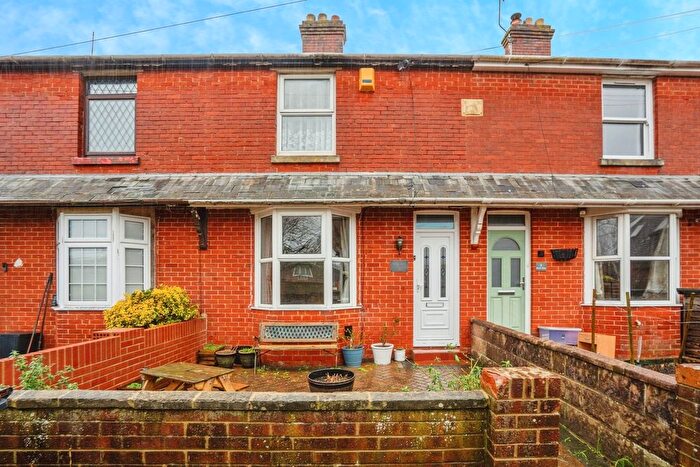
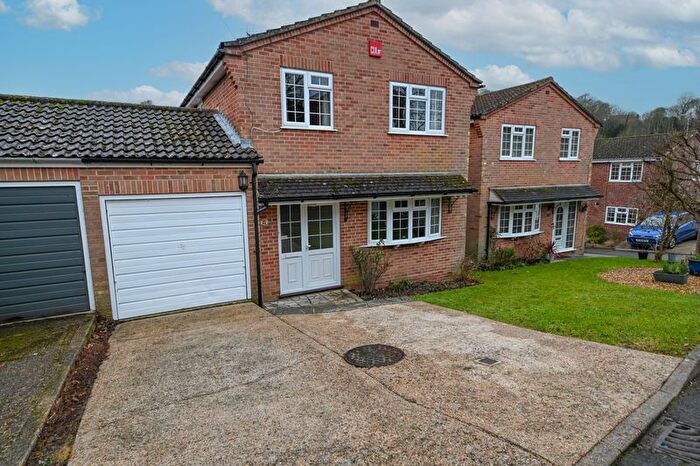
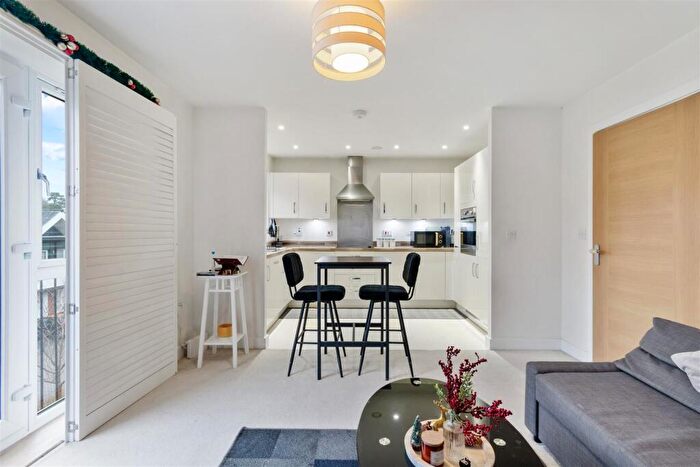
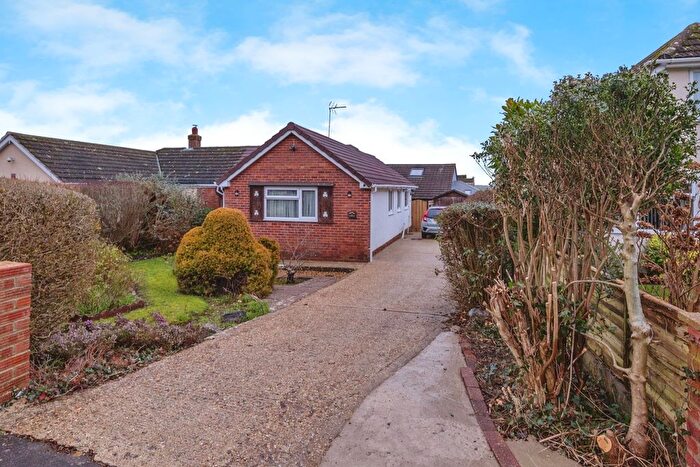
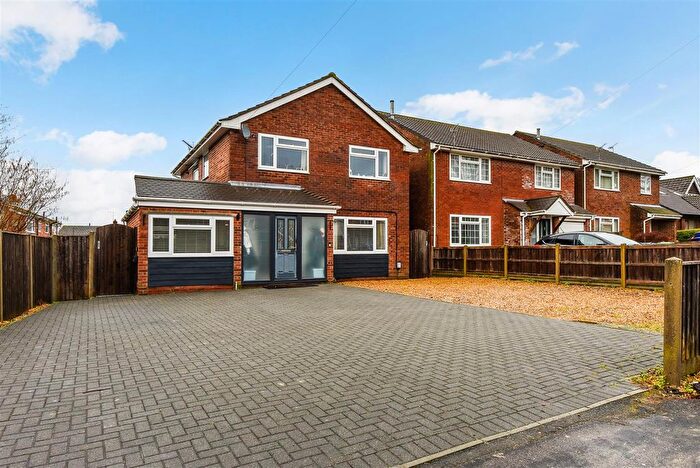
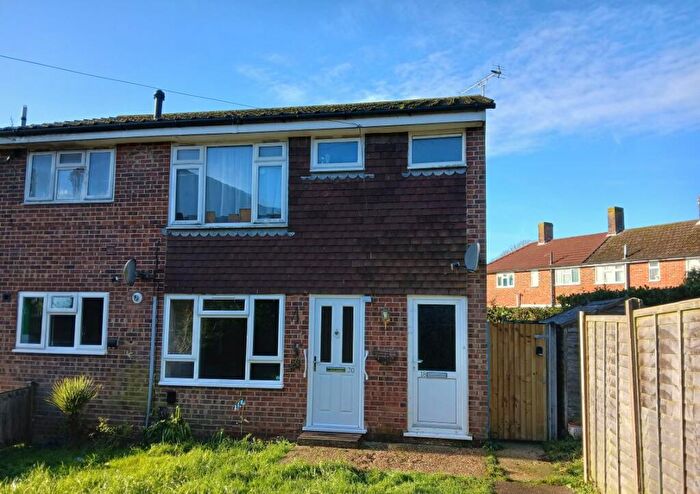
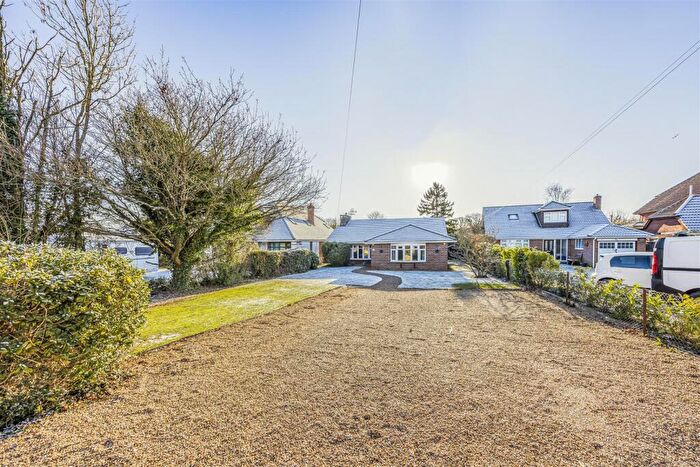
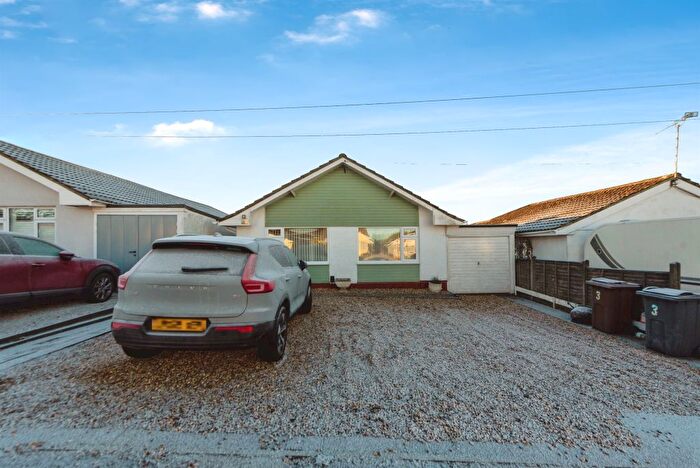
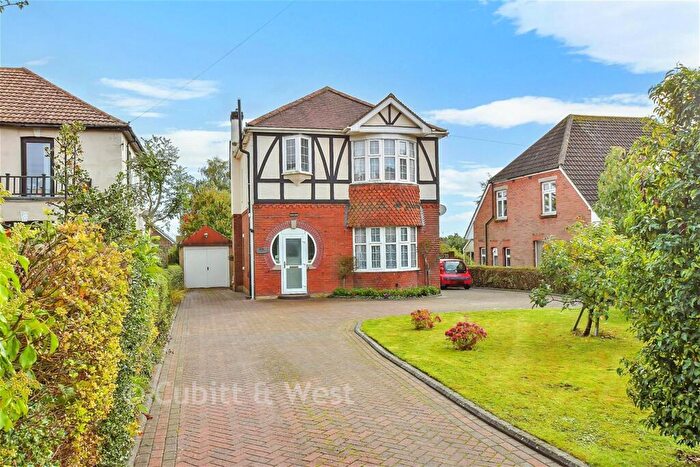
Properties for sale in Horndean Catherington And Lovedean
Roads and Postcodes in Horndean Catherington And Lovedean
Navigate through our locations to find the location of your next house in Horndean Catherington And Lovedean, Waterlooville for sale or to rent.
| Streets | Postcodes |
|---|---|
| Anmore Lane | PO7 6HN |
| Ashley Close | PO8 9RQ |
| Broadway Lane | PO8 0SJ PO8 0SS |
| Catherine Gardens | PO8 9WE |
| Catherington Lane | PO8 0TB PO8 0TD PO8 0TE PO8 0TH PO8 0TU |
| Coldhill Lane | PO8 9SB |
| Comfrey Close | PO8 0JQ |
| Coombs Close | PO8 0HE |
| Day Lane | PO8 0SH |
| Down Road | PO8 0EU |
| Downhouse Road | PO8 0TX PO8 0TY PO8 0TZ |
| Downwood Way | PO8 0EY |
| Eastland Gate | PO8 0SR |
| Elmeswelle Road | PO8 9RR PO8 9RS |
| Eperston Road | PO8 9SA |
| Five Heads Road | PO8 9NJ |
| Frogmore Lane | PO8 9RD |
| Glamorgan Road | PO8 0TR PO8 0TS |
| Godwin Crescent | PO8 0YA |
| James Copse Road | PO8 9RG |
| Lith Avenue | PO8 0HA |
| Lith Crescent | PO8 0XR |
| Lith Lane | PO8 0EZ |
| London Road | PO8 0BP PO8 0HQ |
| Lovage Way | PO8 0JG |
| Lovedean Lane | PO8 9RT PO8 9RX PO8 9RY PO8 9SD PO8 9SF |
| Loxwood Road | PO8 9TT PO8 9TU PO8 9TY |
| Mundays Row | PO8 0HF |
| New Road | PO8 9RU |
| Old Lane | PO8 0TJ |
| Pentere Road | PO8 9HG |
| Roads Hill | PO8 0TG |
| Sheppard Close | PO8 9HQ |
| South Road | PO8 0EP |
| Southdown Road | PO8 0ET |
| The Curve | PO8 9SE |
| The Vale | PO8 0HD |
| Tilford Road | PO8 9SX |
| White Dirt Lane | PO8 0TL PO8 0TT PO8 0TW |
| Witley Road | PO8 9TZ |
| Woodland View | PO8 9TR |
| Wrexham Grove | PO8 0TP |
| Yoells Lane | PO8 9SG PO8 9SR |
| PO8 0QW PO8 0SF |
Transport near Horndean Catherington And Lovedean
- FAQ
- Price Paid By Year
- Property Type Price
Frequently asked questions about Horndean Catherington And Lovedean
What is the average price for a property for sale in Horndean Catherington And Lovedean?
The average price for a property for sale in Horndean Catherington And Lovedean is £515,592. This amount is 40% higher than the average price in Waterlooville. There are 2,734 property listings for sale in Horndean Catherington And Lovedean.
What streets have the most expensive properties for sale in Horndean Catherington And Lovedean?
The streets with the most expensive properties for sale in Horndean Catherington And Lovedean are White Dirt Lane at an average of £869,800, Downhouse Road at an average of £717,500 and Southdown Road at an average of £677,416.
What streets have the most affordable properties for sale in Horndean Catherington And Lovedean?
The streets with the most affordable properties for sale in Horndean Catherington And Lovedean are Sheppard Close at an average of £302,916, Mundays Row at an average of £310,000 and Down Road at an average of £315,000.
Which train stations are available in or near Horndean Catherington And Lovedean?
Some of the train stations available in or near Horndean Catherington And Lovedean are Rowland's Castle, Bedhampton and Havant.
Property Price Paid in Horndean Catherington And Lovedean by Year
The average sold property price by year was:
| Year | Average Sold Price | Price Change |
Sold Properties
|
|---|---|---|---|
| 2025 | £516,326 | 16% |
23 Properties |
| 2024 | £431,145 | -23% |
24 Properties |
| 2023 | £531,410 | -5% |
28 Properties |
| 2022 | £555,769 | 19% |
39 Properties |
| 2021 | £447,807 | -4% |
39 Properties |
| 2020 | £463,977 | 0,1% |
24 Properties |
| 2019 | £463,556 | 13% |
40 Properties |
| 2018 | £402,525 | -15% |
38 Properties |
| 2017 | £462,320 | 20% |
39 Properties |
| 2016 | £367,718 | 1% |
42 Properties |
| 2015 | £363,161 | 3% |
46 Properties |
| 2014 | £353,889 | 8% |
49 Properties |
| 2013 | £325,396 | 7% |
29 Properties |
| 2012 | £304,181 | 7% |
30 Properties |
| 2011 | £284,080 | -10% |
25 Properties |
| 2010 | £313,723 | 12% |
45 Properties |
| 2009 | £276,730 | -20% |
26 Properties |
| 2008 | £332,904 | 10% |
20 Properties |
| 2007 | £300,921 | 9% |
49 Properties |
| 2006 | £274,355 | -0,4% |
49 Properties |
| 2005 | £275,378 | 7% |
42 Properties |
| 2004 | £256,778 | 13% |
60 Properties |
| 2003 | £224,403 | 9% |
40 Properties |
| 2002 | £204,165 | 2% |
60 Properties |
| 2001 | £199,924 | 27% |
47 Properties |
| 2000 | £145,050 | 0,1% |
51 Properties |
| 1999 | £144,843 | 14% |
68 Properties |
| 1998 | £124,882 | 18% |
53 Properties |
| 1997 | £102,160 | 13% |
38 Properties |
| 1996 | £89,117 | 5% |
48 Properties |
| 1995 | £84,301 | - |
32 Properties |
Property Price per Property Type in Horndean Catherington And Lovedean
Here you can find historic sold price data in order to help with your property search.
The average Property Paid Price for specific property types in the last three years are:
| Property Type | Average Sold Price | Sold Properties |
|---|---|---|
| Semi Detached House | £415,730.00 | 26 Semi Detached Houses |
| Detached House | £600,070.00 | 71 Detached Houses |
| Terraced House | £315,500.00 | 17 Terraced Houses |

