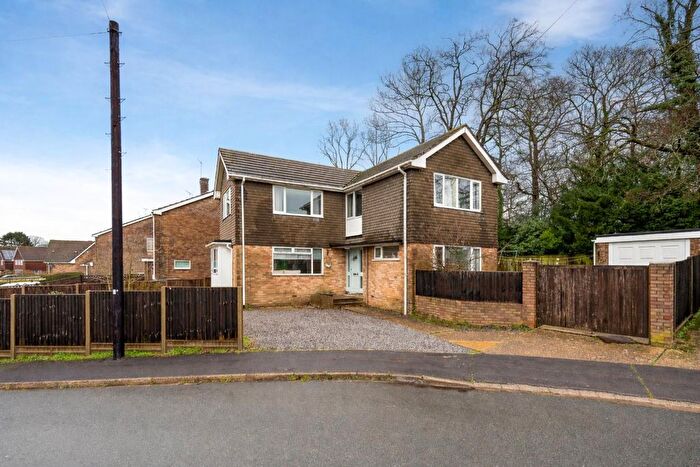
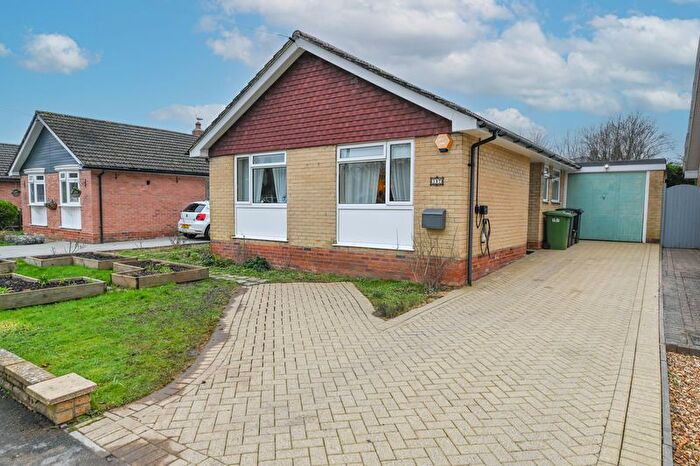
Houses for sale & to rent in Horndean Hazleton And Blendworth, Waterlooville
House Prices in Horndean Hazleton And Blendworth
Properties in Horndean Hazleton And Blendworth have an average house price of £434,655.00 and had 110 Property Transactions within the last 3 years¹.
Horndean Hazleton And Blendworth is an area in Waterlooville, Hampshire with 1,002 households², where the most expensive property was sold for £3,100,000.00.
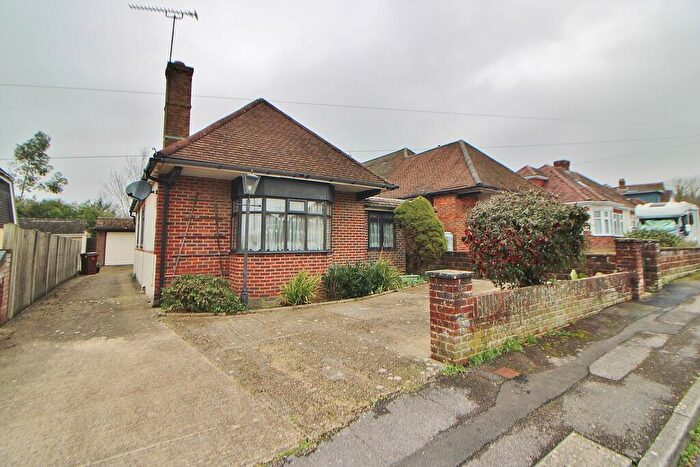
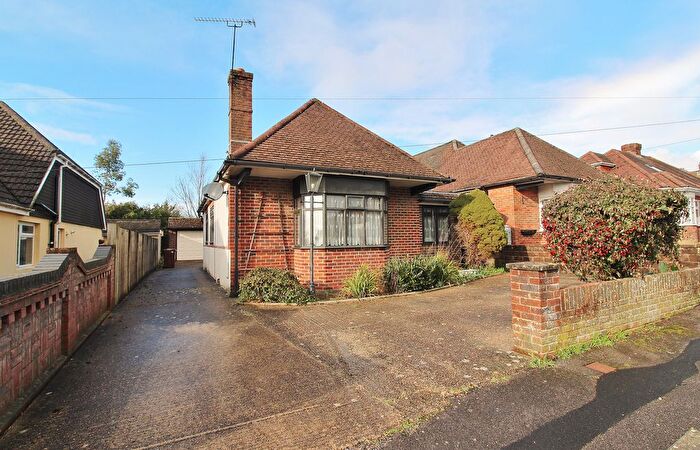
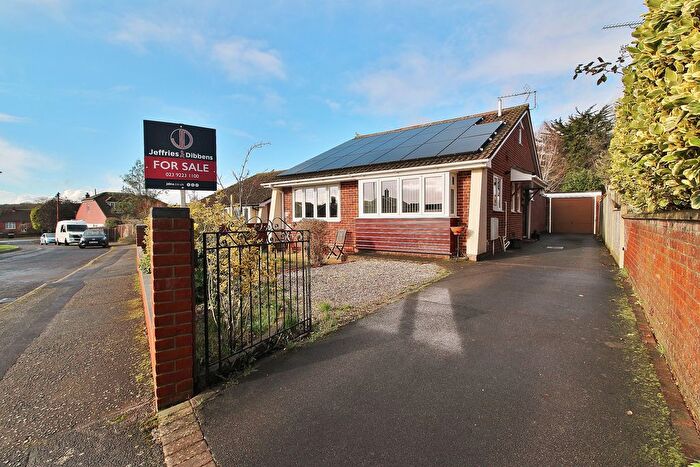
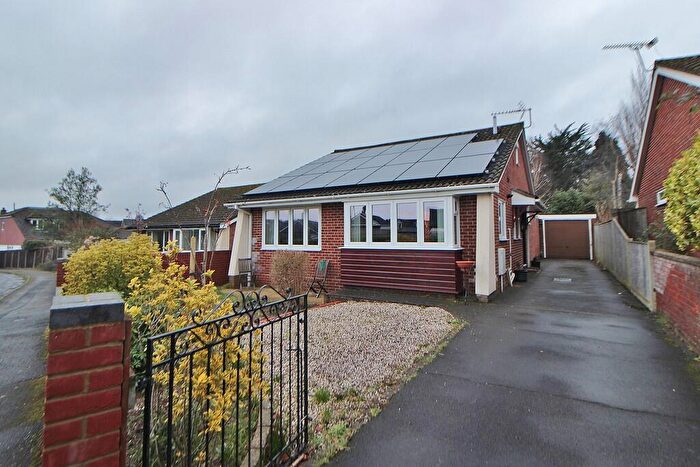
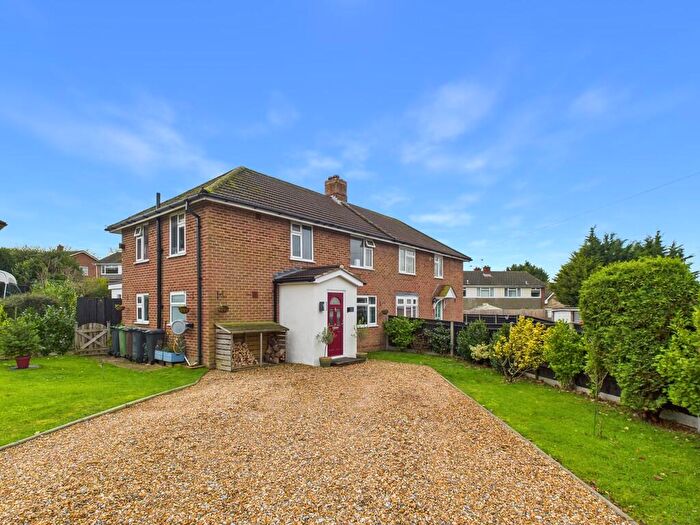
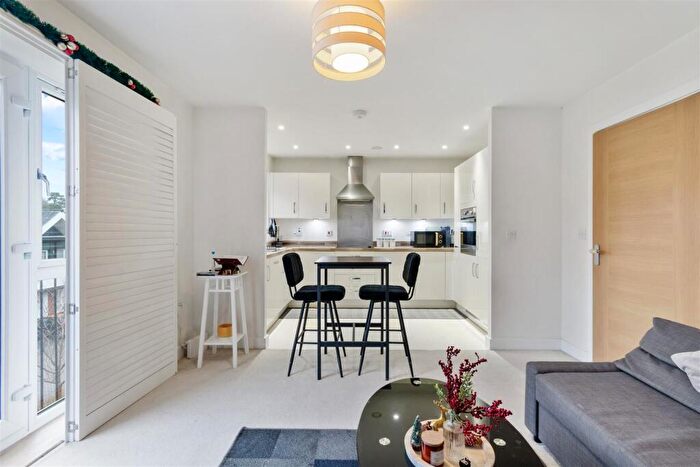
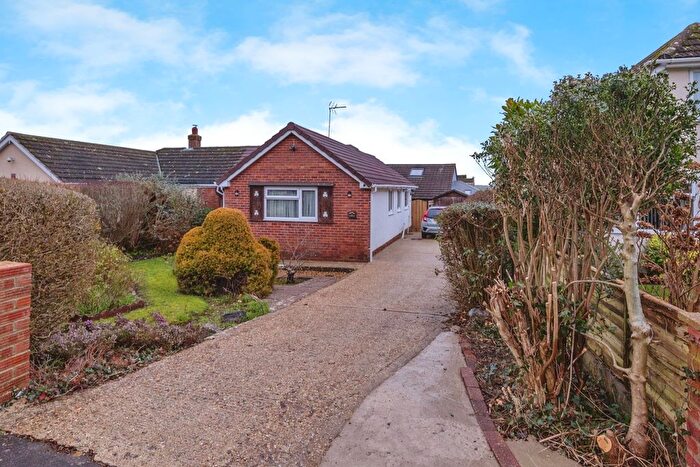
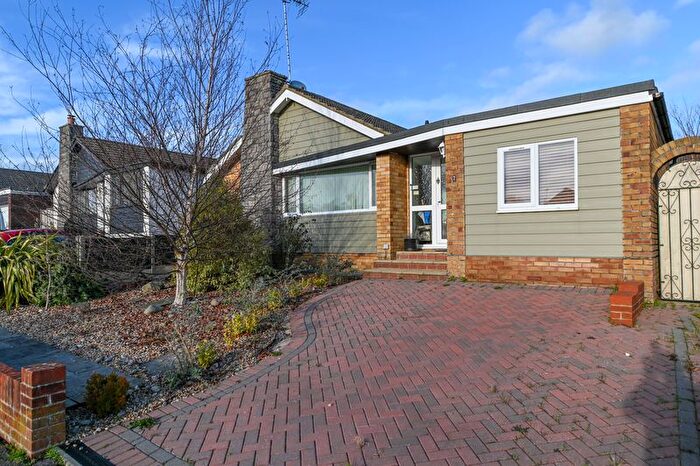
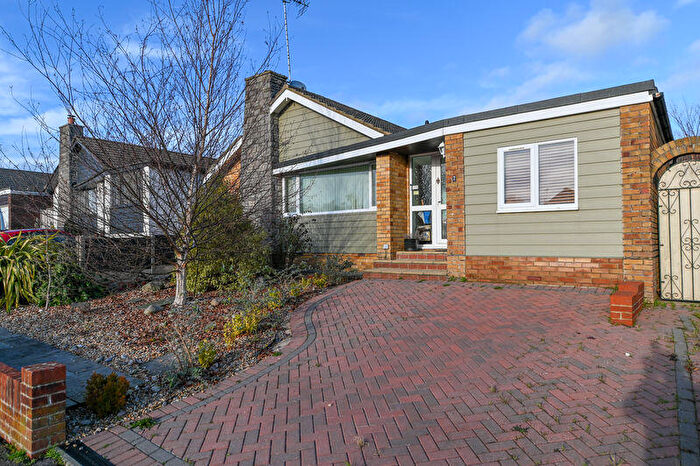
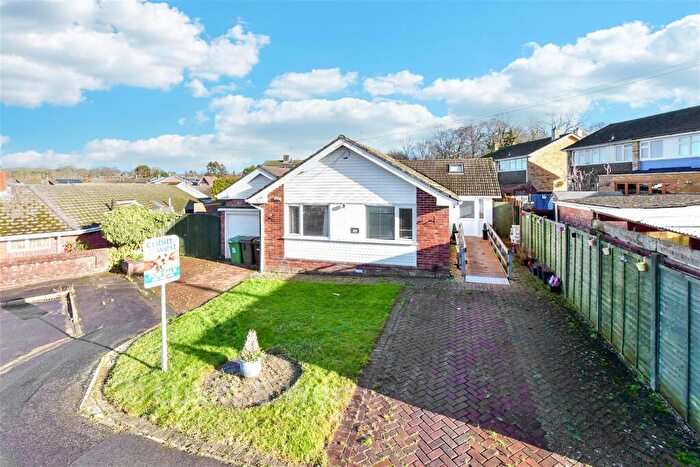
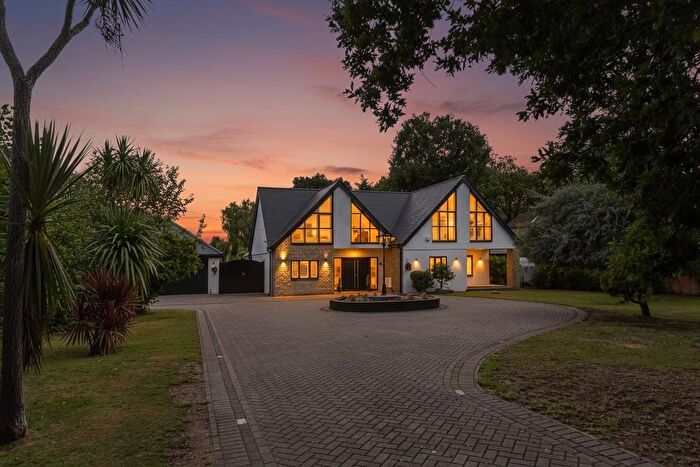
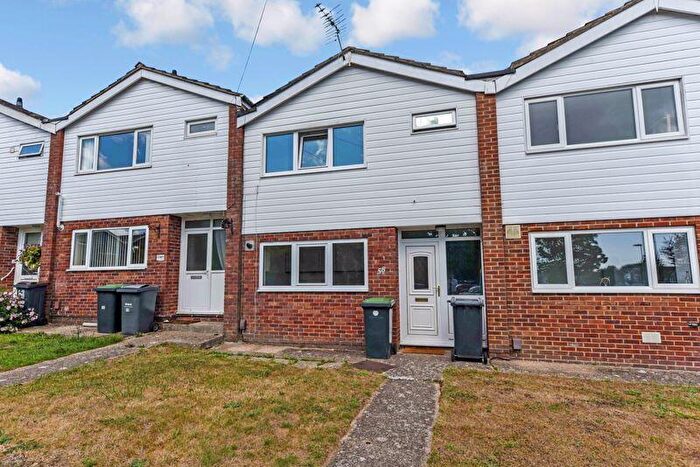
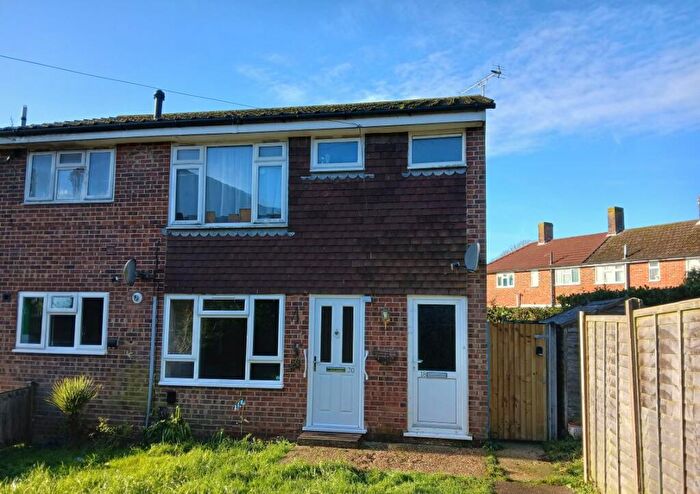
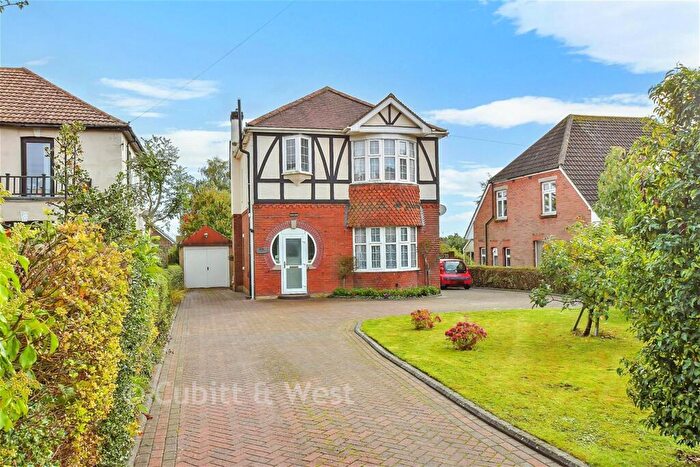
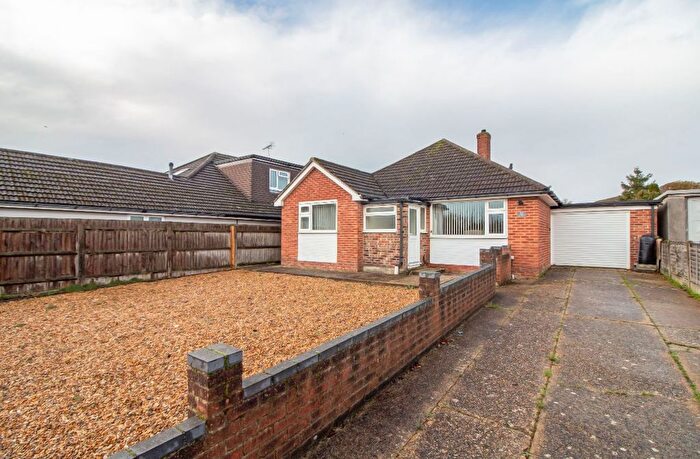
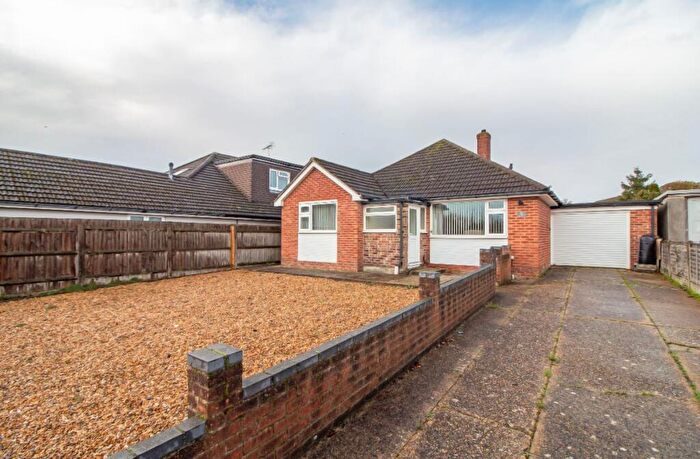
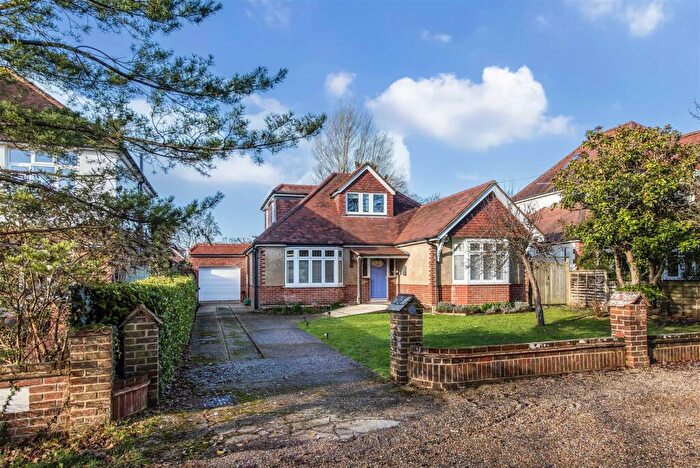
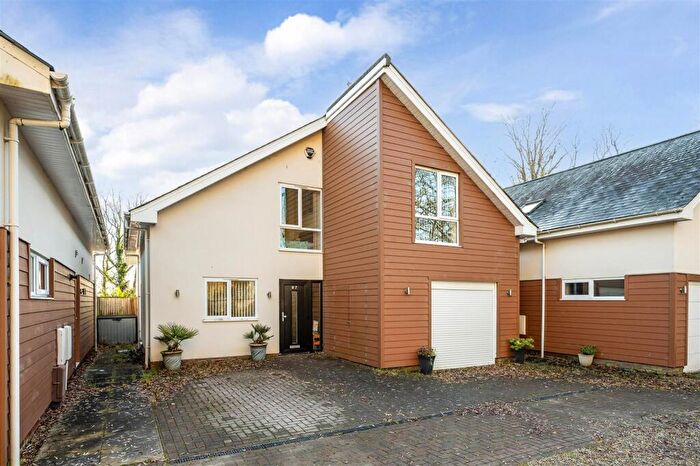
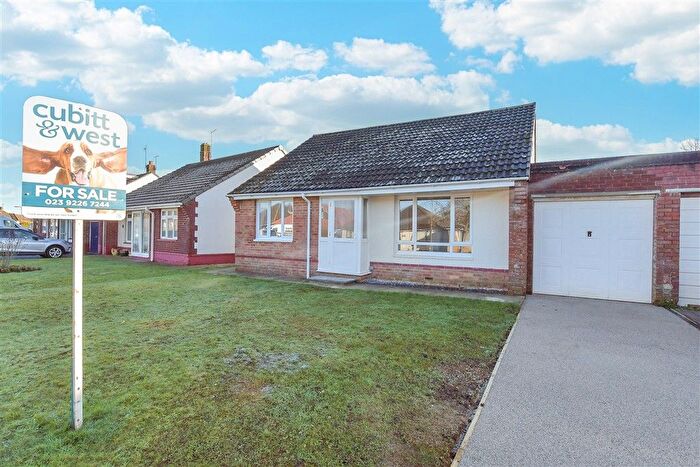
Properties for sale in Horndean Hazleton And Blendworth
Roads and Postcodes in Horndean Hazleton And Blendworth
Navigate through our locations to find the location of your next house in Horndean Hazleton And Blendworth, Waterlooville for sale or to rent.
| Streets | Postcodes |
|---|---|
| Acacia Gardens | PO8 9EA |
| Almond Close | PO8 9EP |
| Barley Rise | PO8 0UN |
| Beech Way | PO8 9DF |
| Blendworth Lane | PO8 0AA PO8 0AB PO8 0AE |
| Briar Close | PO8 9ED |
| Castle Gardens | PO8 9WH |
| Cedar Crescent | PO8 9EX PO8 9EZ |
| Chestnut Avenue | PO8 9EU |
| Church Path | PO8 0DG |
| Deep Dell | PO8 9DH |
| Fir Tree Gardens | PO8 9HF |
| Greenfield Crescent | PO8 9ER PO8 9ET PO8 9EW |
| Havant Road | PO8 0DB PO8 0DP PO8 0DT PO8 0XA |
| Hazleton Way | PO8 9DN PO8 9DP PO8 9DR PO8 9DW PO8 9DX PO8 9DZ PO8 9EB |
| Hill View | PO8 9EY |
| Hollybank Close | PO8 9ES |
| Idsworth Close | PO8 0DW |
| Kilderkin Drive | PO8 0FF |
| Larchfield Way | PO8 9HE |
| Laurel Road | PO8 9BW |
| Letcombe Place | PO8 0DE |
| Linden Way | PO8 9DY |
| London Road | PO8 0BN PO8 0BW PO8 0BX PO8 0BY PO8 0BZ PO8 0SY |
| Malthouse Way | PO8 0SZ |
| Mapletree Avenue | PO8 9BL PO8 9BN |
| Oasthouse Drive | PO8 0UG |
| Old Brewery Way | PO8 0UF |
| Orchard Close | PO8 9LL |
| Peacock Gardens | PO8 9WG |
| Portsmouth Road | PO8 9LB PO8 9LG PO8 9LH PO8 9LN PO8 9LQ PO8 9SY |
| Pump Lane | PO8 9TS |
| Rosemary Way | PO8 9DQ |
| Rowlands Castle Road | PO8 0DF PO8 0DL |
| Spring Vale | PO8 9DB |
| The Yews | PO8 0BH |
| Verbena Crescent | PO8 9DE |
| Wellington Close | PO8 0UR |
| Whitebeam Close | PO8 9HD |
| Whitehaven | PO8 0DN |
| PO8 0AG PO8 0AH |
Transport near Horndean Hazleton And Blendworth
- FAQ
- Price Paid By Year
- Property Type Price
Frequently asked questions about Horndean Hazleton And Blendworth
What is the average price for a property for sale in Horndean Hazleton And Blendworth?
The average price for a property for sale in Horndean Hazleton And Blendworth is £434,655. This amount is 18% higher than the average price in Waterlooville. There are 890 property listings for sale in Horndean Hazleton And Blendworth.
What streets have the most expensive properties for sale in Horndean Hazleton And Blendworth?
The streets with the most expensive properties for sale in Horndean Hazleton And Blendworth are Blendworth Lane at an average of £1,093,624, Portsmouth Road at an average of £688,928 and Church Path at an average of £685,000.
What streets have the most affordable properties for sale in Horndean Hazleton And Blendworth?
The streets with the most affordable properties for sale in Horndean Hazleton And Blendworth are Oasthouse Drive at an average of £213,666, Barley Rise at an average of £222,666 and The Yews at an average of £248,024.
Which train stations are available in or near Horndean Hazleton And Blendworth?
Some of the train stations available in or near Horndean Hazleton And Blendworth are Rowland's Castle, Bedhampton and Havant.
Property Price Paid in Horndean Hazleton And Blendworth by Year
The average sold property price by year was:
| Year | Average Sold Price | Price Change |
Sold Properties
|
|---|---|---|---|
| 2025 | £427,220 | -13% |
35 Properties |
| 2024 | £480,707 | 15% |
32 Properties |
| 2023 | £406,437 | -0,2% |
43 Properties |
| 2022 | £407,399 | 3% |
57 Properties |
| 2021 | £395,782 | 11% |
64 Properties |
| 2020 | £351,617 | 8% |
34 Properties |
| 2019 | £322,372 | 13% |
51 Properties |
| 2018 | £280,188 | -19% |
43 Properties |
| 2017 | £334,537 | 11% |
53 Properties |
| 2016 | £298,911 | 2% |
49 Properties |
| 2015 | £292,665 | 1% |
56 Properties |
| 2014 | £290,754 | 16% |
100 Properties |
| 2013 | £245,209 | 7% |
62 Properties |
| 2012 | £228,260 | -18% |
25 Properties |
| 2011 | £269,541 | 6% |
35 Properties |
| 2010 | £252,226 | 5% |
33 Properties |
| 2009 | £239,421 | -13% |
21 Properties |
| 2008 | £269,932 | -6% |
23 Properties |
| 2007 | £285,510 | 23% |
62 Properties |
| 2006 | £218,612 | -11% |
48 Properties |
| 2005 | £241,908 | -5% |
44 Properties |
| 2004 | £254,325 | 13% |
56 Properties |
| 2003 | £220,529 | 24% |
49 Properties |
| 2002 | £168,344 | -2% |
73 Properties |
| 2001 | £172,304 | 23% |
55 Properties |
| 2000 | £132,765 | 23% |
44 Properties |
| 1999 | £102,331 | 16% |
56 Properties |
| 1998 | £85,781 | -7% |
33 Properties |
| 1997 | £91,833 | 8% |
39 Properties |
| 1996 | £84,206 | 13% |
33 Properties |
| 1995 | £73,047 | - |
40 Properties |
Property Price per Property Type in Horndean Hazleton And Blendworth
Here you can find historic sold price data in order to help with your property search.
The average Property Paid Price for specific property types in the last three years are:
| Property Type | Average Sold Price | Sold Properties |
|---|---|---|
| Semi Detached House | £399,440.00 | 20 Semi Detached Houses |
| Detached House | £529,593.00 | 53 Detached Houses |
| Terraced House | £425,375.00 | 21 Terraced Houses |
| Flat | £176,374.00 | 16 Flats |

