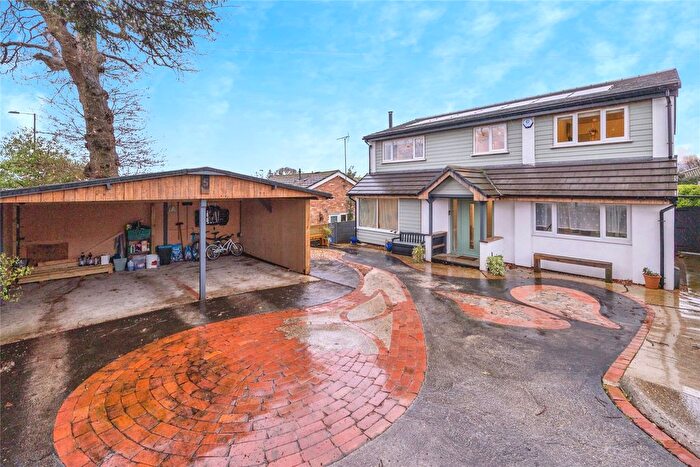
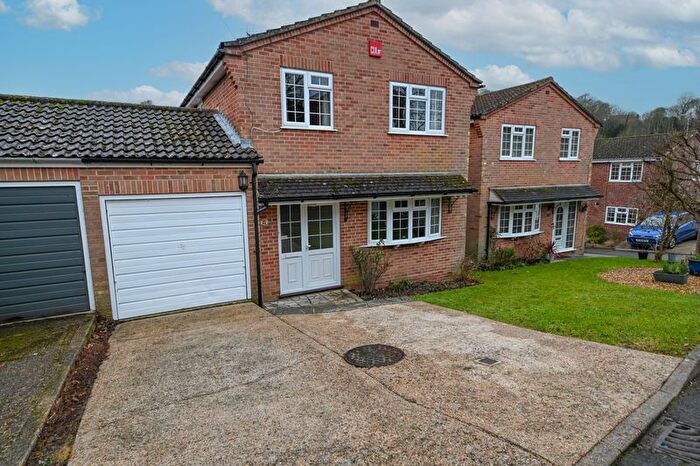
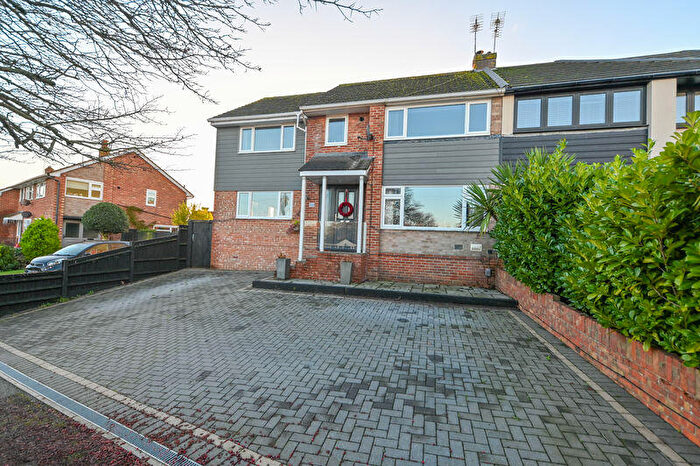
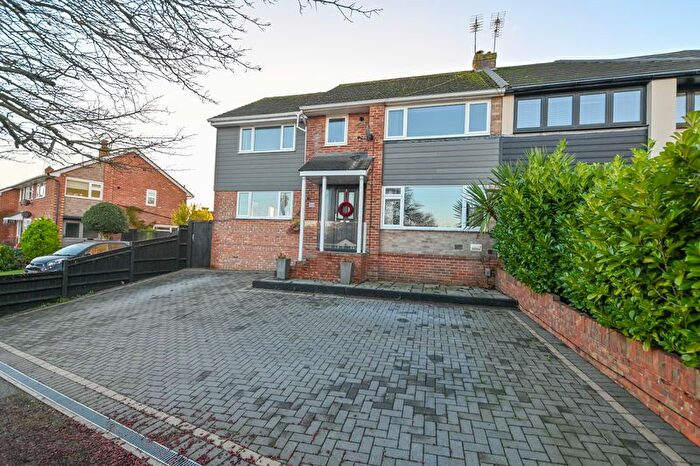
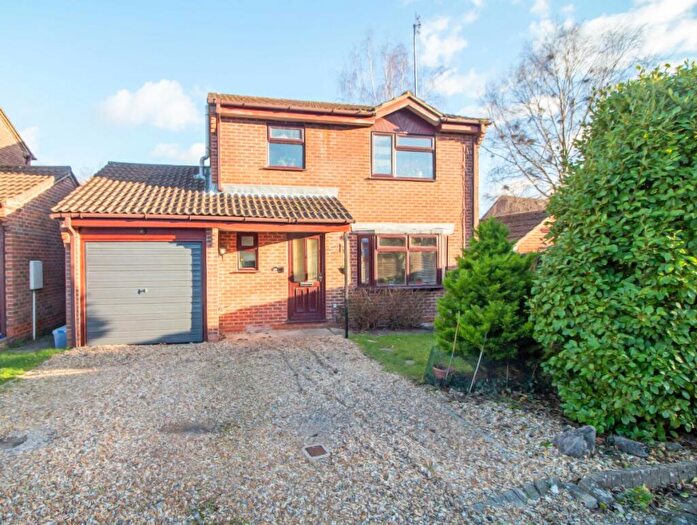
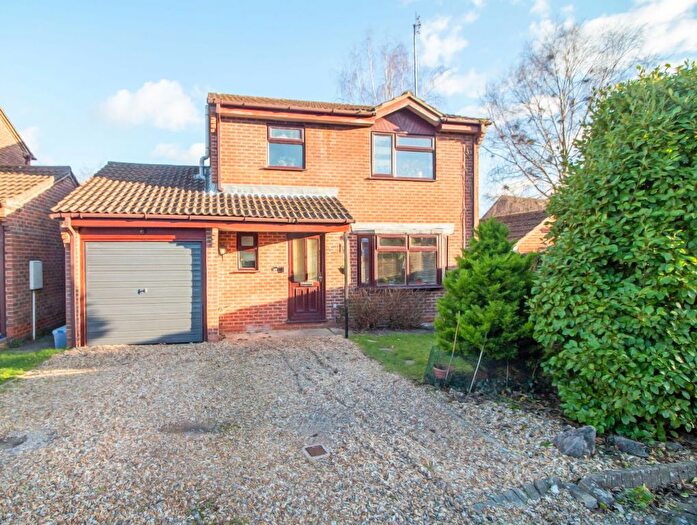
Houses for sale & to rent in Horndean Murray, Waterlooville
House Prices in Horndean Murray
Properties in Horndean Murray have an average house price of £403,903.00 and had 114 Property Transactions within the last 3 years¹.
Horndean Murray is an area in Waterlooville, Hampshire with 996 households², where the most expensive property was sold for £1,500,000.00.
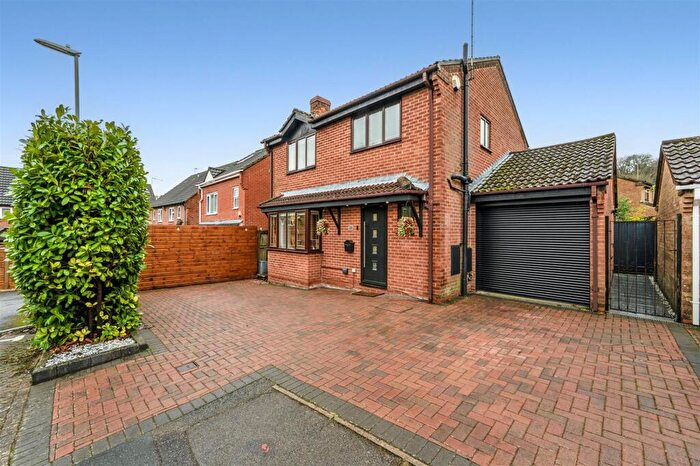
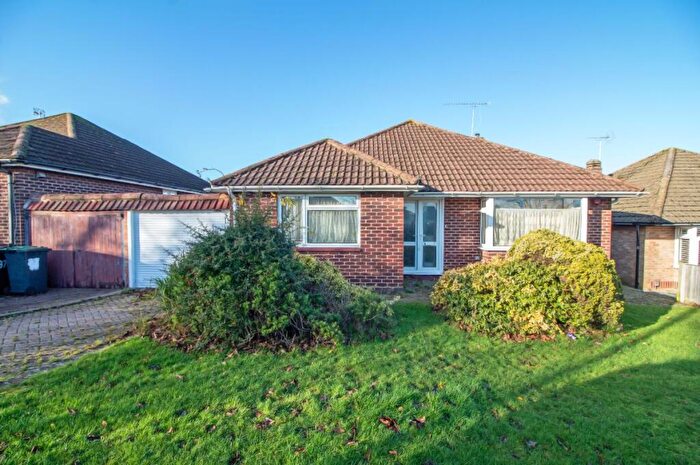
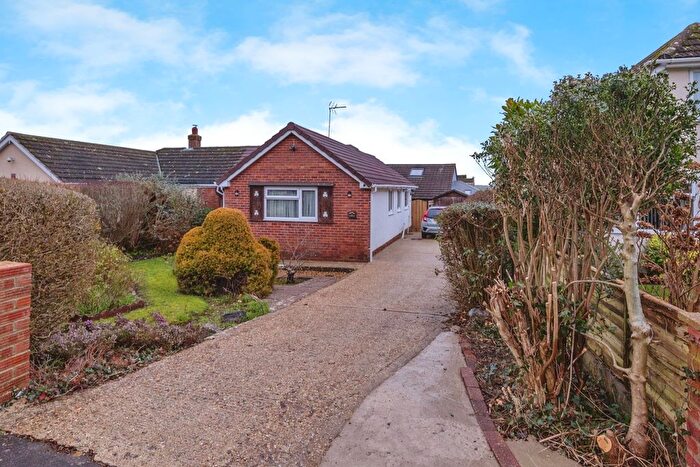
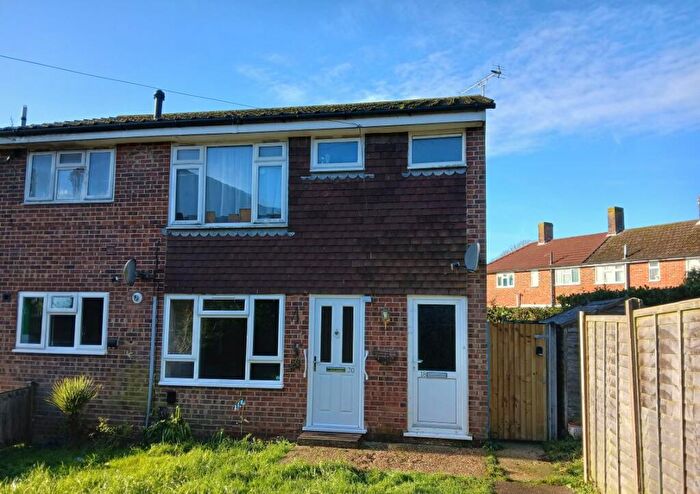
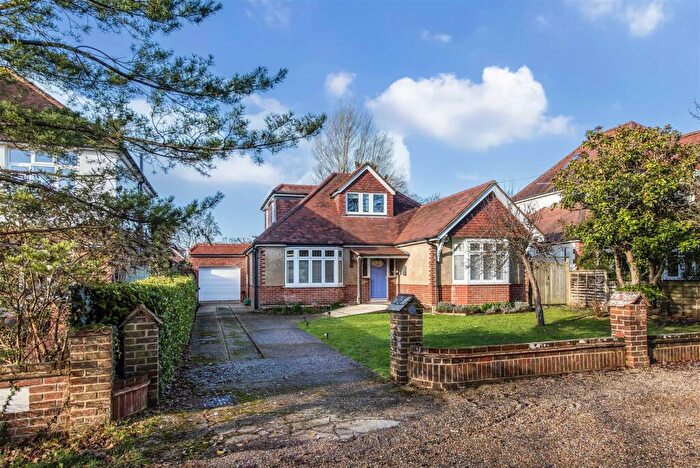
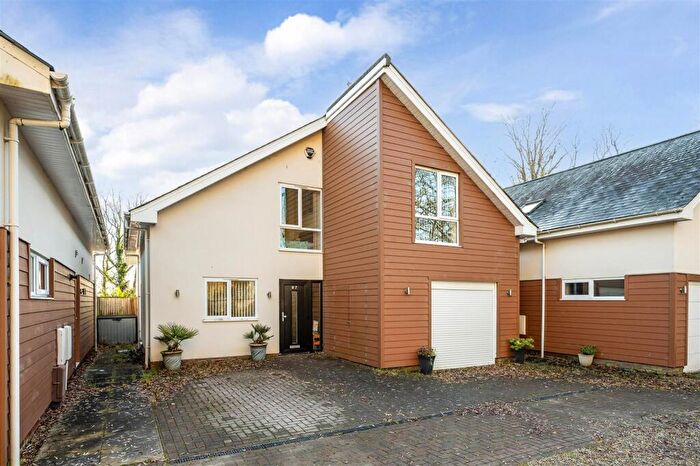
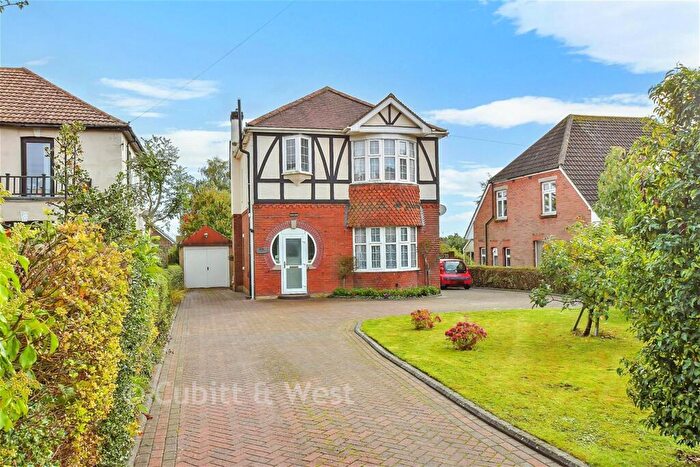
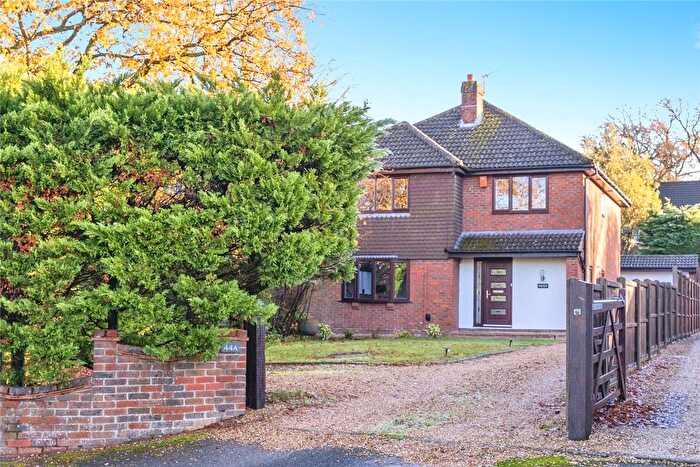
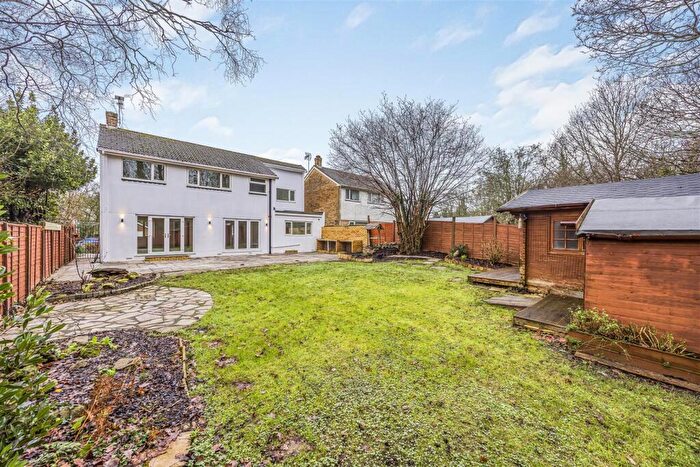
Properties for sale in Horndean Murray
Roads and Postcodes in Horndean Murray
Navigate through our locations to find the location of your next house in Horndean Murray, Waterlooville for sale or to rent.
| Streets | Postcodes |
|---|---|
| Barton Cross | PO8 9PQ |
| Benbow Close | PO8 9LU |
| Bentley Close | PO8 9HH |
| Bourne Close | PO8 9JF |
| Bowes-lyon Court | PO8 9HJ |
| Bridget Close | PO8 9NR |
| Bridle Path | PO8 9PA |
| Castle Mews | PO8 9AF |
| Catherington Lane | PO8 0TA PO8 9GU PO8 9HZ PO8 9JA PO8 9PB PO8 9JJ |
| Chalk Hill Road | PO8 9NY |
| Chantry Road | PO8 9QF |
| Crisspyn Close | PO8 9JT |
| Cunningham Road | PO8 9LT |
| Dorset Close | PO8 9JG |
| Durlands Court | PO8 9FW |
| Durlands Road | PO8 9NT |
| Farmers Way | PO8 9GY |
| Five Heads Road | PO8 9NU PO8 9NW PO8 9NZ |
| Heath Close | PO8 9PS |
| Highcroft Lane | PO8 9NX PO8 9PU |
| Jodrell Close | PO8 9NH |
| Kefford Close | PO8 9JR |
| Lychgate Drive | PO8 9QE |
| Maynard Place | PO8 9PF |
| Merchistoun Road | PO8 9LS PO8 9LY PO8 9NA PO8 9NF PO8 9NQ PO8 9LX |
| Murray Road | PO8 9JE PO8 9JL PO8 9JN PO8 9JQ PO8 9JS |
| Napier Road | PO8 9LR |
| Nelson Crescent | PO8 9LZ |
| Portsmouth Road | PO8 9LJ PO8 9NL PO8 9NN |
| Princess Gardens | PO8 9PT |
| Queens Crescent | PO8 9NB PO8 9ND |
| Rodney Way | PO8 9NG |
| Roland Close | PO8 9JP |
| Rookes Close | PO8 9JW |
| St Anns Road | PO8 9NE |
| St Vincent Crescent | PO8 9JB PO8 9JD |
| Stagshorn Road | PO8 9NS |
| Stonechat Road | PO8 9BX |
| Tarbery Crescent | PO8 9NP |
| Walden Gardens | PO8 9PE PO8 9PP |
| Wentworth Drive | PO8 9PR |
Transport near Horndean Murray
- FAQ
- Price Paid By Year
- Property Type Price
Frequently asked questions about Horndean Murray
What is the average price for a property for sale in Horndean Murray?
The average price for a property for sale in Horndean Murray is £403,903. This amount is 9% higher than the average price in Waterlooville. There are 994 property listings for sale in Horndean Murray.
What streets have the most expensive properties for sale in Horndean Murray?
The streets with the most expensive properties for sale in Horndean Murray are Highcroft Lane at an average of £602,666, Maynard Place at an average of £535,000 and Wentworth Drive at an average of £501,250.
What streets have the most affordable properties for sale in Horndean Murray?
The streets with the most affordable properties for sale in Horndean Murray are Bowes-lyon Court at an average of £195,000, Jodrell Close at an average of £222,498 and Crisspyn Close at an average of £261,500.
Which train stations are available in or near Horndean Murray?
Some of the train stations available in or near Horndean Murray are Rowland's Castle, Bedhampton and Havant.
Property Price Paid in Horndean Murray by Year
The average sold property price by year was:
| Year | Average Sold Price | Price Change |
Sold Properties
|
|---|---|---|---|
| 2025 | £422,081 | 6% |
22 Properties |
| 2024 | £398,602 | -2% |
39 Properties |
| 2023 | £405,738 | 2% |
21 Properties |
| 2022 | £396,662 | 4% |
32 Properties |
| 2021 | £380,175 | -8% |
37 Properties |
| 2020 | £409,234 | 21% |
34 Properties |
| 2019 | £322,621 | -8% |
35 Properties |
| 2018 | £347,937 | 11% |
32 Properties |
| 2017 | £309,769 | -4% |
26 Properties |
| 2016 | £320,711 | 2% |
34 Properties |
| 2015 | £313,509 | 17% |
48 Properties |
| 2014 | £259,786 | -3% |
29 Properties |
| 2013 | £267,402 | 6% |
53 Properties |
| 2012 | £251,382 | -9% |
46 Properties |
| 2011 | £273,589 | -10% |
28 Properties |
| 2010 | £300,786 | 23% |
24 Properties |
| 2009 | £232,583 | -11% |
22 Properties |
| 2008 | £258,187 | -4% |
16 Properties |
| 2007 | £267,753 | 4% |
41 Properties |
| 2006 | £256,379 | 16% |
34 Properties |
| 2005 | £215,627 | 6% |
31 Properties |
| 2004 | £201,645 | -4% |
44 Properties |
| 2003 | £210,155 | 17% |
41 Properties |
| 2002 | £174,919 | 15% |
33 Properties |
| 2001 | £149,143 | 8% |
51 Properties |
| 2000 | £137,076 | 13% |
36 Properties |
| 1999 | £119,358 | 12% |
38 Properties |
| 1998 | £105,134 | 23% |
39 Properties |
| 1997 | £80,566 | -5% |
36 Properties |
| 1996 | £84,211 | -7% |
26 Properties |
| 1995 | £89,705 | - |
28 Properties |
Property Price per Property Type in Horndean Murray
Here you can find historic sold price data in order to help with your property search.
The average Property Paid Price for specific property types in the last three years are:
| Property Type | Average Sold Price | Sold Properties |
|---|---|---|
| Semi Detached House | £349,606.00 | 40 Semi Detached Houses |
| Detached House | £533,703.00 | 43 Detached Houses |
| Terraced House | £305,279.00 | 25 Terraced Houses |
| Flat | £246,583.00 | 6 Flats |

