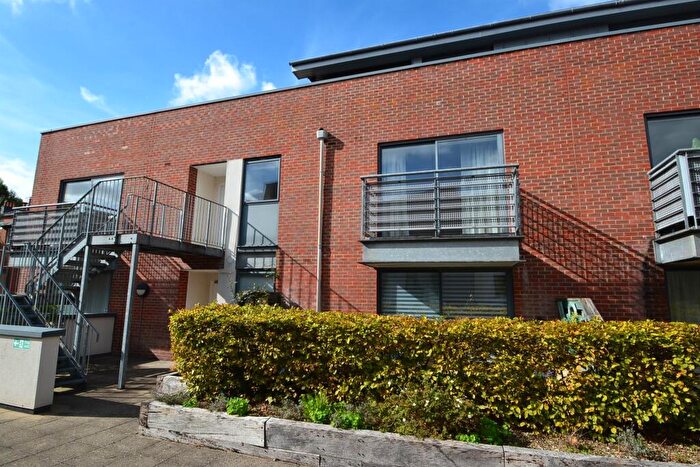
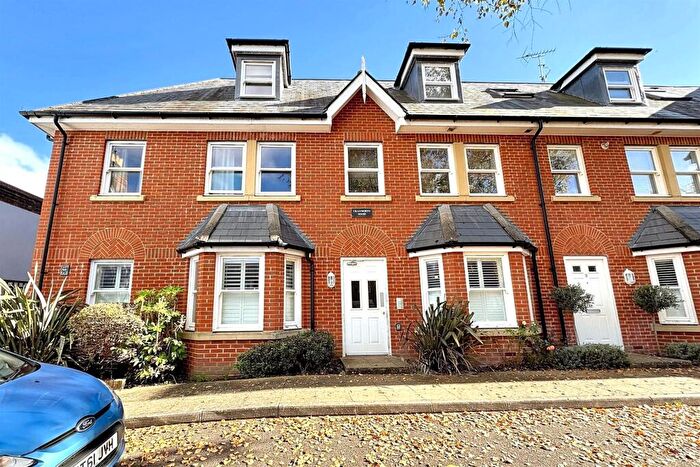
Houses for sale & to rent in SO23 8FJ, Exchange Square, St Bartholomew, Winchester
House Prices in SO23 8FJ, Exchange Square, St Bartholomew
Properties in SO23 8FJ have no sales history available within the last 3 years. SO23 8FJ is a postcode in Exchange Square located in St Bartholomew, an area in Winchester, Hampshire, with 0 household².
Properties for sale near SO23 8FJ, Exchange Square
Price Paid in Exchange Square, SO23 8FJ, St Bartholomew
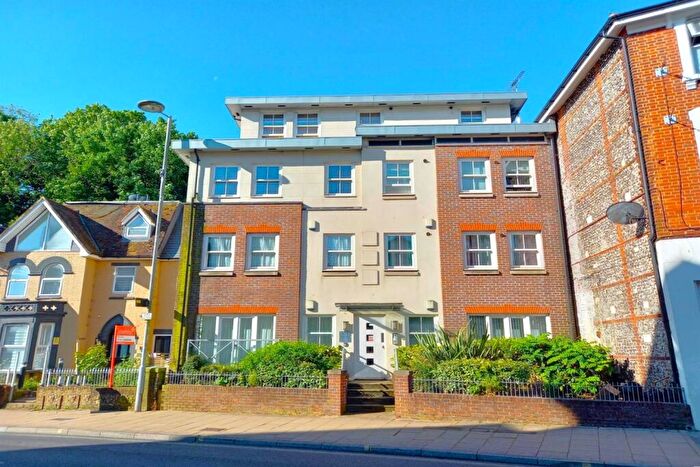
3 FLAT 5 Exchange Square, SO23 8FJ, St Bartholomew Winchester
Property 3 FLAT 5 has been sold 1 time. The last time it was sold was in 30/09/2021 and the sold price was £165,000.00.
This is a Flat which was sold as a leasehold in 30/09/2021
| Date | Price | Property Type | Tenure | Classification |
|---|---|---|---|---|
| 30/09/2021 | £165,000.00 | Flat | leasehold | Established Building |
3 FLAT 1 Exchange Square, SO23 8FJ, St Bartholomew Winchester
Property 3 FLAT 1 has been sold 2 times. The last time it was sold was in 24/07/2020 and the sold price was £272,500.00.
This is a Flat which was sold as a leasehold in 24/07/2020
| Date | Price | Property Type | Tenure | Classification |
|---|---|---|---|---|
| 24/07/2020 | £272,500.00 | Flat | leasehold | Established Building |
| 10/03/2017 | £275,000.00 | Flat | leasehold | Established Building |
3 FLAT 2 Exchange Square, SO23 8FJ, St Bartholomew Winchester
Property 3 FLAT 2 has been sold 2 times. The last time it was sold was in 02/12/2019 and the sold price was £365,000.00.
This is a Flat which was sold as a leasehold in 02/12/2019
| Date | Price | Property Type | Tenure | Classification |
|---|---|---|---|---|
| 02/12/2019 | £365,000.00 | Flat | leasehold | Established Building |
| 04/04/2014 | £332,500.00 | Flat | leasehold | Established Building |
3 FLAT 3 Exchange Square, SO23 8FJ, St Bartholomew Winchester
Property 3 FLAT 3 has been sold 2 times. The last time it was sold was in 31/01/2018 and the sold price was £350,000.00.
This is a Flat which was sold as a leasehold in 31/01/2018
| Date | Price | Property Type | Tenure | Classification |
|---|---|---|---|---|
| 31/01/2018 | £350,000.00 | Flat | leasehold | Established Building |
| 23/08/2012 | £275,000.00 | Flat | leasehold | Established Building |
3 FLAT 6 Exchange Square, SO23 8FJ, St Bartholomew Winchester
Property 3 FLAT 6 has been sold 1 time. The last time it was sold was in 01/02/2016 and the sold price was £365,000.00.
This is a Flat which was sold as a leasehold in 01/02/2016
| Date | Price | Property Type | Tenure | Classification |
|---|---|---|---|---|
| 01/02/2016 | £365,000.00 | Flat | leasehold | Established Building |
3 FLAT 4 Exchange Square, SO23 8FJ, St Bartholomew Winchester
Property 3 FLAT 4 has been sold 1 time. The last time it was sold was in 24/04/2015 and the sold price was £265,000.00.
This is a Flat which was sold as a leasehold in 24/04/2015
| Date | Price | Property Type | Tenure | Classification |
|---|---|---|---|---|
| 24/04/2015 | £265,000.00 | Flat | leasehold | Established Building |
SABI, 4 Exchange Square, SO23 8FJ, St Bartholomew Winchester
Property SABI, 4 has been sold 1 time. The last time it was sold was in 25/06/2014 and the sold price was £300,000.00.
This is a Flat which was sold as a leasehold in 25/06/2014
| Date | Price | Property Type | Tenure | Classification |
|---|---|---|---|---|
| 25/06/2014 | £300,000.00 | Flat | leasehold | Established Building |
Transport near SO23 8FJ, Exchange Square
-
Winchester Station
-
Shawford Station
-
Chandlers Ford Station
-
Eastleigh Station
-
Southampton Airport (Parkway) Station
-
Micheldever Station
-
Swaythling Station
-
Romsey Station
-
Hedge End Station
House price paid reports for SO23 8FJ, Exchange Square
Click on the buttons below to see price paid reports by year or property price:
- Price Paid By Year
Property Price Paid in SO23 8FJ, Exchange Square by Year
The average sold property price by year was:
| Year | Average Sold Price | Price Change |
Sold Properties
|
|---|---|---|---|
| 2021 | £165,000 | -65% |
1 Property |
| 2020 | £272,500 | -34% |
1 Property |
| 2019 | £365,000 | 4% |
1 Property |
| 2018 | £350,000 | 21% |
1 Property |
| 2017 | £275,000 | -33% |
1 Property |
| 2016 | £365,000 | 27% |
1 Property |
| 2015 | £265,000 | -19% |
1 Property |
| 2014 | £316,250 | 13% |
2 Properties |
| 2012 | £275,000 | - |
1 Property |

