Houses for sale & to rent in Queensbury, Edgware
House Prices in Queensbury
Properties in this part of Queensbury within Edgware have an average house price of £510,225.00 and had 44 Property Transactions within the last 3 years¹. This area has 980 households² , where the most expensive property was sold for £720,000.00.
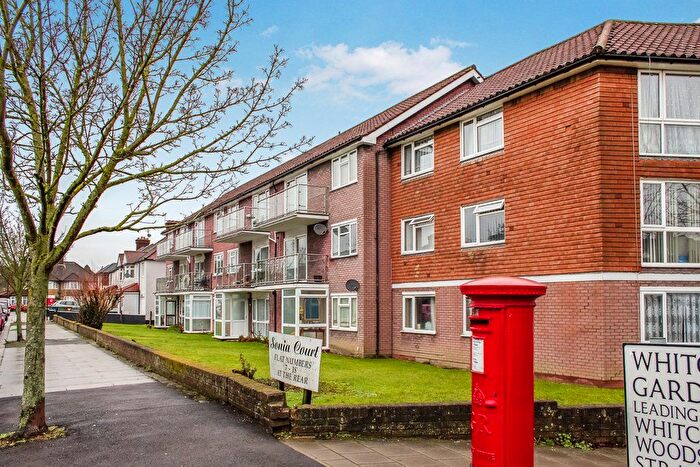
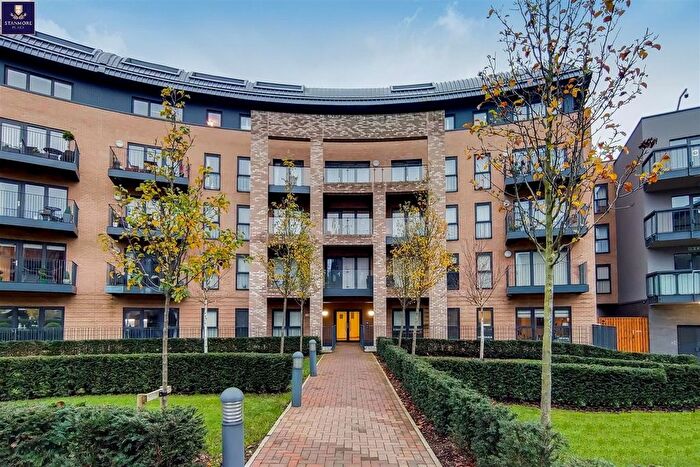
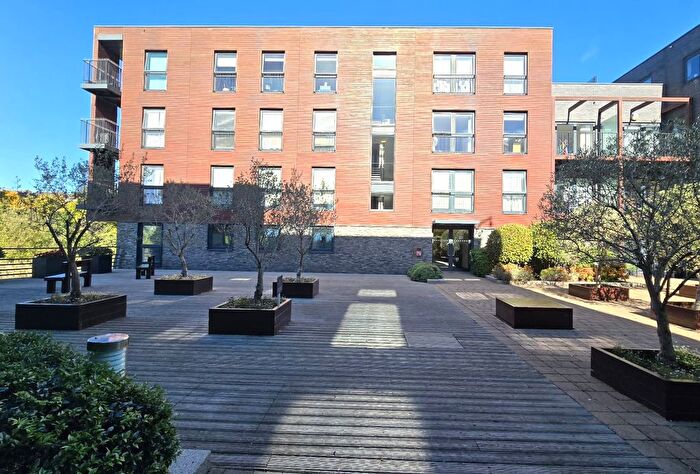
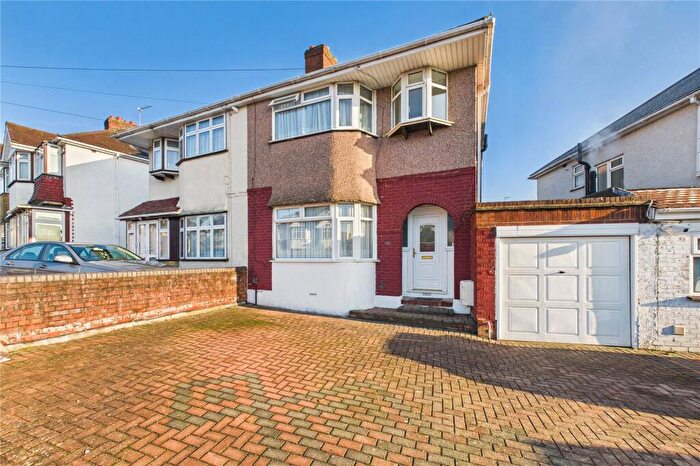
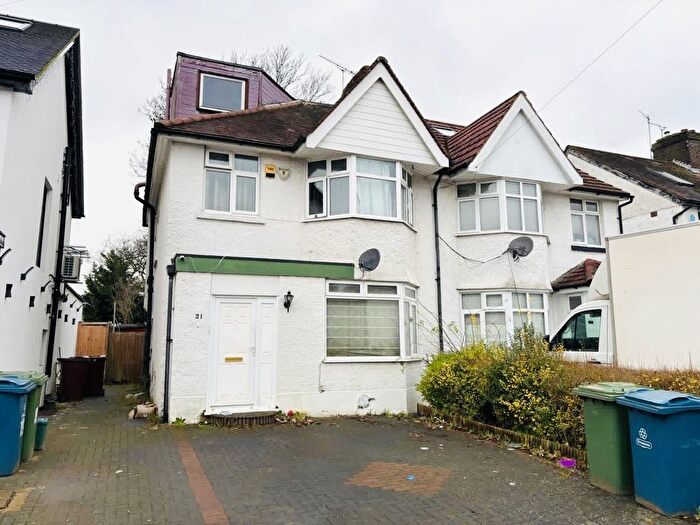
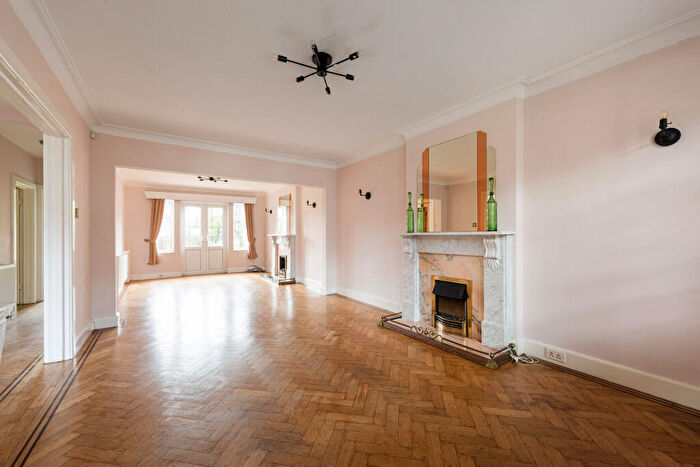
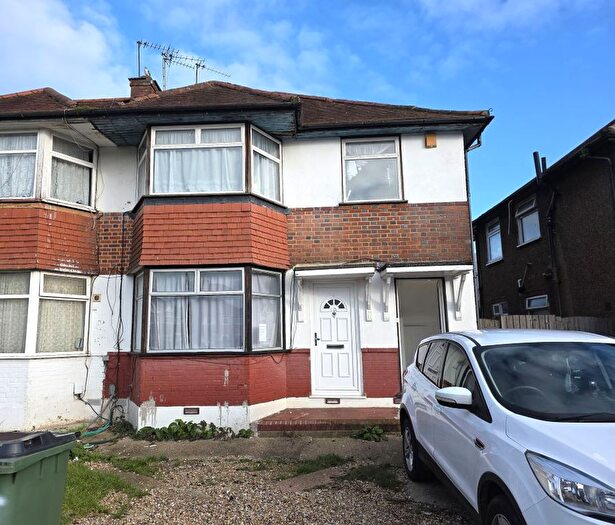
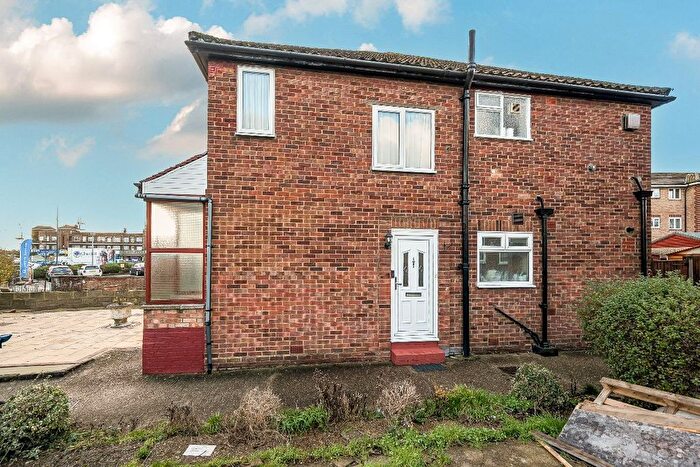
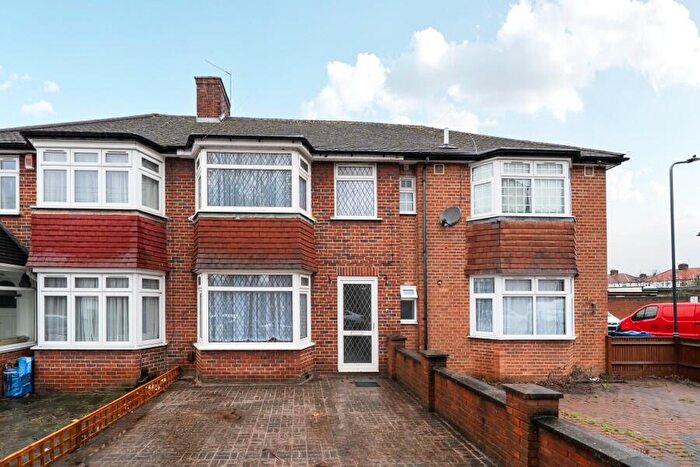
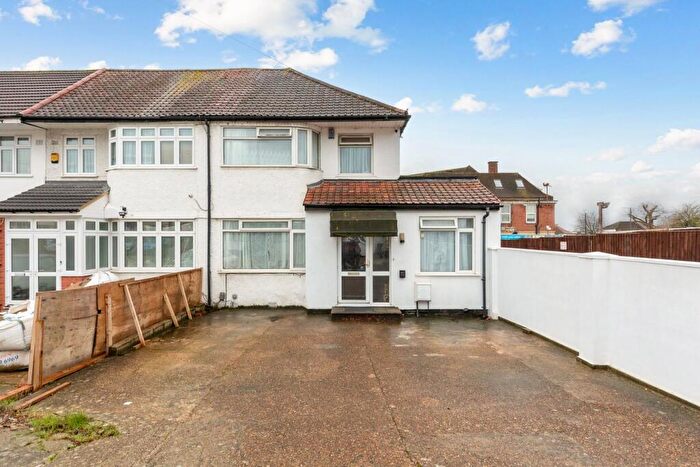
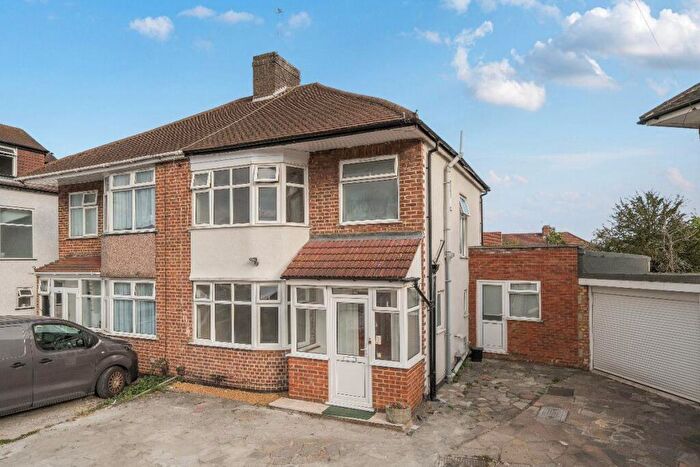
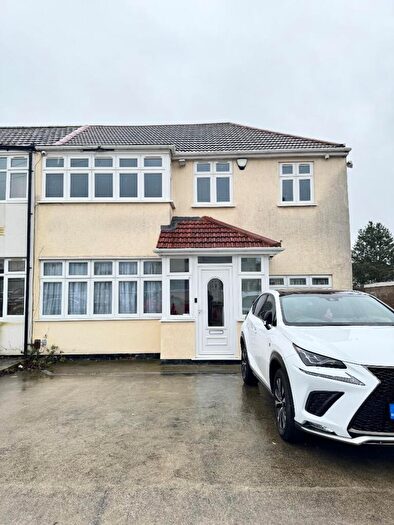
Properties for sale in Queensbury
Roads and Postcodes in Queensbury
Navigate through our locations to find the location of your next house in Queensbury, Edgware for sale or to rent.
| Streets | Postcodes |
|---|---|
| Bridgewater Gardens | HA8 6AP HA8 6AW |
| Camrose Avenue | HA8 6AG HA8 6AH HA8 6AJ HA8 6AQ |
| Coombe Close | HA8 6BA |
| Cotman Gardens | HA8 5TE |
| Dale Avenue | HA8 6AA HA8 6AB HA8 6AD HA8 6AE HA8 6AF |
| Gainsborough Gardens | HA8 5TA HA8 5TB |
| Mollison Way | HA8 5QT HA8 5QU HA8 5QX HA8 5QY HA8 5QZ |
| Reynolds Drive | HA8 5PU HA8 5PX HA8 5PY HA8 5PZ |
| Shaldon Road | HA8 6AL HA8 6AN |
| St Austell Close | HA8 6BD |
| Teignmouth Close | HA8 6BG |
| Tiverton Road | HA8 6AZ HA8 6BB HA8 6BE HA8 6BQ |
| Turner Road | HA8 6AR HA8 6AS HA8 6AT HA8 6AU HA8 6AX HA8 6AY HA8 6BH HA8 6BJ |
| Waltham Drive | HA8 5PF HA8 5PG |
Transport near Queensbury
-
Queensbury Station
-
Canons Park Station
-
Kingsbury Station
-
Burnt Oak Station
-
Edgware Station
-
Colindale Station
-
Stanmore Station
-
Kenton Station
-
Preston Road Station
-
Mill Hill Broadway Station
- FAQ
- Price Paid By Year
- Property Type Price
Frequently asked questions about Queensbury
What is the average price for a property for sale in Queensbury?
The average price for a property for sale in Queensbury is £510,225. This amount is 4% lower than the average price in Edgware. There are 2,065 property listings for sale in Queensbury.
What streets have the most expensive properties for sale in Queensbury?
The streets with the most expensive properties for sale in Queensbury are Teignmouth Close at an average of £630,000, St Austell Close at an average of £606,666 and Reynolds Drive at an average of £590,000.
What streets have the most affordable properties for sale in Queensbury?
The streets with the most affordable properties for sale in Queensbury are Tiverton Road at an average of £200,900, Camrose Avenue at an average of £378,500 and Gainsborough Gardens at an average of £479,000.
Which train stations are available in or near Queensbury?
Some of the train stations available in or near Queensbury are Kenton and Mill Hill Broadway.
Which tube stations are available in or near Queensbury?
Some of the tube stations available in or near Queensbury are Queensbury, Canons Park and Kingsbury.
Property Price Paid in Queensbury by Year
The average sold property price by year was:
| Year | Average Sold Price | Price Change |
Sold Properties
|
|---|---|---|---|
| 2025 | £537,611 | 11% |
18 Properties |
| 2024 | £476,921 | -7% |
14 Properties |
| 2023 | £508,000 | -3% |
12 Properties |
| 2022 | £522,530 | 6% |
16 Properties |
| 2021 | £492,200 | -2% |
20 Properties |
| 2020 | £501,882 | 9% |
17 Properties |
| 2019 | £457,916 | -3% |
12 Properties |
| 2018 | £472,818 | 1% |
11 Properties |
| 2017 | £466,293 | 4% |
22 Properties |
| 2016 | £445,333 | 9% |
18 Properties |
| 2015 | £405,202 | 4% |
21 Properties |
| 2014 | £389,735 | 18% |
21 Properties |
| 2013 | £318,103 | 9% |
13 Properties |
| 2012 | £289,013 | -2% |
23 Properties |
| 2011 | £295,647 | 8% |
17 Properties |
| 2010 | £273,018 | 4% |
32 Properties |
| 2009 | £260,844 | -19% |
17 Properties |
| 2008 | £309,334 | 10% |
22 Properties |
| 2007 | £279,845 | 7% |
44 Properties |
| 2006 | £259,310 | 7% |
44 Properties |
| 2005 | £241,293 | 3% |
24 Properties |
| 2004 | £233,253 | 8% |
31 Properties |
| 2003 | £213,546 | 9% |
27 Properties |
| 2002 | £193,852 | 18% |
51 Properties |
| 2001 | £158,352 | 11% |
52 Properties |
| 2000 | £141,267 | 17% |
45 Properties |
| 1999 | £117,714 | 13% |
56 Properties |
| 1998 | £102,035 | 12% |
47 Properties |
| 1997 | £89,846 | 16% |
40 Properties |
| 1996 | £75,473 | 4% |
30 Properties |
| 1995 | £72,280 | - |
25 Properties |
Property Price per Property Type in Queensbury
Here you can find historic sold price data in order to help with your property search.
The average Property Paid Price for specific property types in the last three years are:
| Property Type | Average Sold Price | Sold Properties |
|---|---|---|
| Semi Detached House | £556,115.00 | 13 Semi Detached Houses |
| Terraced House | £511,800.00 | 28 Terraced Houses |
| Flat | £296,666.00 | 3 Flats |

