
Houses for sale in Great Chart With Singleton North, Ashford
House Prices in Great Chart With Singleton North
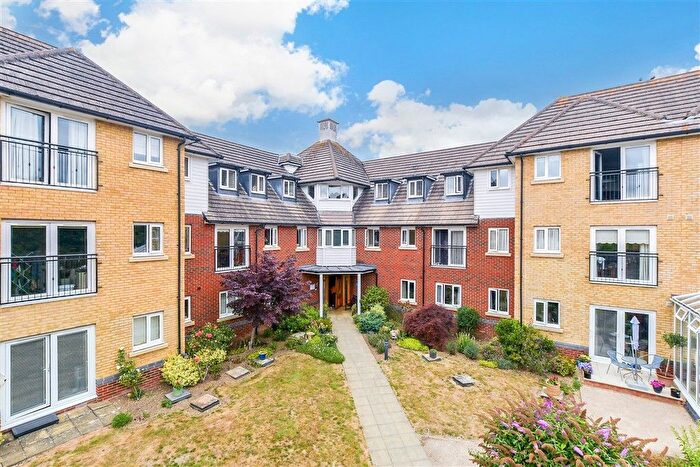
Properties in Great Chart With Singleton North have an average house price of £332k and had 149 Property Transactions within the last 3 years¹.
Great Chart With Singleton North is an area in Ashford, Kent with 1,436 households², where the most expensive property was sold for £1.23M.
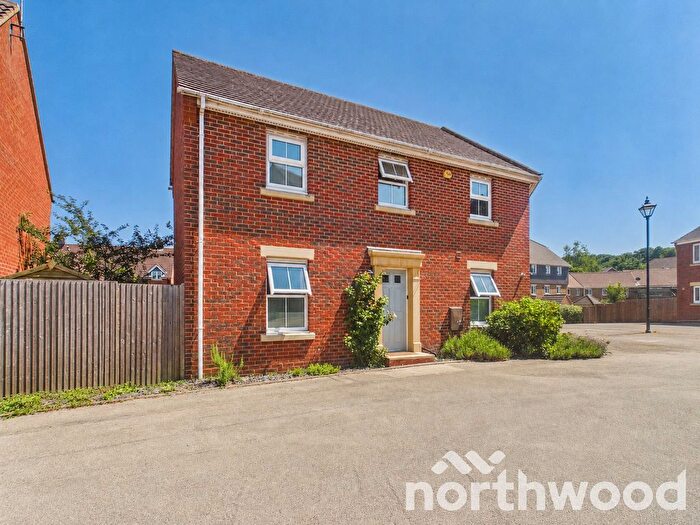
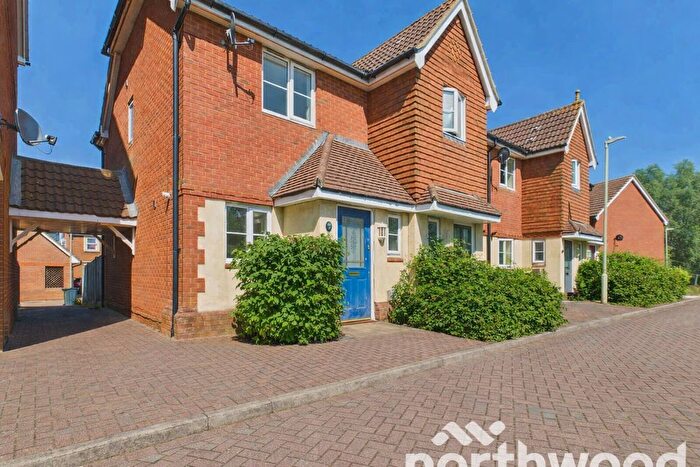
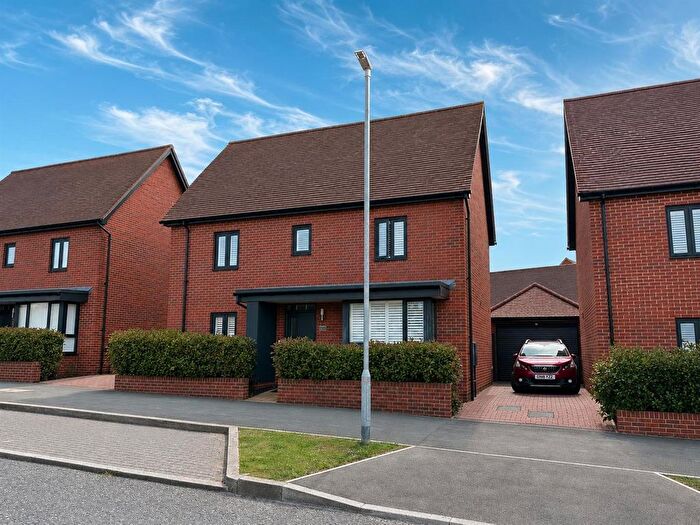
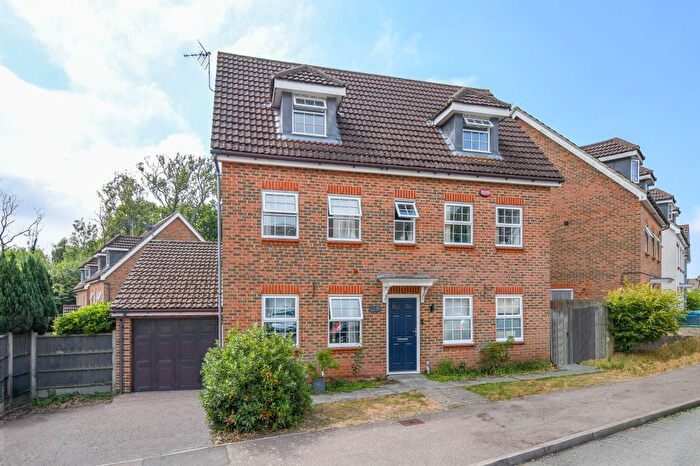
Properties for sale in Great Chart With Singleton North
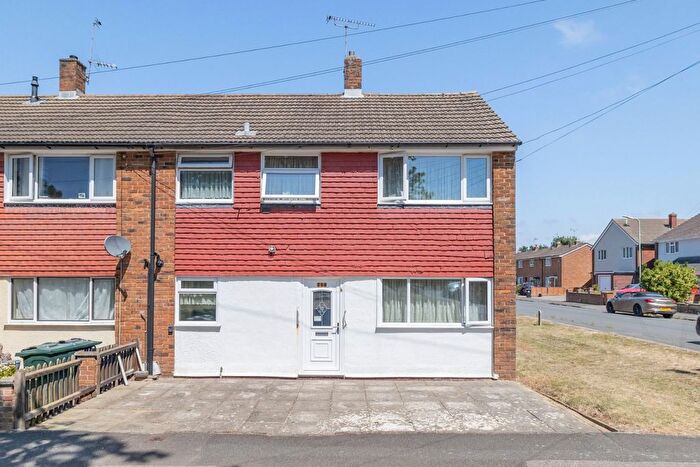
![]()
If you are looking to sell your house, let it out, or receive a property valuation, an expert can help you.
Click the button below to get started.
Roads and Postcodes in Great Chart With Singleton North
Navigate through our locations to find the location of your next house in Great Chart With Singleton North, Ashford for sale or to rent.
| Streets | Postcodes |
|---|---|
| Ashford Road | TN23 3DH |
| Badgers Oak | TN23 4GT |
| Bean Close | TN23 3BG |
| Blue Field | TN23 5HN TN23 5HP |
| Bucksford Lane | TN23 4TZ TN23 4YR |
| Chart Road | TN23 3AD TN23 3AE |
| Chater Close | TN23 5JG |
| Chilmington Green | TN23 3DP |
| Chilmington Green Road | TN23 3DL TN23 3DN |
| Coronation Drive | TN23 3BD |
| Daniels Water | TN26 1JY |
| Deyley Way | TN23 5HX |
| Dragonfly Close | TN23 5GH |
| Forge Cottages | TN23 3AJ |
| Garton Way | TN23 5HH TN23 5HJ |
| Gravelly Field | TN23 5HR |
| Great Fishers | TN23 5JB TN23 5JD |
| Grenadier Way | TN23 5JN |
| Grey Willow Gardens | TN23 5GG |
| Griffin Close | TN23 5GF |
| Haymakers Lane | TN23 4GJ TN23 4GL TN23 4GN |
| High Ridge | TN23 5HE |
| Hillcrest | TN23 3AZ |
| Holt Close | TN23 5HZ |
| Homestead | TN23 4PX |
| Hoppers Way | TN23 4GP |
| House Meadow | TN23 5HF TN23 5HG |
| Imperial Way | TN23 5HA TN23 5HB TN23 5HT TN23 5HU TN23 5JF |
| Kirk View | TN23 5HL TN23 5HQ |
| Little Hempen | TN23 4YS |
| Marmion Way | TN23 5HY |
| Melcombe Close | TN23 5JP |
| Middle Close | TN23 3BQ |
| Millfield | TN23 4GW |
| Mock Lane | TN23 3DS |
| Ninn Lane | TN23 3DB TN23 3DD |
| Old Stone Cottage | TN23 3DW |
| Park Lane | TN26 1JZ |
| Pearmain Way | TN23 5JL |
| Reedmace Close | TN23 5GE |
| Ribston Way | TN23 5JQ |
| Russett Close | TN23 5JH |
| Sandy Lane | TN26 1JN |
| Singleton Hill | TN23 5WE |
| Singleton Road | TN23 3BA TN23 3BB |
| Spartan Road | TN23 5JJ |
| Stowell Close | TN23 5HS |
| Sunnyside Villas | TN23 3AL |
| Swaffer Way | TN23 5JA TN23 5JE |
| The Bulrushes | TN23 5GA TN23 5GB TN23 5GD |
| The Paddocks | TN23 3BE |
| The Street | TN23 3AH TN23 3AN TN23 3AP TN23 3AT TN23 3AW TN23 3AX |
| Tunbridge Way | TN23 5HW |
| Yeomans Square | TN23 4GQ |
| TN23 3BX TN26 1JJ TN26 1JL TN26 1JP TN26 1JS TN26 1JT TN26 1JU TN26 1JX |
Property price trends in Great Chart With Singleton North
According to the latest Land Registry data, the average home in Great Chart With Singleton North sold for £202,500 in 2026. That figure comes from 2,625 sales logged over the past 31 years.
Prices have fallen back over the last three years. Compared with 2023, when the typical sale came in around £364,004, that's a fall of roughly 44.4%.
Looking back five years, average prices are down about 34.9% since 2021, a drop of around £108,392 in cash terms.
Zoom out to the past decade for the fuller picture. Back in 2016, homes here averaged £231,026, so the typical sold price has fallen about 12.3% since then, around 1.3% a year lower. Stretch the view to fifteen years and that annual pace edges up closer to 0.8%.
Frequently asked questions about Great Chart With Singleton North
What is the average price for a property for sale in Great Chart With Singleton North?
The average price for a property for sale in Great Chart With Singleton North is £331,994. This amount is 9% lower than the average price in Ashford. There are 2,051 property listings for sale in Great Chart With Singleton North.
What streets have the most expensive properties for sale in Great Chart With Singleton North?
The streets with the most expensive properties for sale in Great Chart With Singleton North are Bucksford Lane at an average of £835,000, The Street at an average of £810,000 and Ashford Road at an average of £640,000.
What streets have the most affordable properties for sale in Great Chart With Singleton North?
The streets with the most affordable properties for sale in Great Chart With Singleton North are Holt Close at an average of £199,225, Chater Close at an average of £199,666 and Garton Way at an average of £206,250.
Which train stations are available in or near Great Chart With Singleton North?
Some of the train stations available in or near Great Chart With Singleton North are Ashford International, Pluckley and Ham Street.
Property Price Paid in Great Chart With Singleton North by Year
The average sold property price by year was:
| Year | Average Sold Price | Price Change |
Sold Properties
|
|---|---|---|---|
| 2026 | £202,500 | -59% |
2 Properties |
| 2025 | £322,522 | 5% |
53 Properties |
| 2024 | £306,365 | -19% |
39 Properties |
| 2023 | £364,004 | 3% |
55 Properties |
| 2022 | £351,463 | 12% |
82 Properties |
| 2021 | £310,892 | 14% |
85 Properties |
| 2020 | £266,481 | -5% |
54 Properties |
| 2019 | £280,447 | 3% |
74 Properties |
| 2018 | £272,157 | 4% |
64 Properties |
| 2017 | £260,386 | 11% |
86 Properties |
Property Price per Property Type in Great Chart With Singleton North
Here you can find historic sold price data in order to help with your property search.
The average Property Paid Price for specific property types in the last three years are:
| Property Type | Average Sold Price | Sold Properties |
|---|---|---|
| Semi Detached House | £330,036.00 | 29 Semi Detached Houses |
| Detached House | £469,643.00 | 41 Detached Houses |
| Terraced House | £284,626.00 | 63 Terraced Houses |
| Flat | £169,328.00 | 16 Flats |
