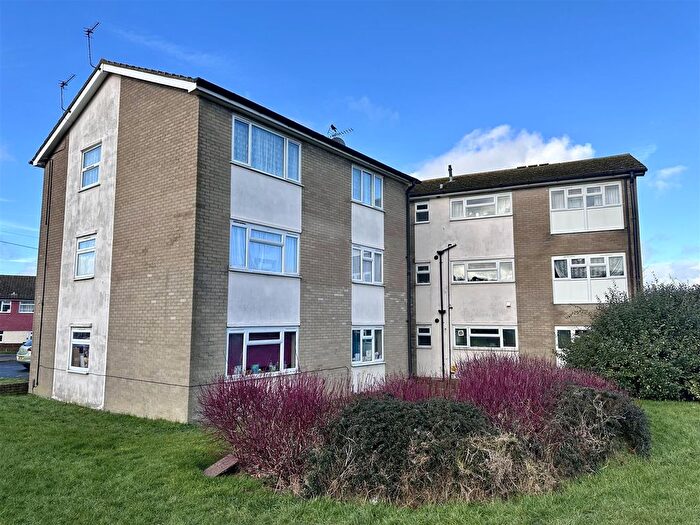
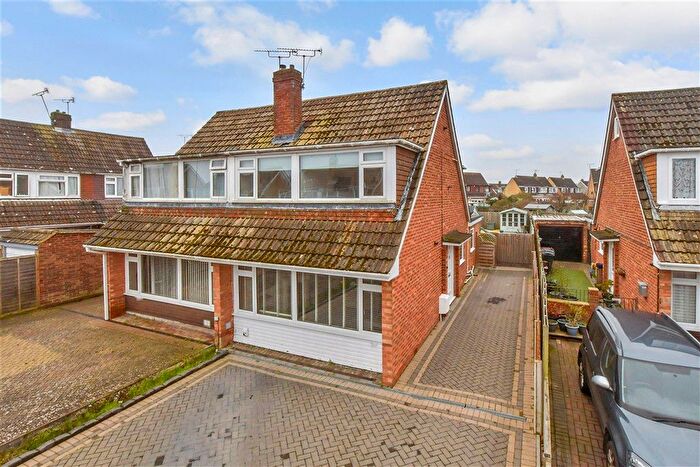
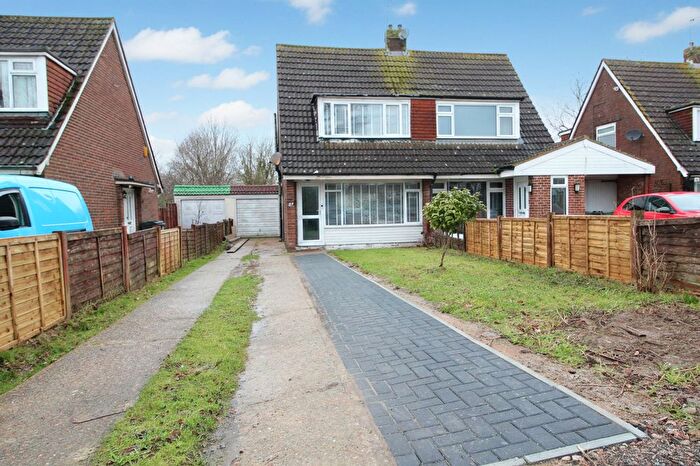
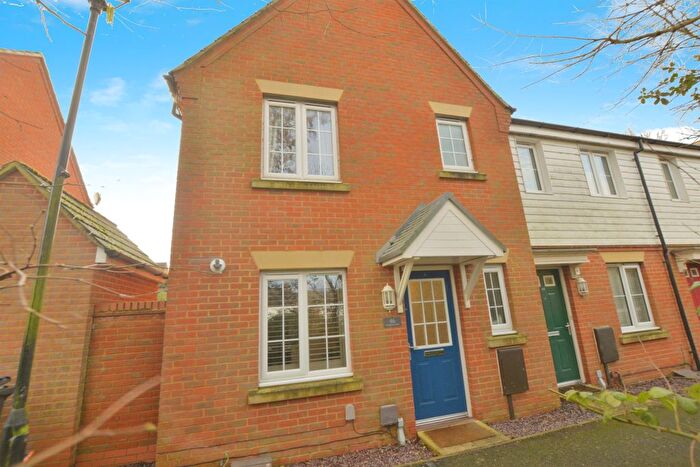
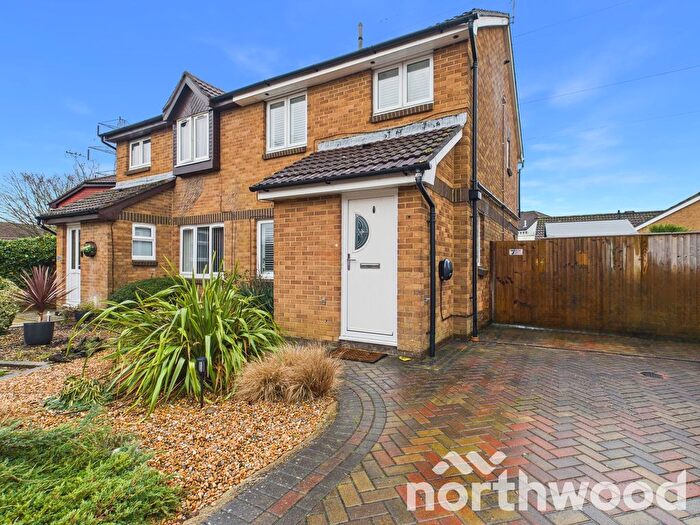
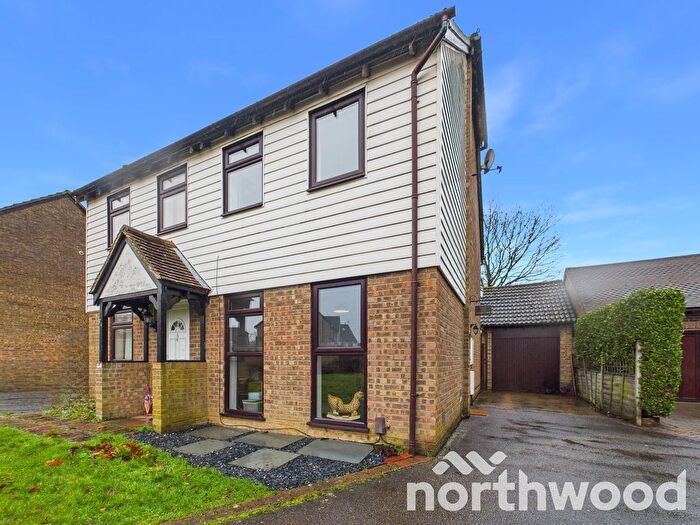
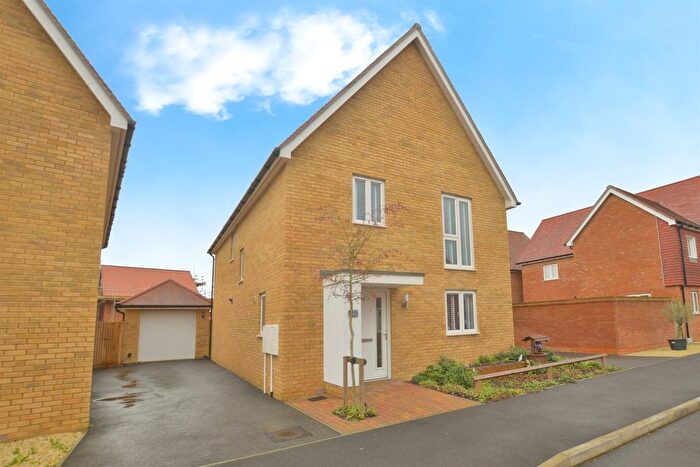
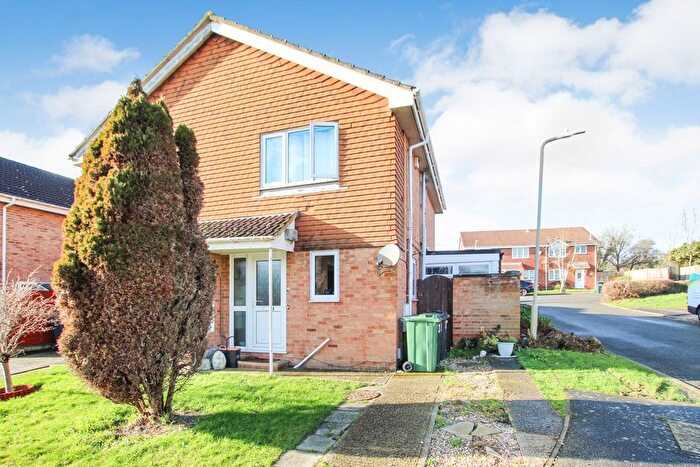
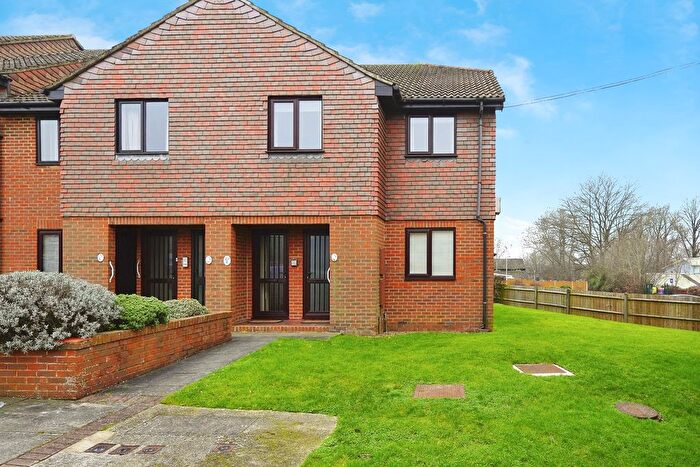
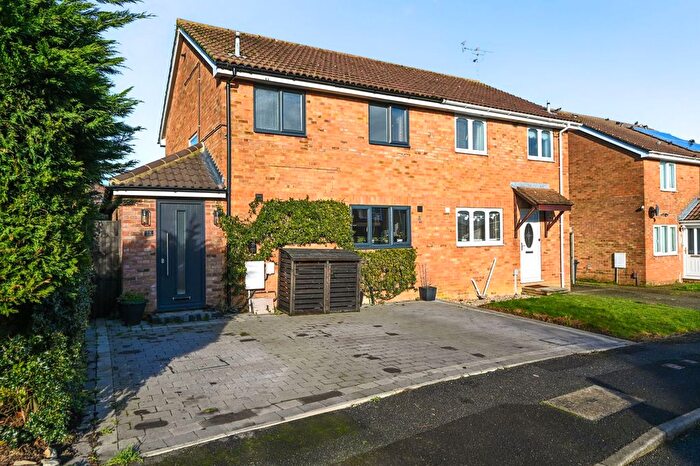
Houses for sale & to rent in Singleton South, Ashford
House Prices in Singleton South
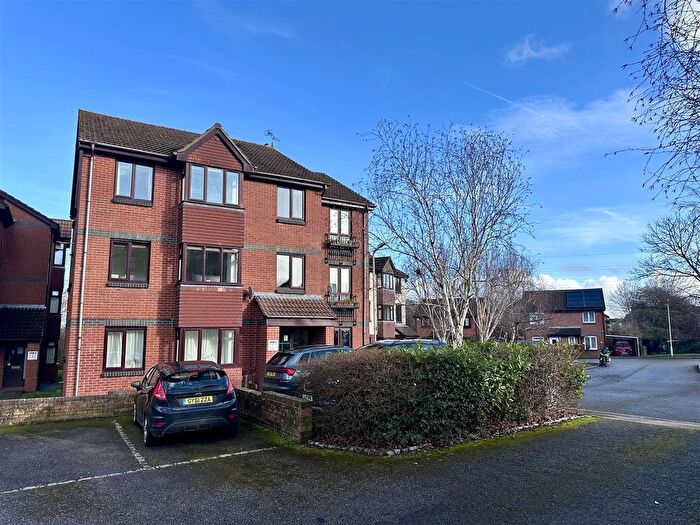
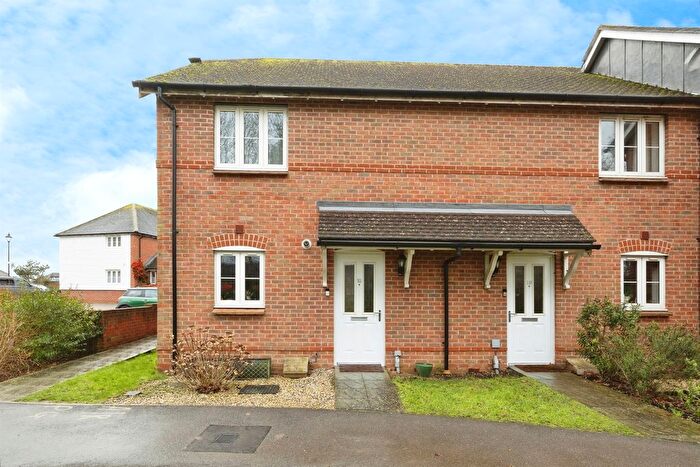
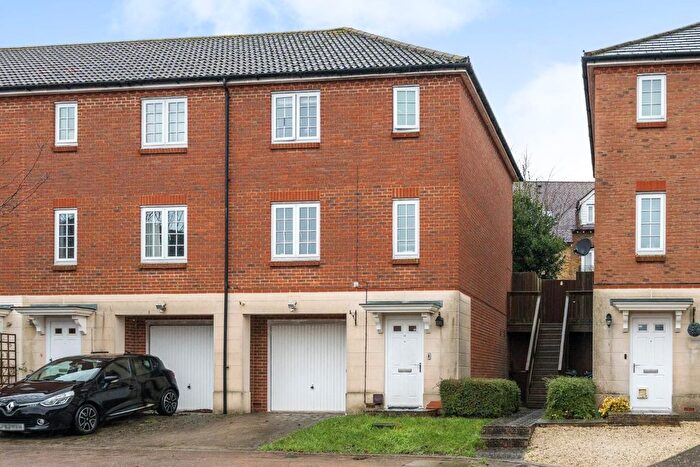
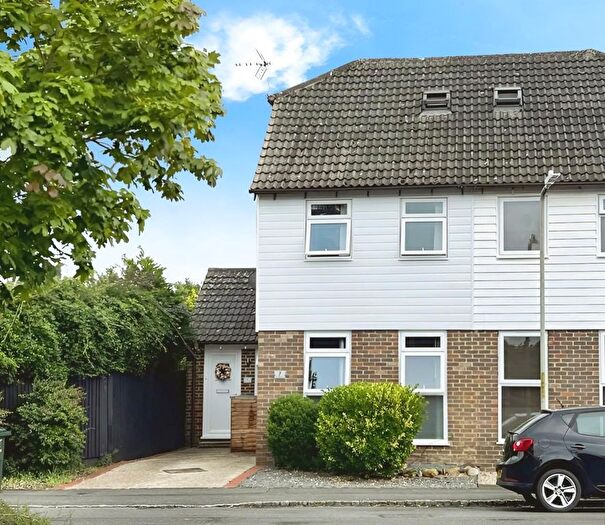
Properties in Singleton South have an average house price of £254,866.00 and had 173 Property Transactions within the last 3 years¹.
Singleton South is an area in Ashford, Kent with 1,383 households², where the most expensive property was sold for £495,000.00.
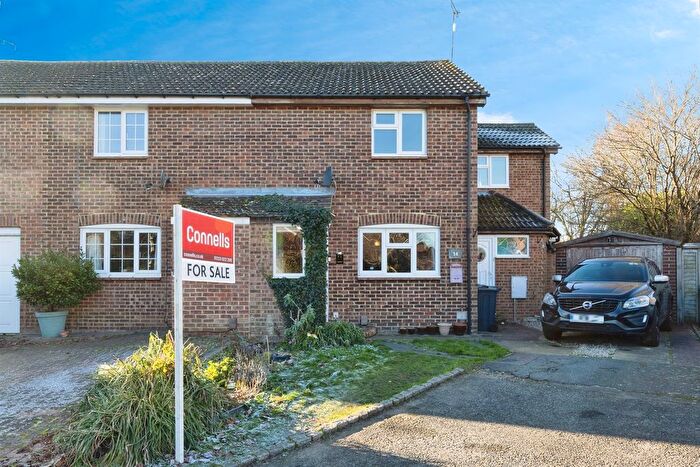
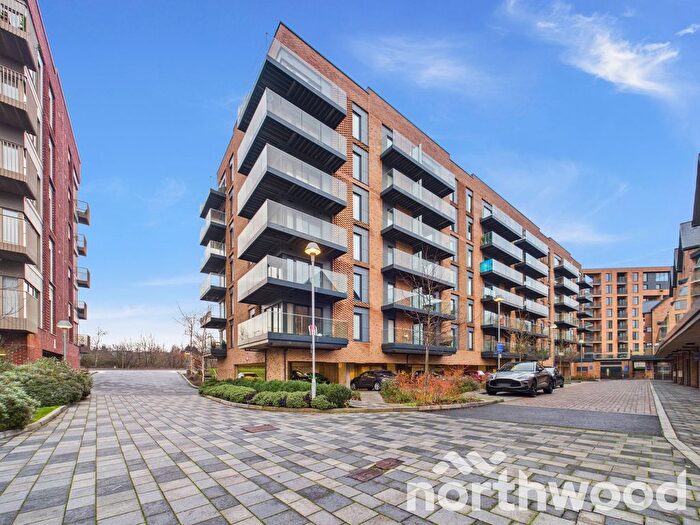
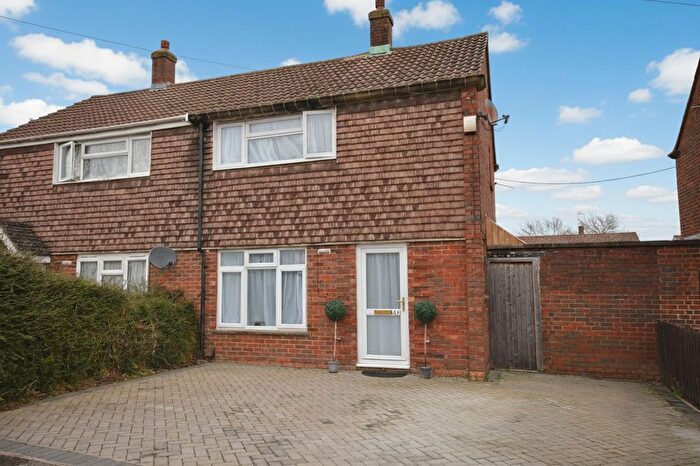
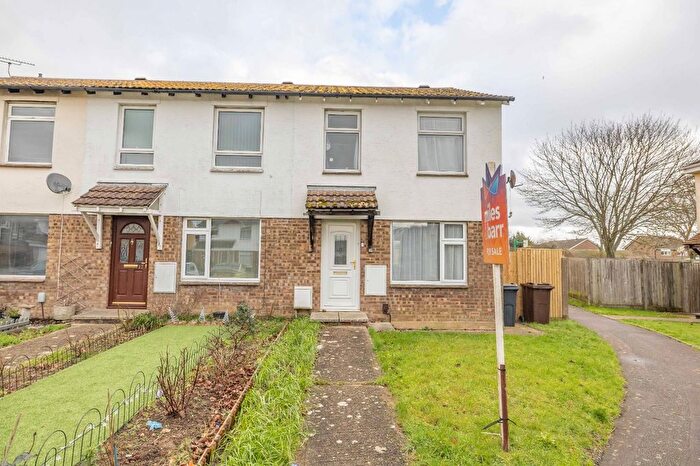
Properties for sale in Singleton South
Roads and Postcodes in Singleton South
Navigate through our locations to find the location of your next house in Singleton South, Ashford for sale or to rent.
| Streets | Postcodes |
|---|---|
| Badgers Den | TN23 5LE |
| Barnberry Close | TN23 5PW |
| Birchett | TN23 4XS |
| Bishops Green | TN23 5BQ |
| Bradbridge Green | TN23 5WA |
| Broughton Court | TN23 5UJ |
| Butt Field Road | TN23 5EB TN23 5EF |
| Covert | TN23 4XR |
| Culter Field | TN23 4YU |
| Eggringe | TN23 4XT |
| Grasslands | TN23 5WN |
| Green Fields Lane | TN23 5LH |
| Greyhound Chase | TN23 5LL |
| Harvest Way | TN23 5WP TN23 5WR TN23 5WW |
| Hedgerows | TN23 5WL |
| Heron Walk | TN23 5GX |
| Honey Field | TN23 4XP |
| Hoxton Close | TN23 5LS |
| Huntswood | TN23 4XN |
| Lakemead | TN23 4XX TN23 4XY TN23 4XZ |
| Lakeside | TN23 4GU |
| Langdale | TN23 4YZ |
| Long Beech | TN23 4XU |
| Longacre Road | TN23 5FR TN23 5FS |
| Manorfield | TN23 5YP TN23 5YW |
| Mead Walk | TN23 4YX |
| Meridian Court | TN23 5UZ |
| Millbrook Meadow | TN23 4XL |
| Normandy Way | TN23 5LN |
| Oakenpole | TN23 5XW |
| Old Orchard | TN23 4PY |
| Oxen Lease | TN23 4YT |
| Paddock Road | TN23 5WH |
| Postling | TN23 4UX |
| Quarry View | TN23 5WD |
| Red Tree Orchard | TN23 5PZ |
| Running Foxes Lane | TN23 5LP TN23 5LR |
| Rye Court | TN23 5WJ |
| Sabre Crescent | TN23 5LD |
| Silecroft Court | TN23 4UL |
| Strouts Road | TN23 5WB |
| Tithe Barn Lane | TN23 4YY |
| Whigham Close | TN23 5WF |
Transport near Singleton South
- FAQ
- Price Paid By Year
- Property Type Price
Frequently asked questions about Singleton South
What is the average price for a property for sale in Singleton South?
The average price for a property for sale in Singleton South is £254,866. This amount is 30% lower than the average price in Ashford. There are 1,370 property listings for sale in Singleton South.
What streets have the most expensive properties for sale in Singleton South?
The streets with the most expensive properties for sale in Singleton South are Quarry View at an average of £495,000, Strouts Road at an average of £443,000 and Whigham Close at an average of £430,000.
What streets have the most affordable properties for sale in Singleton South?
The streets with the most affordable properties for sale in Singleton South are Broughton Court at an average of £82,500, Silecroft Court at an average of £102,000 and Hoxton Close at an average of £116,900.
Which train stations are available in or near Singleton South?
Some of the train stations available in or near Singleton South are Ashford International, Pluckley and Wye.
Property Price Paid in Singleton South by Year
The average sold property price by year was:
| Year | Average Sold Price | Price Change |
Sold Properties
|
|---|---|---|---|
| 2025 | £257,280 | 1% |
55 Properties |
| 2024 | £253,626 | -0,1% |
63 Properties |
| 2023 | £253,872 | -4% |
55 Properties |
| 2022 | £265,280 | 8% |
85 Properties |
| 2021 | £244,965 | 6% |
88 Properties |
| 2020 | £229,142 | 9% |
63 Properties |
| 2019 | £208,796 | -4% |
70 Properties |
| 2018 | £216,398 | -3% |
75 Properties |
| 2017 | £221,922 | 12% |
74 Properties |
| 2016 | £195,540 | 3% |
94 Properties |
| 2015 | £189,830 | 7% |
93 Properties |
| 2014 | £177,408 | 6% |
69 Properties |
| 2013 | £167,304 | 4% |
68 Properties |
| 2012 | £160,102 | 3% |
63 Properties |
| 2011 | £154,560 | -10% |
59 Properties |
| 2010 | £170,743 | 5% |
87 Properties |
| 2009 | £161,668 | -7% |
88 Properties |
| 2008 | £173,315 | 4% |
75 Properties |
| 2007 | £166,015 | 7% |
143 Properties |
| 2006 | £154,675 | 8% |
179 Properties |
| 2005 | £142,878 | 11% |
109 Properties |
| 2004 | £126,820 | 5% |
87 Properties |
| 2003 | £120,153 | 22% |
107 Properties |
| 2002 | £93,820 | 21% |
120 Properties |
| 2001 | £73,730 | 7% |
114 Properties |
| 2000 | £68,627 | 15% |
118 Properties |
| 1999 | £58,267 | 9% |
110 Properties |
| 1998 | £53,011 | -13% |
105 Properties |
| 1997 | £59,766 | 7% |
141 Properties |
| 1996 | £55,846 | 10% |
83 Properties |
| 1995 | £50,419 | - |
104 Properties |
Property Price per Property Type in Singleton South
Here you can find historic sold price data in order to help with your property search.
The average Property Paid Price for specific property types in the last three years are:
| Property Type | Average Sold Price | Sold Properties |
|---|---|---|
| Semi Detached House | £287,346.00 | 39 Semi Detached Houses |
| Detached House | £365,280.00 | 23 Detached Houses |
| Terraced House | £261,623.00 | 69 Terraced Houses |
| Flat | £153,142.00 | 42 Flats |

