
Houses for sale in Romney Marsh, Ashford
House Prices in Romney Marsh
Properties in Romney Marsh have no sales history available within the last 3 years.
Romney Marsh is an area in Ashford, Kent with 42 households².
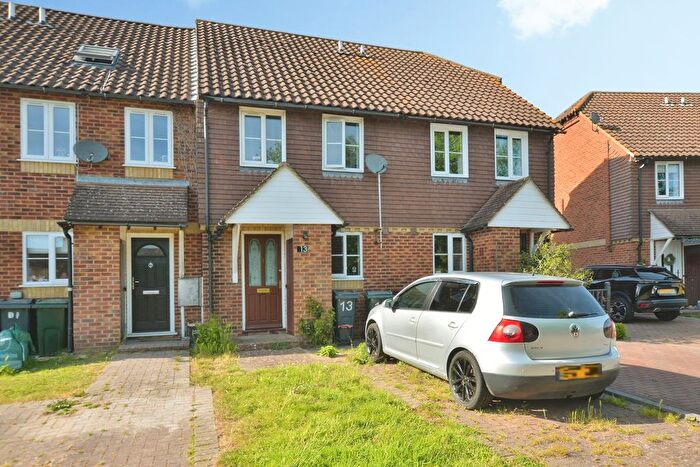
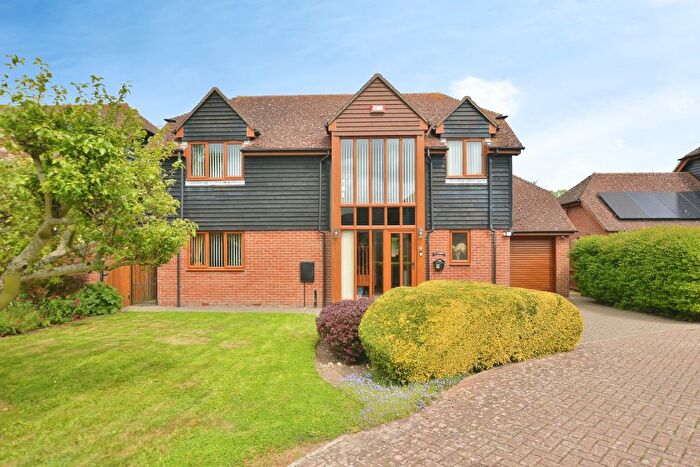
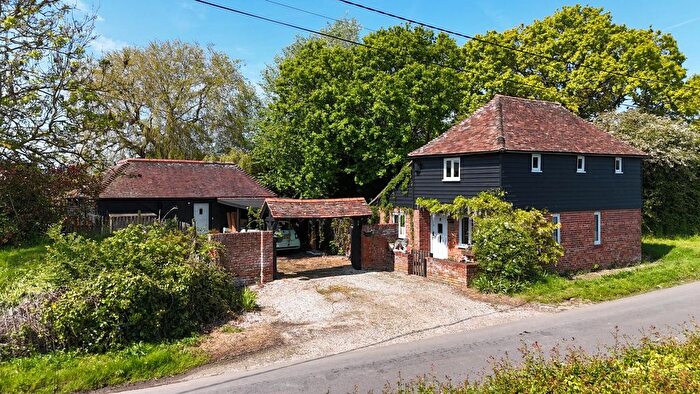
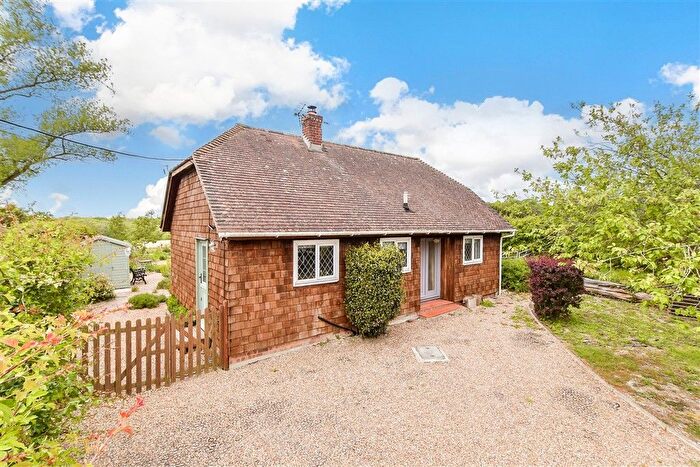
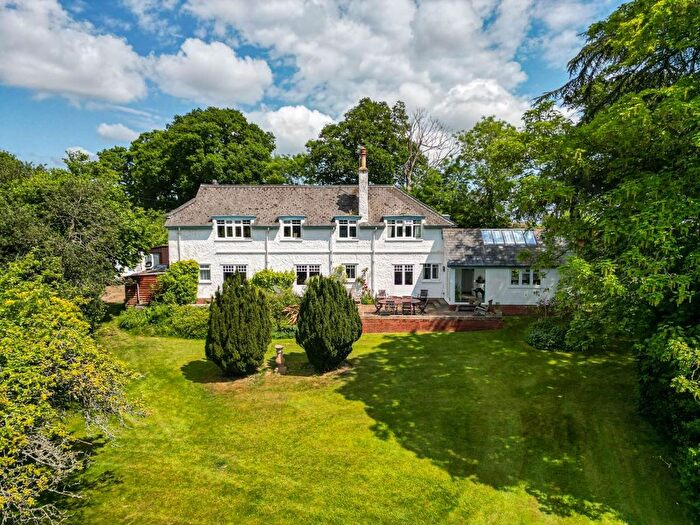
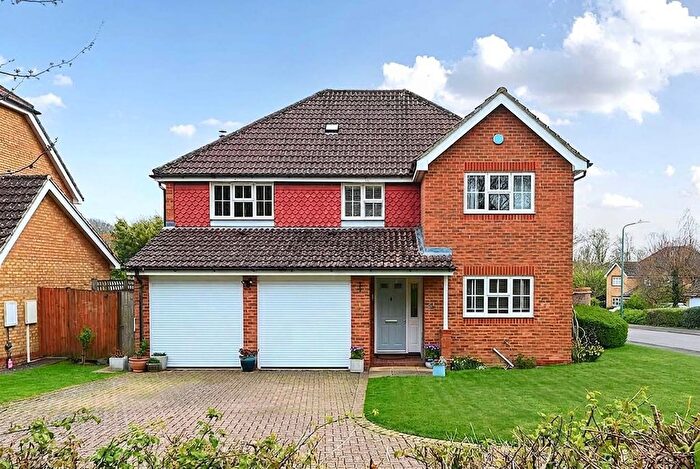
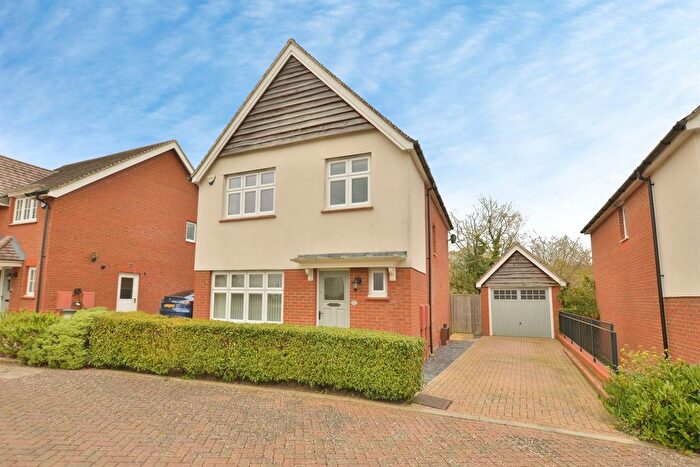
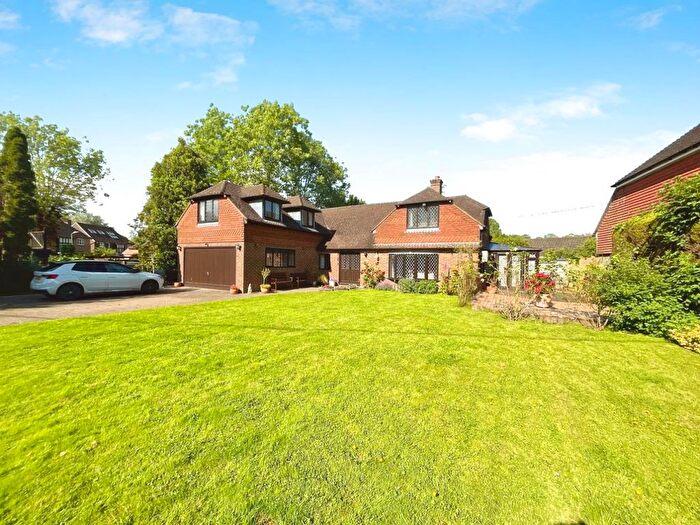
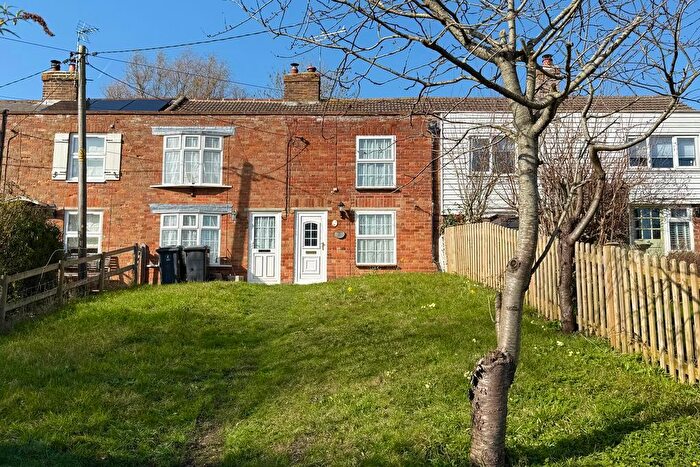
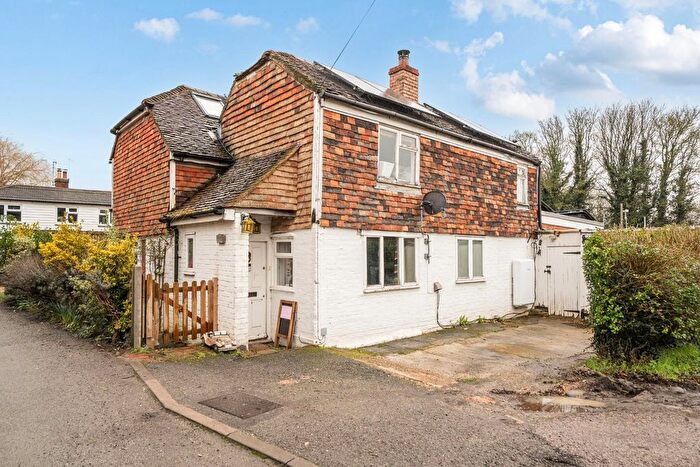
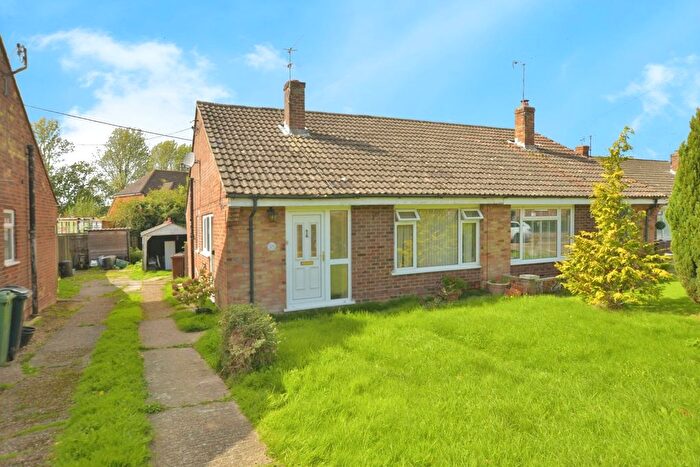
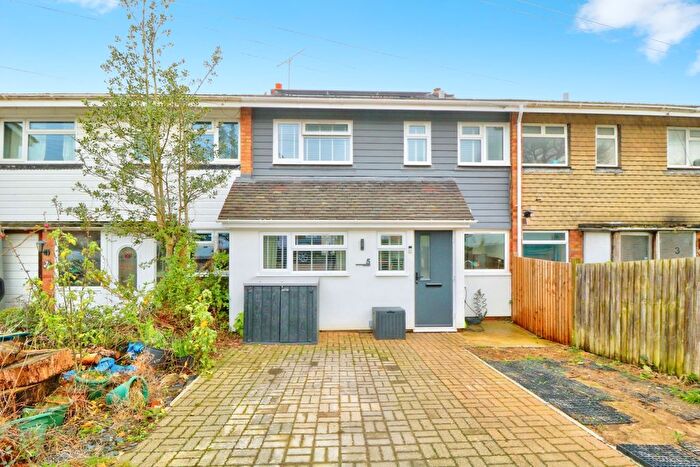
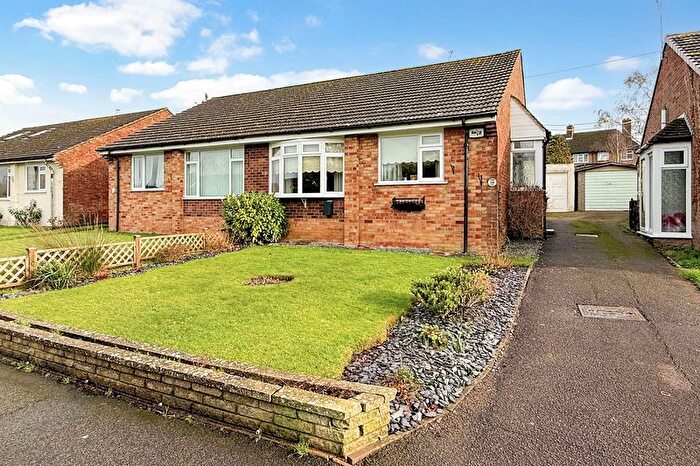
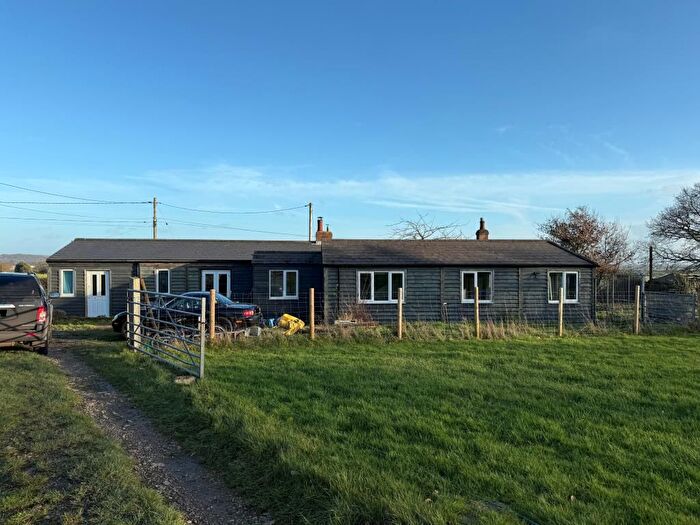
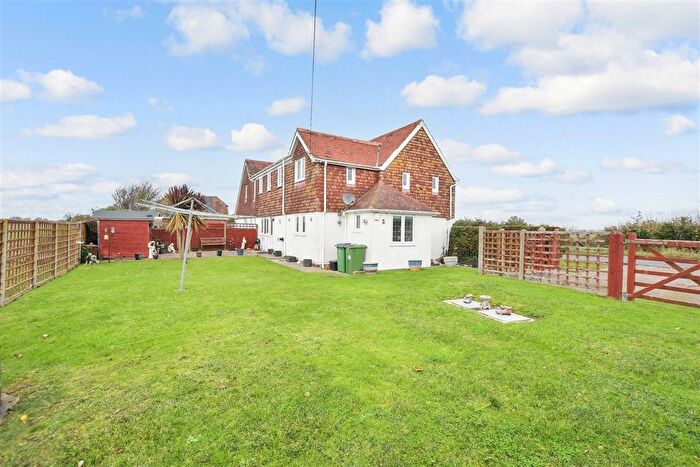
Previously listed properties in Romney Marsh
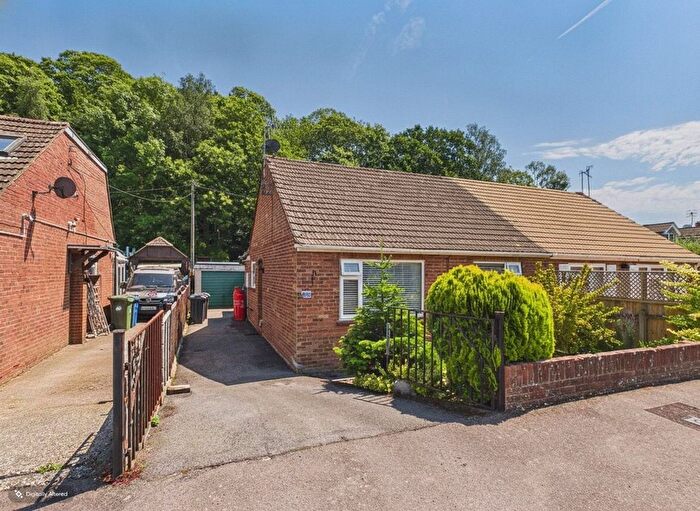
![]()
If you are looking to sell your house, let it out, or receive a property valuation, an expert can help you.
Click the button below to get started.

Roads and Postcodes in Romney Marsh
Navigate through our locations to find the location of your next house in Romney Marsh, Ashford for sale or to rent.
| Streets | Postcodes |
|---|---|
| Melon Lane | TN26 2QG TN26 2QF |
| Newchurch Lane | TN26 2QE |
| Station Road | TN26 2DG TN26 2DQ |
| Wey Street | TN26 2QH |
| TN25 7LD TN25 7LH TN26 2QB TN26 2QD TN26 2QJ |
Property price trends in Romney Marsh
According to the latest Land Registry data, the average home in Romney Marsh sold for £1,312,500 in 2022. That figure comes from 32 sales logged over the past 27 years.
Prices have continued to climb over the last three years. Compared with 2018, when the typical sale came in around £775,000, that's a rise of roughly 69.4%.
Looking back five years, average prices are up about 259.6% since 2016, a gain of around £947,500 in cash terms.
Zoom out to the past decade for the fuller picture. Back in 2012, homes here averaged £325,000, so the typical sold price has climbed about 303.8% since then, roughly 15% a year. Stretch the view to fifteen years and that annual pace eases back to about 8.9%.
Frequently asked questions about Romney Marsh
Which train stations are available in or near Romney Marsh?
Some of the train stations available in or near Romney Marsh are Ham Street, Appledore and Ashford International.
Property Price Paid in Romney Marsh by Year
The average sold property price by year was:
| Year | Average Sold Price | Price Change |
Sold Properties
|
|---|---|---|---|
| 2022 | £1,312,500 | 45% |
1 Property |
| 2020 | £725,000 | -7% |
1 Property |
| 2018 | £775,000 | 53% |
1 Property |
| 2016 | £365,000 | -47% |
1 Property |
| 2015 | £535,000 | 39% |
1 Property |
| 2012 | £325,000 | -39% |
1 Property |
| 2011 | £452,500 | -62% |
2 Properties |
| 2010 | £735,000 | 59% |
2 Properties |
| 2009 | £302,500 | 87% |
2 Properties |
| 2008 | £40,000 | -813% |
1 Property |
