
Houses for sale & to rent in TN26 2DT, Hamstreet, Weald South, Ashford
House Prices in TN26 2DT, Hamstreet, Weald South
Properties in TN26 2DT have no sales history available within the last 3 years. TN26 2DT is a postcode in Hamstreet located in Weald South, an area in Ashford, Kent, with 3 households².
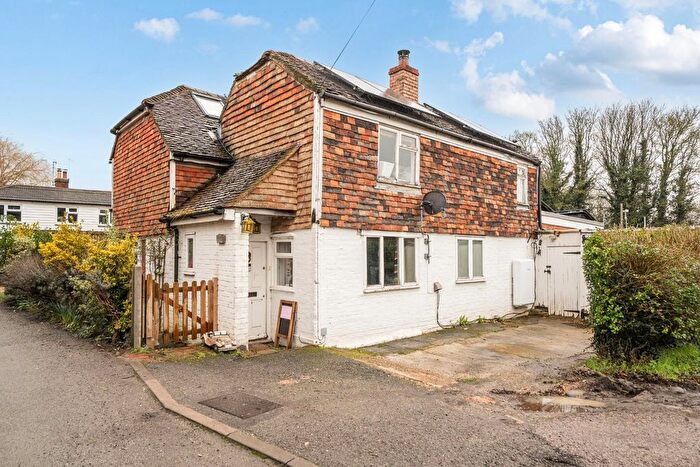
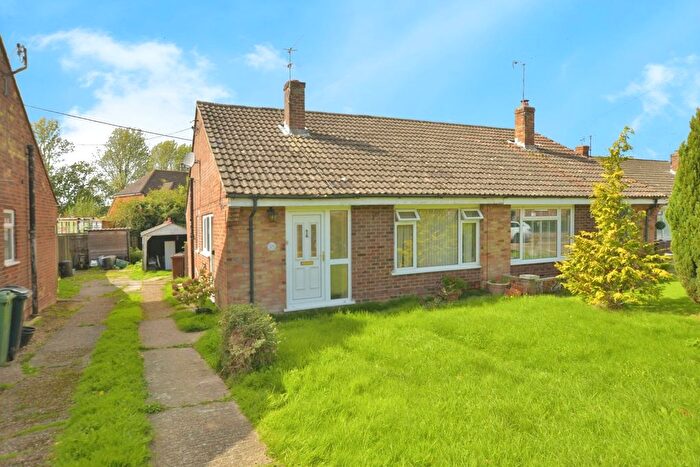
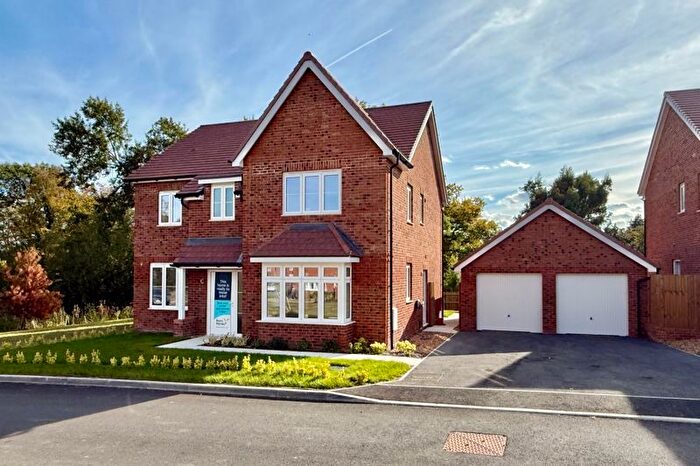
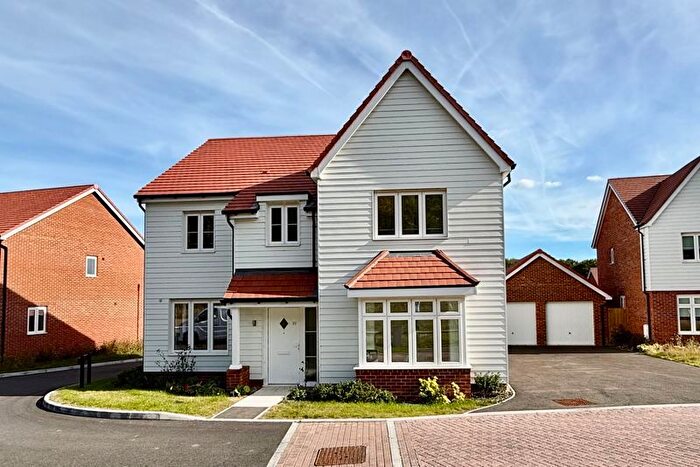
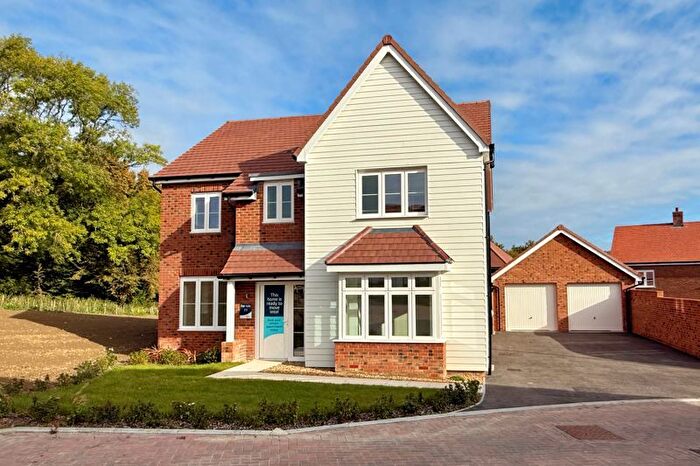
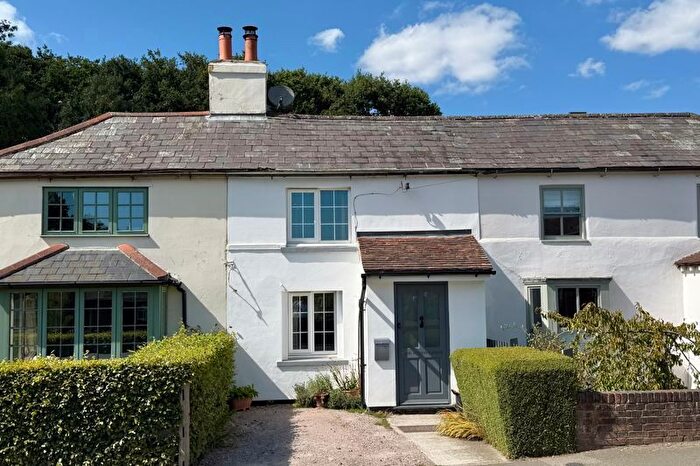
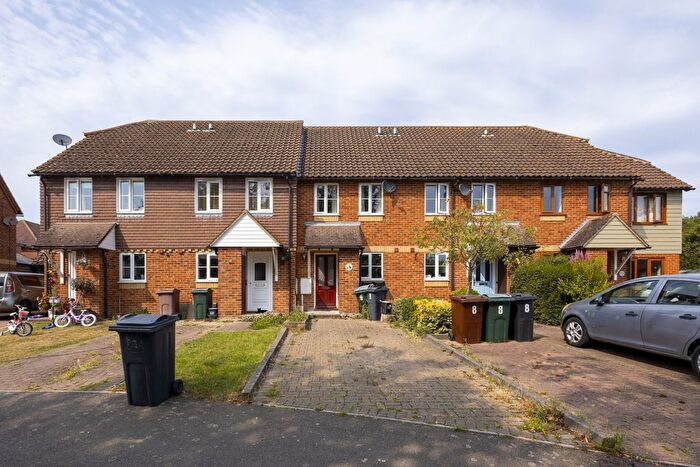
Properties for sale near TN26 2DT, Hamstreet
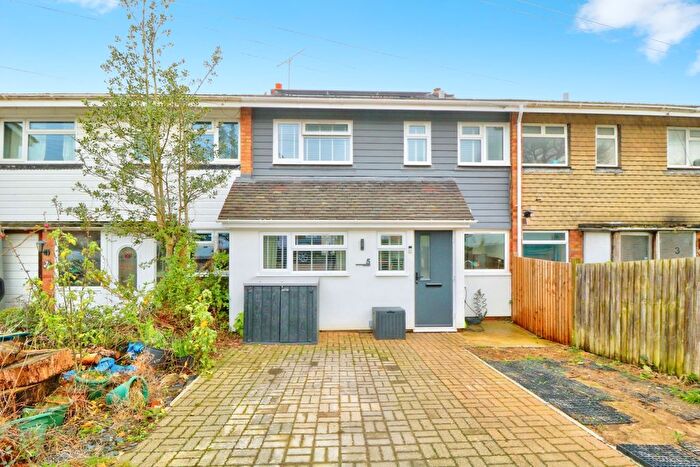
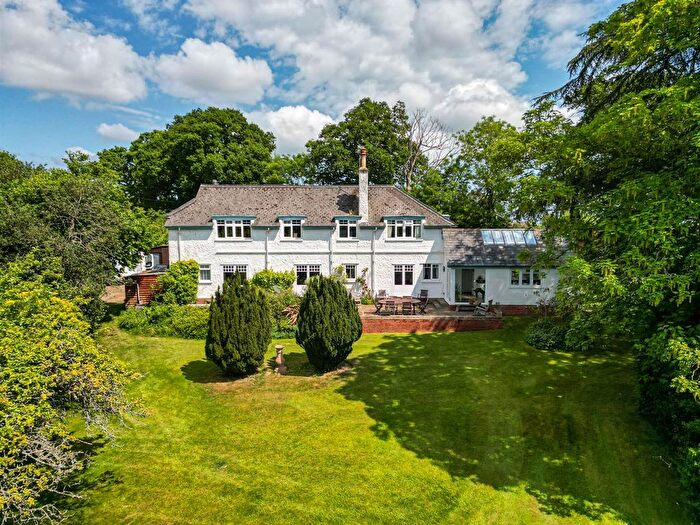
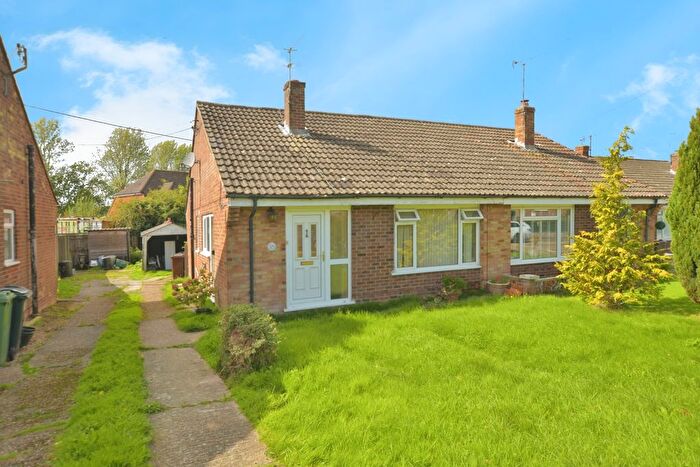
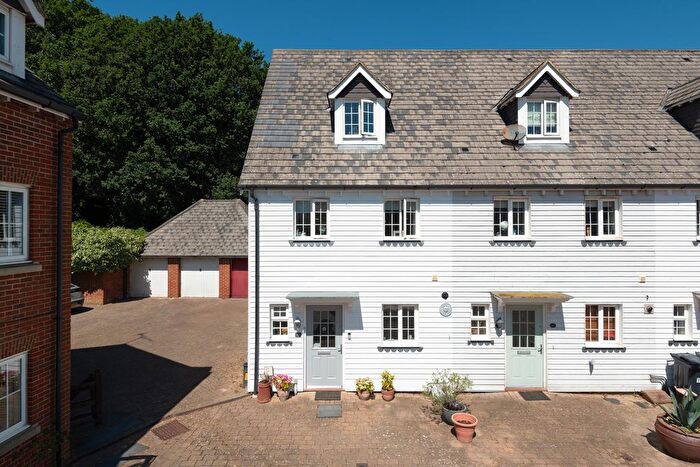
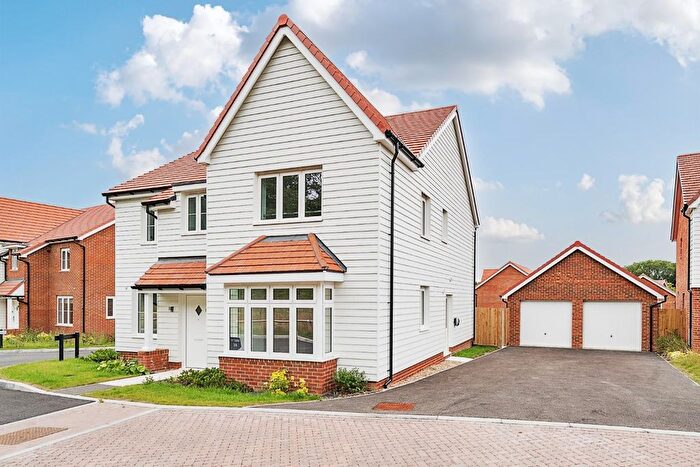
Previously listed properties near TN26 2DT, Hamstreet

![]()
If you are looking to sell your house, let it out, or receive a property valuation, an expert can help you.
Click the button below to get started.


Price Paid in Hamstreet, TN26 2DT, Weald South
ELLENDENE Hamstreet, TN26 2DT, Weald South Ashford
Property ELLENDENE has been sold 3 times. The last time it was sold was in 02/12/2013 and the sold price was £250,000.00.
This detached house, sold as a freehold on 02/12/2013, is a 131 sqm detached house with an EPC rating of C.
| Date | Price | Property Type | Tenure | Classification |
|---|---|---|---|---|
| 02/12/2013 | £250,000.00 | Detached House | freehold | Established Building |
| 06/07/2000 | £148,000.00 | Detached House | freehold | Established Building |
| 12/12/1997 | £40,000.00 | Detached House | freehold | Established Building |
1 Hamstreet, TN26 2DT, Weald South Ashford
Property 1 has been sold 1 time. The last time it was sold was in 23/07/2010 and the sold price was £250,000.00.
This semi detached house, sold as a freehold on 23/07/2010, is a 110 sqm semi-detached house with an EPC rating of F.
| Date | Price | Property Type | Tenure | Classification |
|---|---|---|---|---|
| 23/07/2010 | £250,000.00 | Semi Detached House | freehold | Established Building |
Postcodes in Hamstreet, Weald South
Navigate through other locations in Hamstreet, Weald South, Ashford to see more property listings for sale or to rent.
Transport near TN26 2DT, Hamstreet
-
 Ham Street Station
 -
Appledore Station
-
Ashford International Station
-
Pluckley Station
-
Westenhanger Station
-
Wye Station
-
Sandling Station
-
Rye Station
House price paid reports for TN26 2DT, Hamstreet
Click on the buttons below to see price paid reports by year or property price:
- Price Paid By Year
Property Price Paid in TN26 2DT, Hamstreet by Year
The average sold property price by year was:
| Year | Average Sold Price | Price Change |
Sold Properties
|
|---|---|---|---|
| 2013 | £250,000 | - |
1 Property |
| 2010 | £250,000 | 41% |
1 Property |
| 2000 | £148,000 | 73% |
1 Property |
| 1997 | £40,000 | - |
1 Property |