
Houses for sale & to rent in TN26 3QG, Weald South, Ashford
House Prices in TN26 3QG, Weald South
Properties in TN26 3QG have an average house price of £985k and had 1 Property Transaction within the last 3 years.¹ TN26 3QG is a postcode in Weald South, an area in Ashford, Kent, with 2 households², where the most expensive property was sold for £985k.
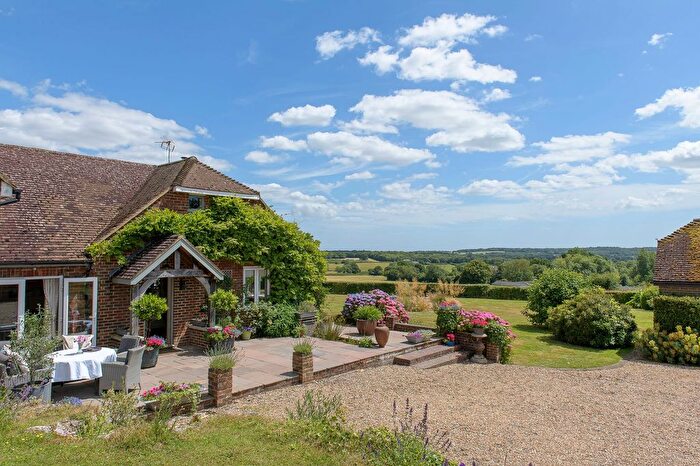
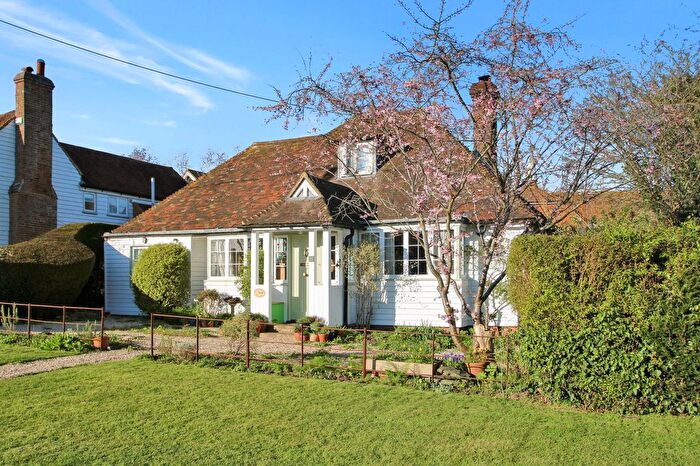
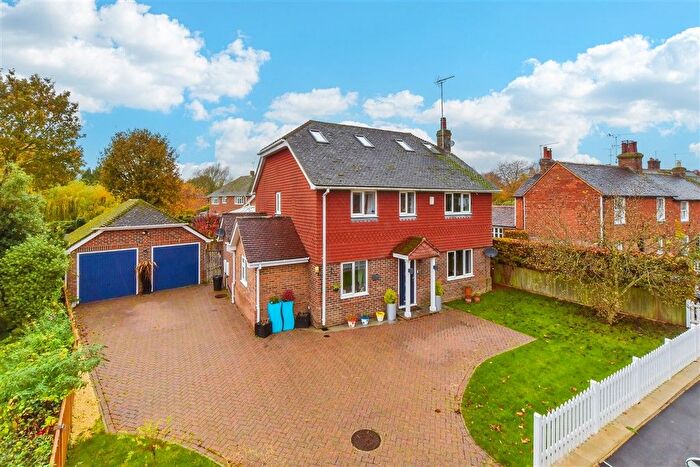
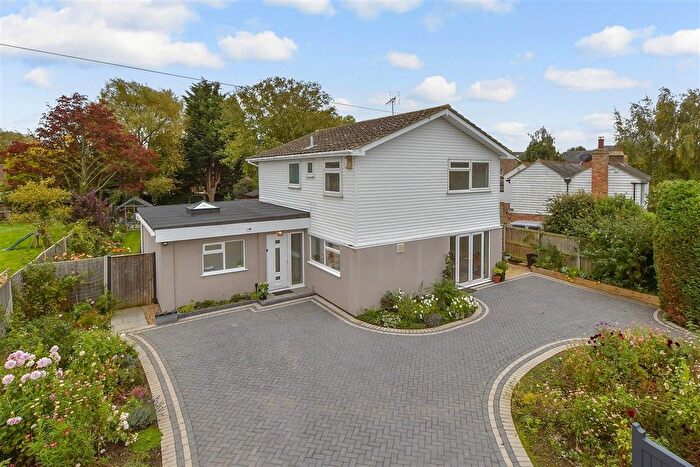
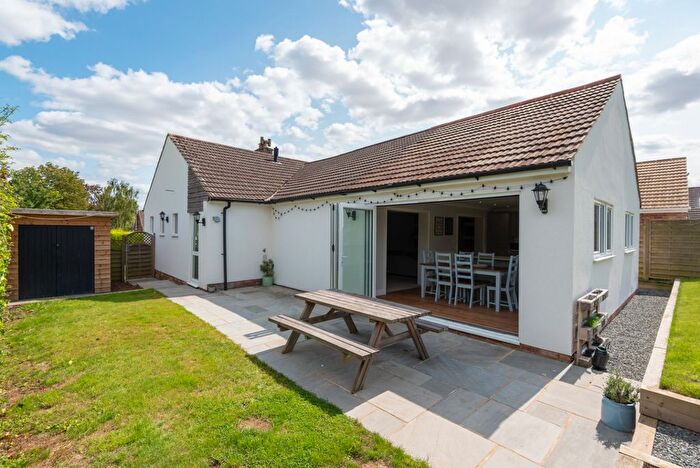
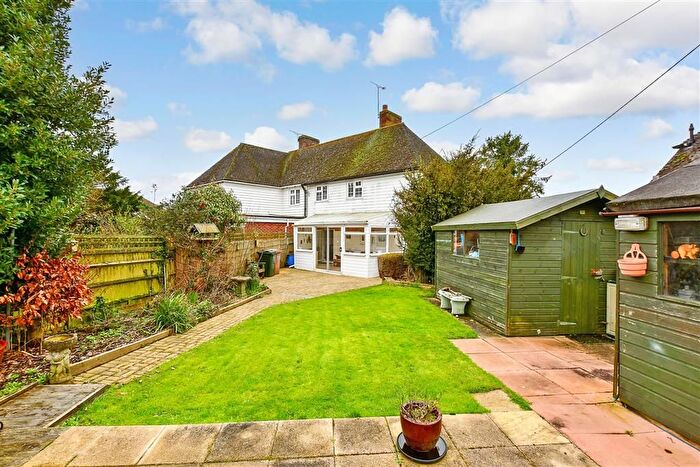
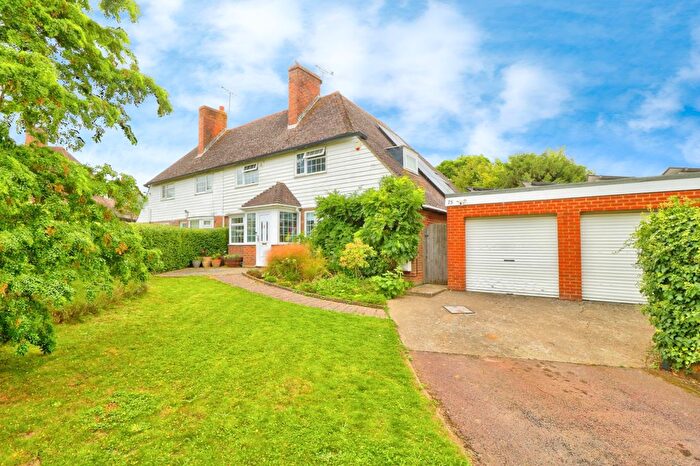
Properties for sale near TN26 3QG
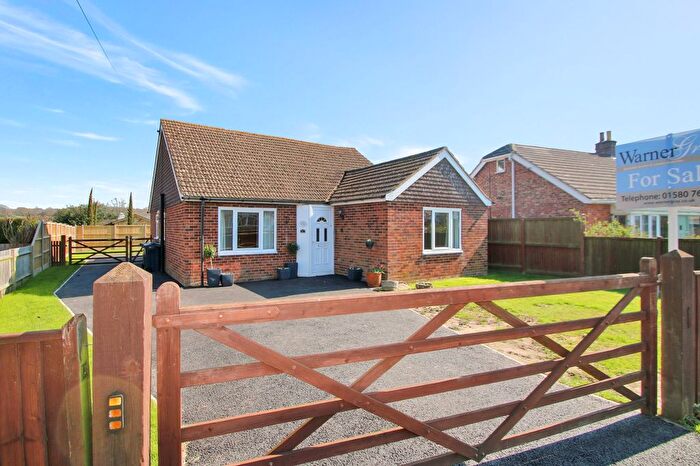

![]()
If you are looking to sell your house, let it out, or receive a property valuation, an expert can help you.
Click the button below to get started.
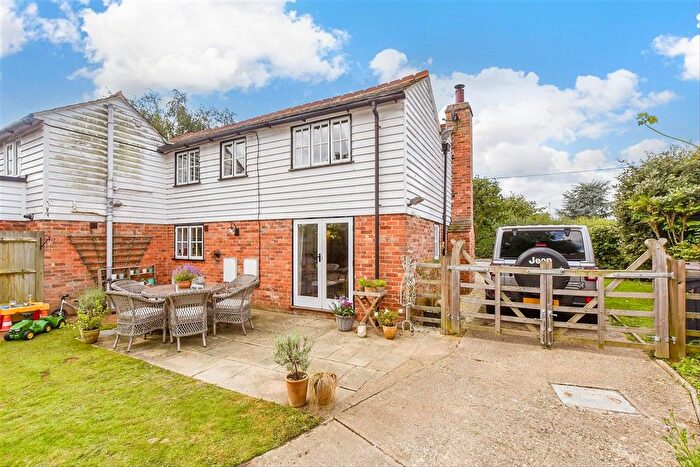
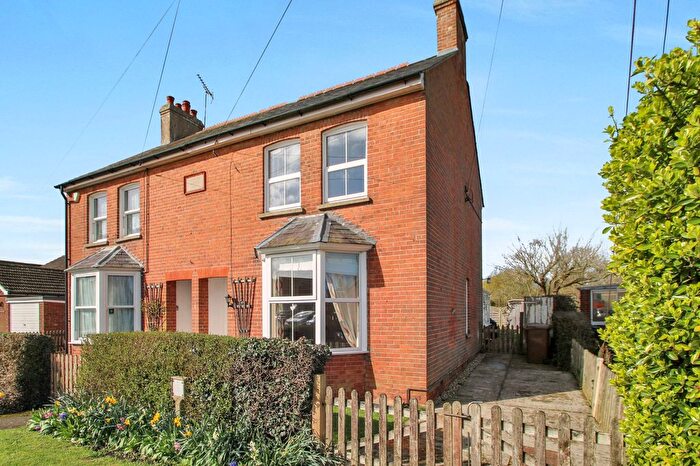
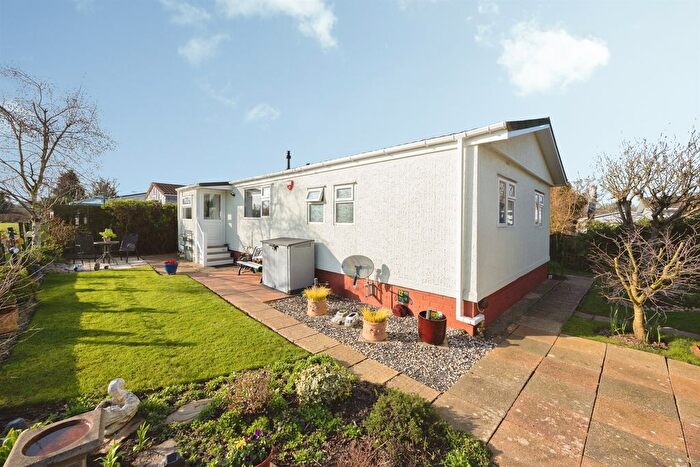
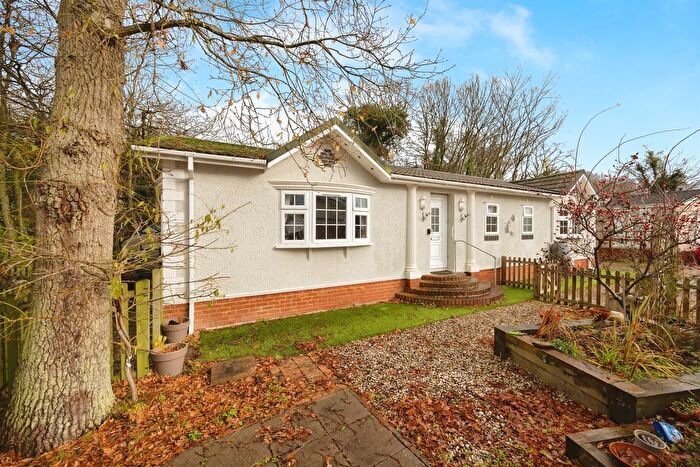
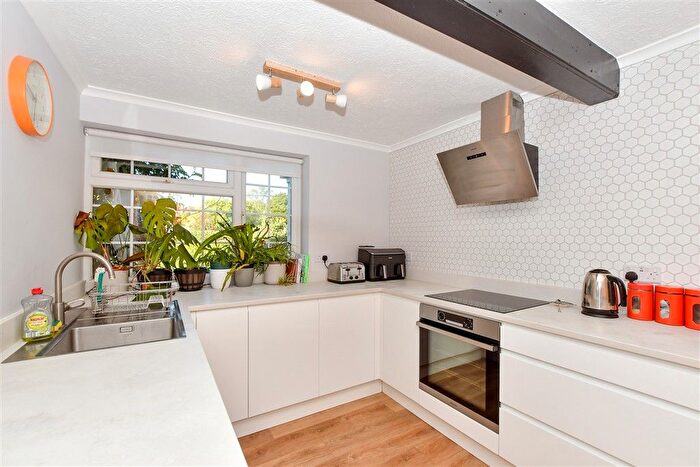
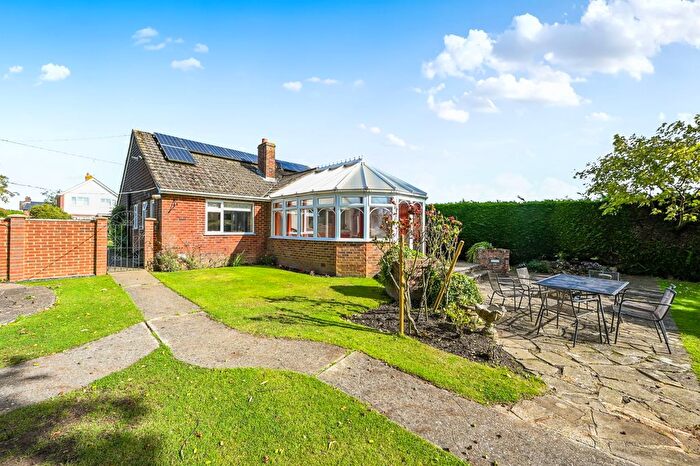
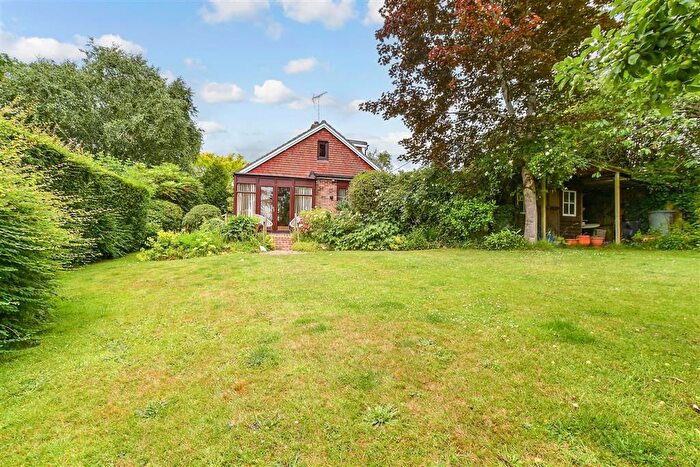
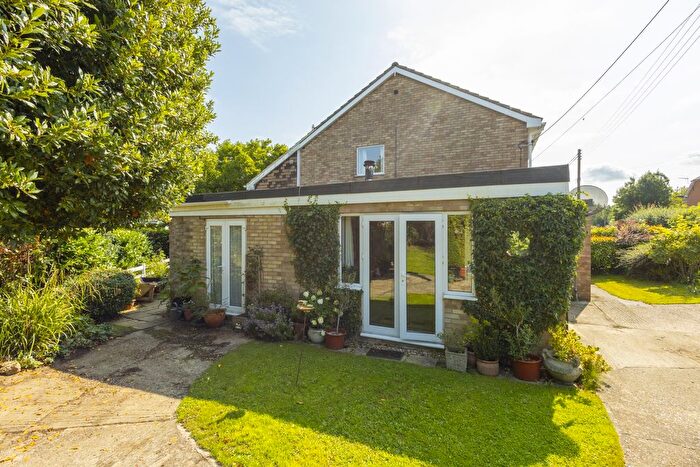
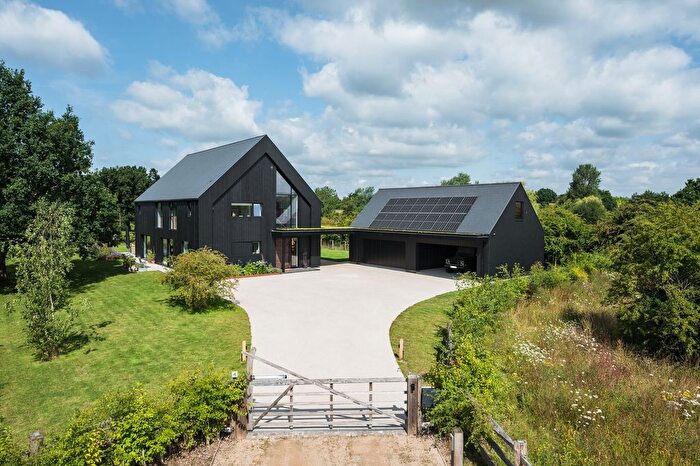
Previously listed properties near TN26 3QG
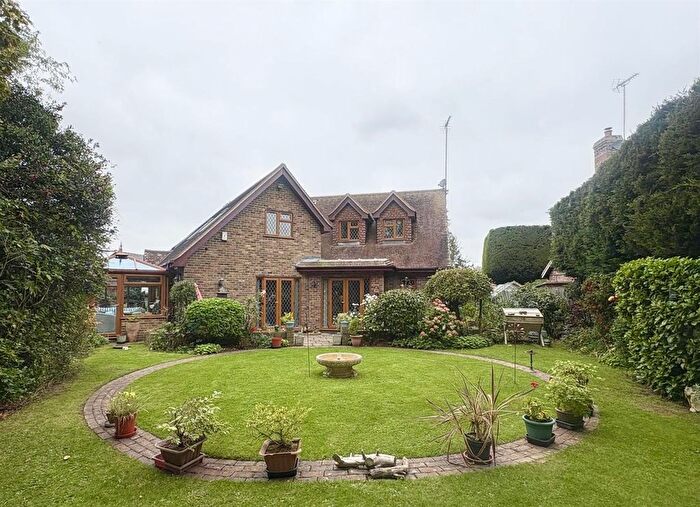
![]()
If you are looking to sell your house, let it out, or receive a property valuation, an expert can help you.
Click the button below to get started.


Price Paid in TN26 3QG, Weald South
THE CHAPEL TN26 3QG, Weald South Ashford
Property THE CHAPEL has been sold 3 times. The last time it was sold was in 25/09/2025 and the sold price was £985,000.00.
This is a Detached House which was sold as a freehold in 25/09/2025
| Date | Price | Property Type | Tenure | Classification |
|---|---|---|---|---|
| 25/09/2025 | £985,000.00 | Detached House | freehold | Established Building |
| 01/08/2011 | £210,000.00 | Detached House | freehold | Established Building |
| 21/05/2009 | £210,000.00 | Detached House | freehold | Established Building |
CHAPEL COTTAGE TN26 3QG, Weald South Ashford
Property CHAPEL COTTAGE has been sold 1 time. The last time it was sold was in 29/06/2012 and the sold price was £460,000.00.
This detached house, sold as a freehold on 29/06/2012, is a 159 sqm detached house with an EPC rating of D.
| Date | Price | Property Type | Tenure | Classification |
|---|---|---|---|---|
| 29/06/2012 | £460,000.00 | Detached House | freehold | Established Building |
MYRTLE COTTAGE TN26 3QG, Weald South Ashford
Property MYRTLE COTTAGE has been sold 1 time. The last time it was sold was in 20/07/2005 and the sold price was £389,000.00.
This is a Detached House which was sold as a freehold in 20/07/2005
| Date | Price | Property Type | Tenure | Classification |
|---|---|---|---|---|
| 20/07/2005 | £389,000.00 | Detached House | freehold | Established Building |
Transport near TN26 3QG
-
 Ham Street Station
 -
Appledore Station
-
Pluckley Station
-
Ashford International Station
-
Headcorn Station
-
Charing Station
-
Rye Station
-
Wye Station
House price paid reports for TN26 3QG
Click on the buttons below to see price paid reports by year or property price:
- Price Paid By Year
- Property Type Price
Property Price Paid in TN26 3QG by Year
The average sold property price by year was:
| Year | Average Sold Price | Price Change |
Sold Properties
|
|---|---|---|---|
| 2025 | £985,000 | 53% |
1 Property |
| 2012 | £460,000 | 54% |
1 Property |
| 2011 | £210,000 | - |
1 Property |
| 2009 | £210,000 | -85% |
1 Property |
| 2005 | £389,000 | - |
1 Property |
Property Price per Property Type in TN26 3QG
Here you can find historic sold price data in order to help with your property search.
The average Property Paid Price for specific property types in the last three years are:
| Property Type | Average Sold Price | Sold Properties |
|---|---|---|
| Detached House | £985,000.00 | 1 Detached House |