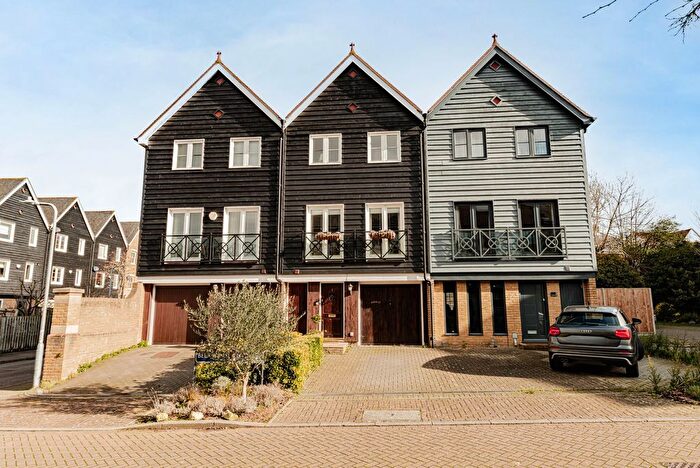
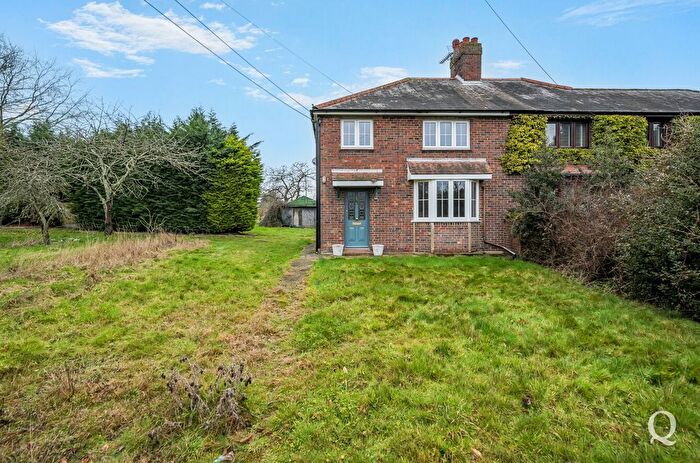
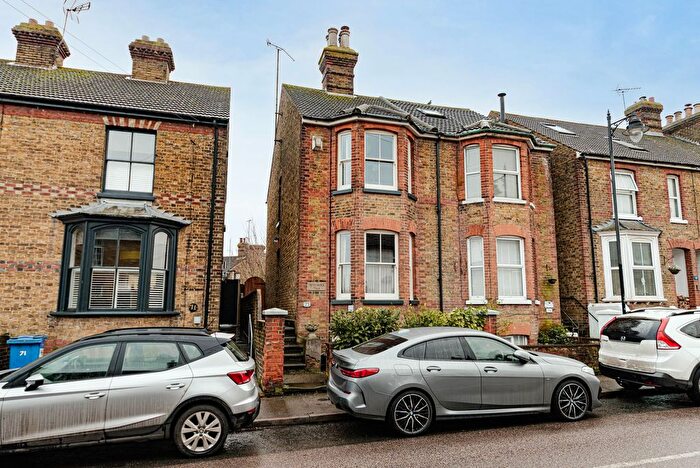
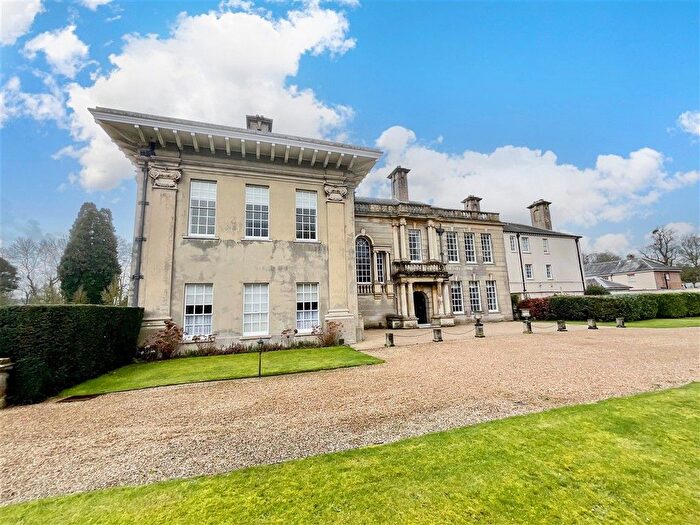
Houses for sale & to rent in East Downs, Faversham
House Prices in East Downs
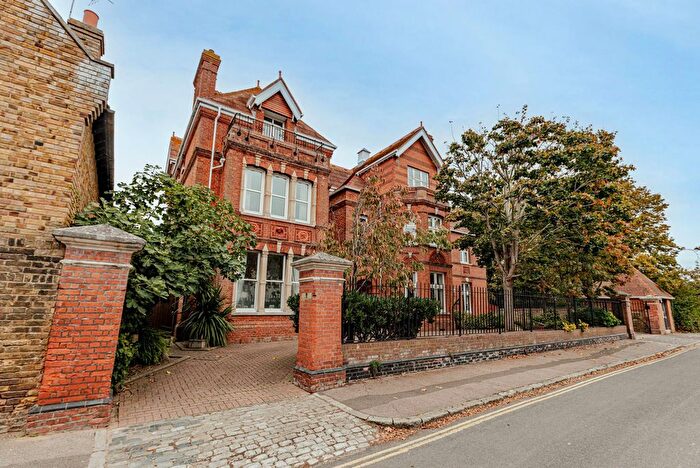
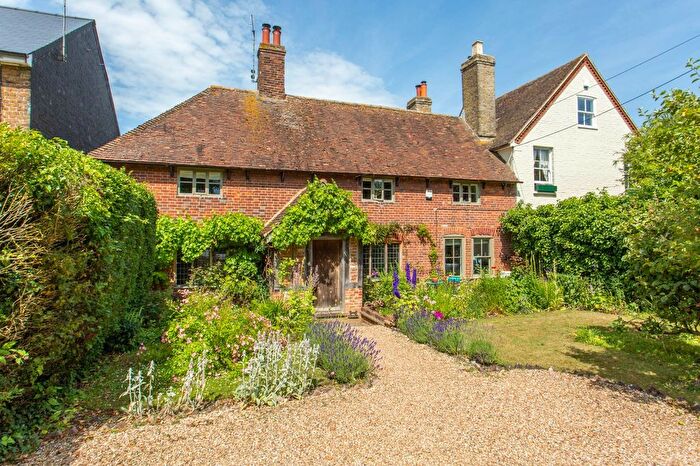
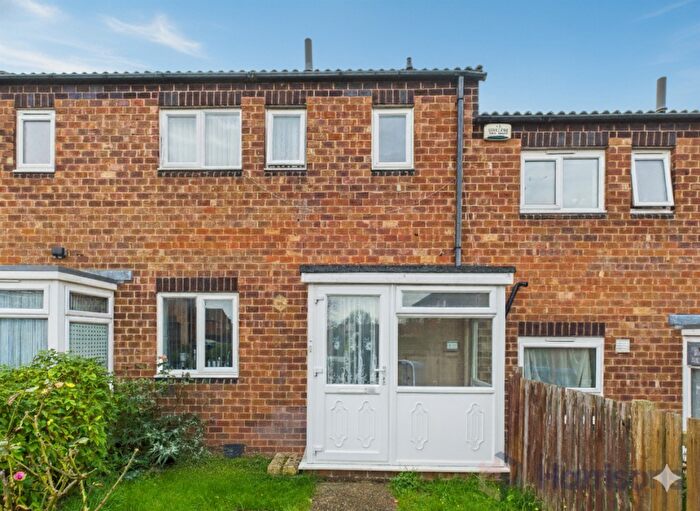
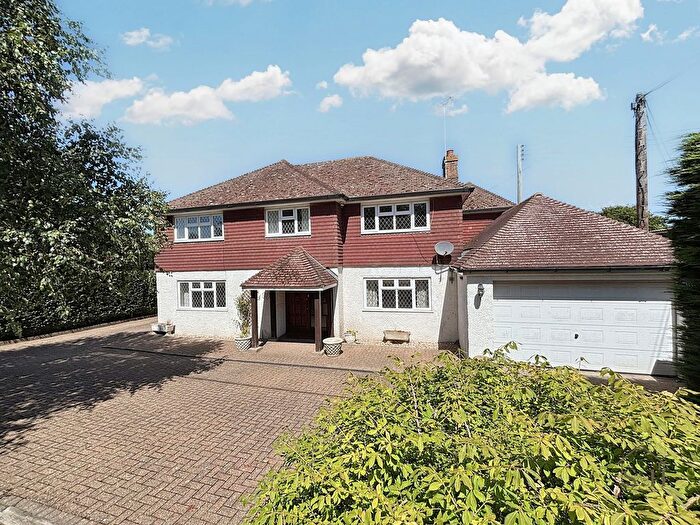
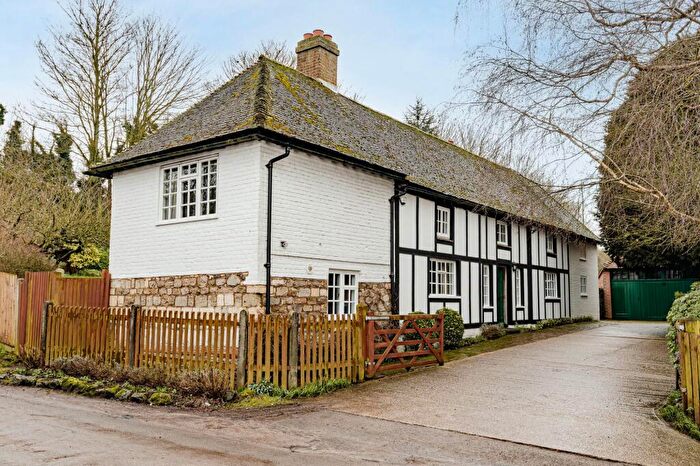
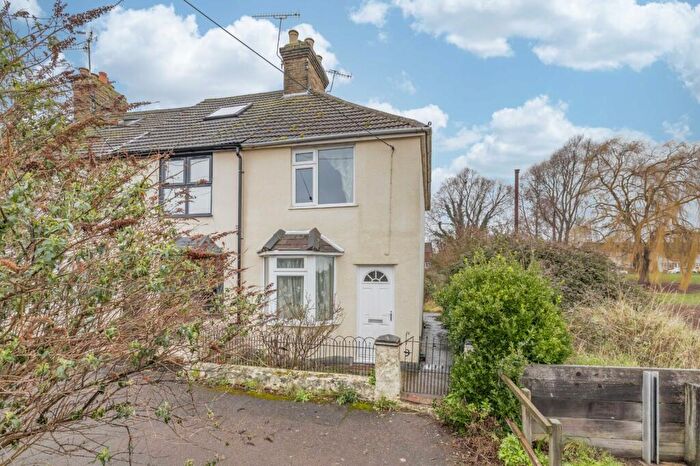
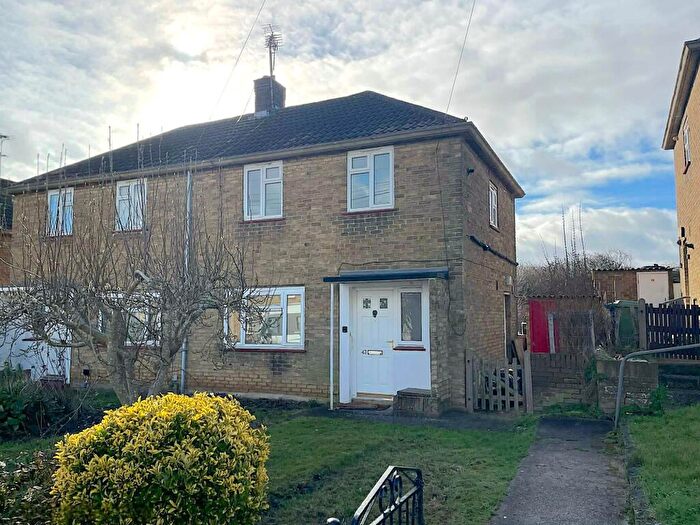
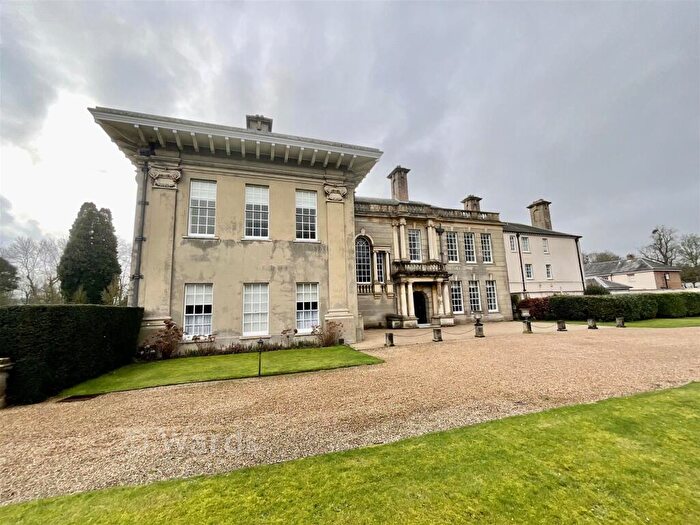
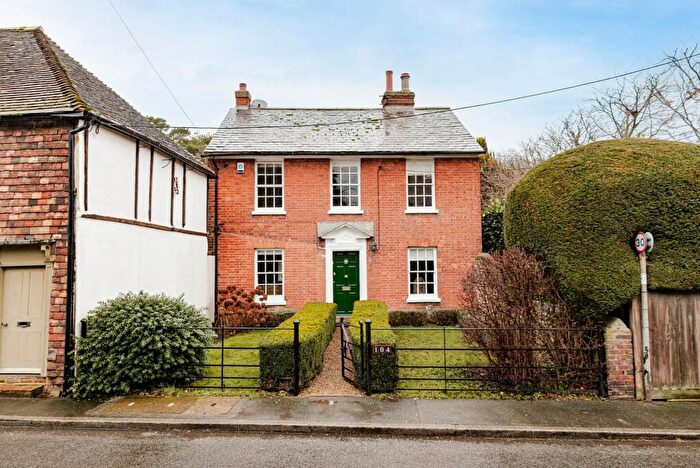
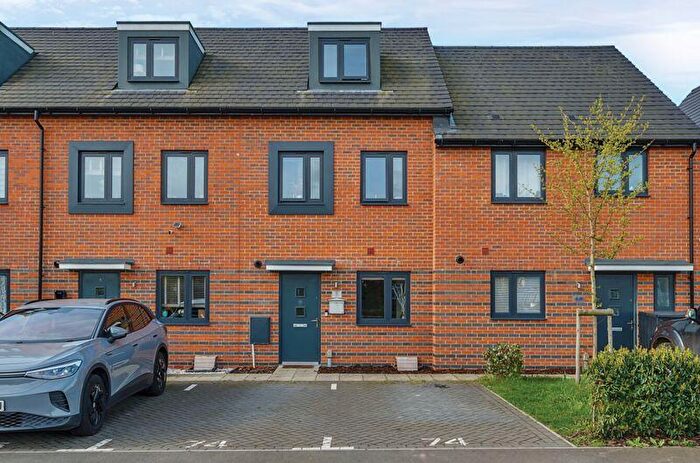
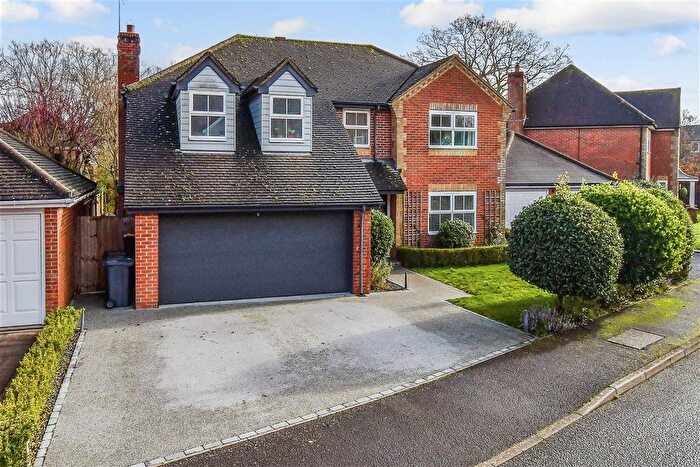
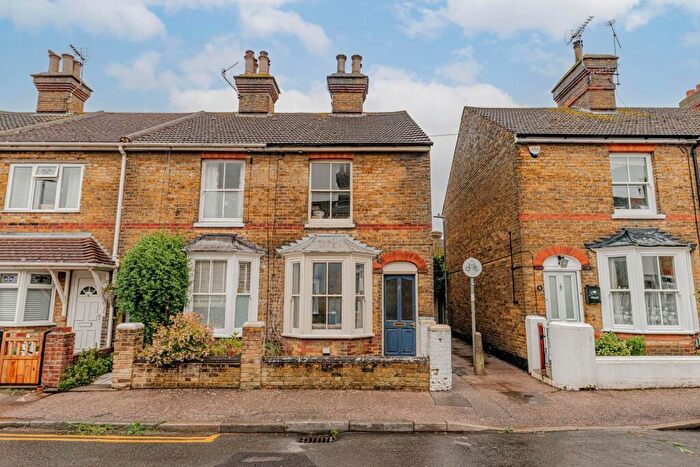
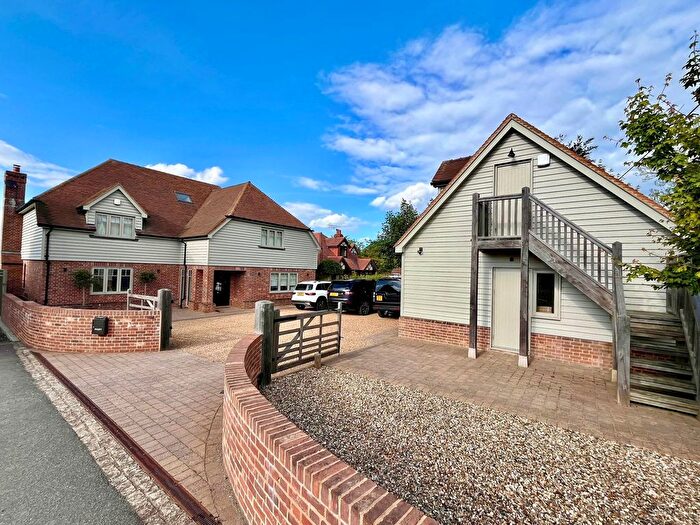
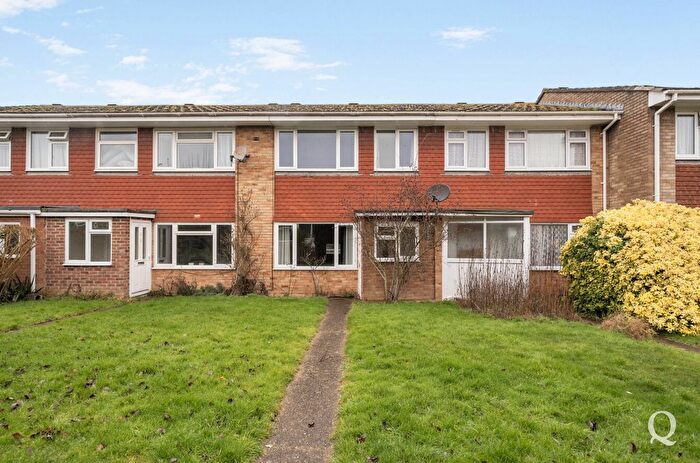
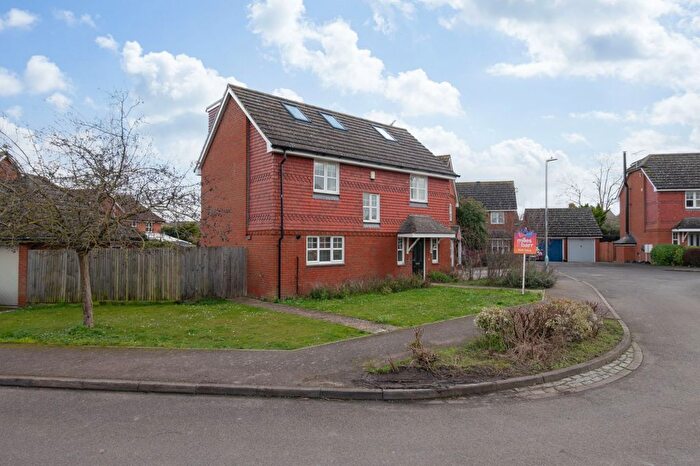
Properties in East Downs have an average house price of £667,394.00 and had 45 Property Transactions within the last 3 years¹.
East Downs is an area in Faversham, Kent with 755 households², where the most expensive property was sold for £1,825,000.00.
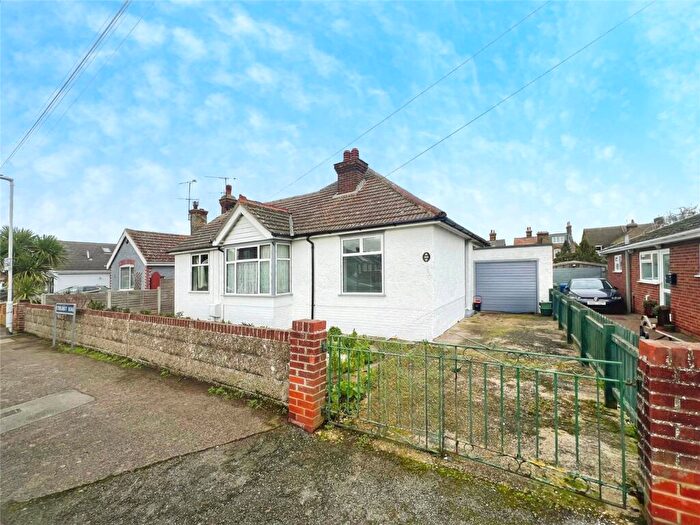
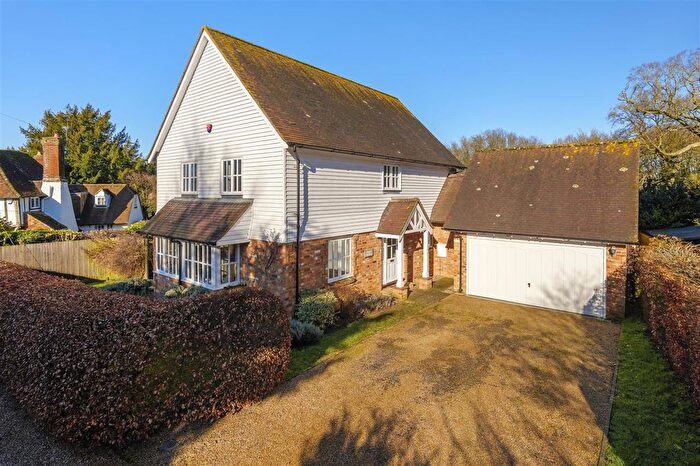
Properties for sale in East Downs
Roads and Postcodes in East Downs
Navigate through our locations to find the location of your next house in East Downs, Faversham for sale or to rent.
| Streets | Postcodes |
|---|---|
| Abbots Hill | ME13 0RR |
| Abbots Hill Cottages | ME13 0EP |
| Almshouse Road | ME13 0JL |
| Ashford Road | ME13 0NN ME13 0NT ME13 0NX ME13 0NY ME13 0NZ ME13 0NS ME13 0NU |
| Bagshill Road | ME13 0PB ME13 0PD |
| Bay Bank Place | ME13 0EE |
| Bayfield | ME13 0EF |
| Belmont | ME13 0HE ME13 0HH |
| Belmont Park | ME13 0HB |
| Bethel Row | ME13 0JR |
| Box Lane | ME13 0RU |
| Brogdale Farm Cottages | ME13 8XU |
| Brogdale Road | ME13 8YA ME13 0DN ME13 8XZ |
| Brook Meadow Cottages | ME13 0EY |
| Cades Orchard | ME13 0EL |
| Cedar Terrace | ME13 8XX |
| Church Road | ME13 0HL |
| Dawsons Row | ME13 8TZ |
| Derbies Court Cottages | ME13 0HN |
| Eastling Road | ME13 0AJ ME13 0AN ME13 0DW ME13 0RT ME13 0RX ME13 0AG ME13 0AL ME13 0RY ME13 0RZ ME13 0SA ME13 0SB |
| Elverland Lane | ME13 0SP |
| Faversham Road | ME13 0JN ME13 0AQ |
| Finches End | ME13 0EQ |
| Hansletts Lane | ME13 0RN ME13 0RS ME13 0RW |
| Hillside Road | ME13 0JE ME13 0JF |
| Holbeam Road | ME13 0HS |
| Housefield Road | ME13 0JB ME13 0EJ |
| Jubilee Cottages | ME13 0PJ |
| Kennaways | ME13 0AA |
| Kennelling Road | ME13 0JQ |
| Kettle Hill | ME13 0BB |
| Kettle Hill Road | ME13 0BA |
| Leaveland Corner | ME13 0EX |
| Leaveland Cottages | ME13 0NP |
| London Road | ME13 0RH |
| Lorenden Cottages | ME13 0EN |
| Manor Lees | ME13 0BE |
| Meadowbank | ME13 0EZ |
| Meesons Close | ME13 0AW |
| Mill Cottages | ME13 0BN |
| Millens Row | ME13 0NW |
| Mummery Court | ME13 0ES |
| Newnham Lane | ME13 0AS ME13 0AT |
| Newnham Valley | ME13 0SF |
| Otterden Road | ME13 0BW ME13 0BL |
| Park Terrace | ME13 0PH |
| Parsonage Farm Cottages | ME13 0PN |
| Parsonage Stocks Road | ME13 0ET |
| Porters Lane | ME13 0DR |
| Prospect Place | ME13 0BQ |
| Scooks Hill | ME13 0AD |
| Scotts Lane | ME13 0QY |
| Stalisfield Green | ME13 0HX ME13 0HY ME13 0JA |
| Stalisfield Road | ME13 0HU ME13 0HW ME13 0AB ME13 0HT |
| Sunnyside | ME13 0HZ |
| Syndale Valley | ME13 0RL |
| The Bungalows | ME13 8XY |
| The Street | ME13 0AY ME13 0AZ |
| Throwley Road | ME13 0JT ME13 0PF |
| Tong Lane | ME13 0BH ME13 0BJ |
| Vicarage Lane | ME13 8XT |
| Water Lane | ME13 8TY ME13 8UA ME13 8XS |
| Well Lane | ME13 0SD |
| White Hill | ME13 9QL |
| Wilgate Green | ME13 0PW |
| Workhouse Road | ME13 0JP ME13 0NR |
| ME13 0AX ME13 0BD ME13 0BG ME13 0DS ME13 0DU ME13 0EG ME13 0EW ME13 0HD ME13 0HP ME13 0HR ME13 0JG ME13 0JH ME13 0JJ ME13 0JS ME13 0LA ME13 0LB ME13 0LD ME13 0NL ME13 0PE ME13 0PQ ME13 0AE ME13 0BP ME13 0BS ME13 0DD ME13 0HA ME13 0HJ ME13 0JU ME13 0PG ME13 0RJ |
Transport near East Downs
- FAQ
- Price Paid By Year
- Property Type Price
Frequently asked questions about East Downs
What is the average price for a property for sale in East Downs?
The average price for a property for sale in East Downs is £667,394. This amount is 78% higher than the average price in Faversham. There are 3,248 property listings for sale in East Downs.
What streets have the most expensive properties for sale in East Downs?
The streets with the most expensive properties for sale in East Downs are Tong Lane at an average of £1,200,000, Abbots Hill at an average of £1,045,000 and Cades Orchard at an average of £977,500.
What streets have the most affordable properties for sale in East Downs?
The streets with the most affordable properties for sale in East Downs are Park Terrace at an average of £162,000, Dawsons Row at an average of £207,500 and Leaveland Cottages at an average of £211,375.
Which train stations are available in or near East Downs?
Some of the train stations available in or near East Downs are Faversham, Selling and Teynham.
Property Price Paid in East Downs by Year
The average sold property price by year was:
| Year | Average Sold Price | Price Change |
Sold Properties
|
|---|---|---|---|
| 2025 | £646,500 | 9% |
18 Properties |
| 2024 | £590,375 | -32% |
14 Properties |
| 2023 | £779,269 | 20% |
13 Properties |
| 2022 | £619,575 | 3% |
18 Properties |
| 2021 | £598,879 | 3% |
27 Properties |
| 2020 | £579,907 | -4% |
16 Properties |
| 2019 | £603,812 | 16% |
16 Properties |
| 2018 | £506,360 | 9% |
25 Properties |
| 2017 | £461,935 | 9% |
14 Properties |
| 2016 | £419,375 | -1% |
12 Properties |
| 2015 | £422,300 | 19% |
14 Properties |
| 2014 | £342,846 | -34% |
18 Properties |
| 2013 | £458,368 | 22% |
19 Properties |
| 2012 | £355,687 | -28% |
16 Properties |
| 2011 | £454,750 | 14% |
10 Properties |
| 2010 | £390,526 | 1% |
19 Properties |
| 2009 | £384,950 | 2% |
20 Properties |
| 2008 | £378,220 | 26% |
22 Properties |
| 2007 | £281,607 | -36% |
19 Properties |
| 2006 | £381,958 | -3% |
30 Properties |
| 2005 | £392,222 | 19% |
9 Properties |
| 2004 | £318,242 | -13% |
27 Properties |
| 2003 | £360,452 | 31% |
21 Properties |
| 2002 | £247,174 | 10% |
40 Properties |
| 2001 | £223,634 | 8% |
26 Properties |
| 2000 | £205,865 | 28% |
19 Properties |
| 1999 | £148,221 | 12% |
39 Properties |
| 1998 | £129,860 | -8% |
29 Properties |
| 1997 | £140,026 | 16% |
20 Properties |
| 1996 | £116,950 | 22% |
33 Properties |
| 1995 | £90,738 | - |
21 Properties |
Property Price per Property Type in East Downs
Here you can find historic sold price data in order to help with your property search.
The average Property Paid Price for specific property types in the last three years are:
| Property Type | Average Sold Price | Sold Properties |
|---|---|---|
| Semi Detached House | £400,805.00 | 9 Semi Detached Houses |
| Detached House | £799,187.00 | 32 Detached Houses |
| Terraced House | £212,875.00 | 4 Terraced Houses |

