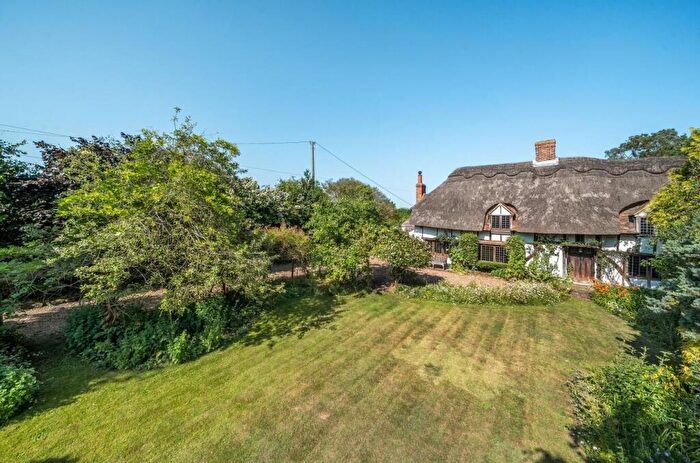
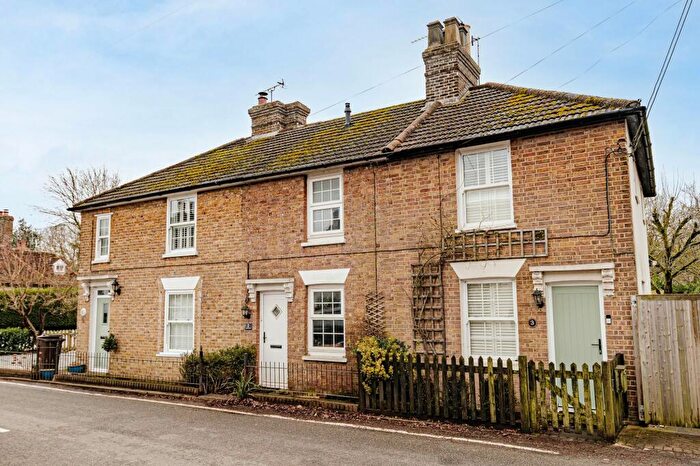
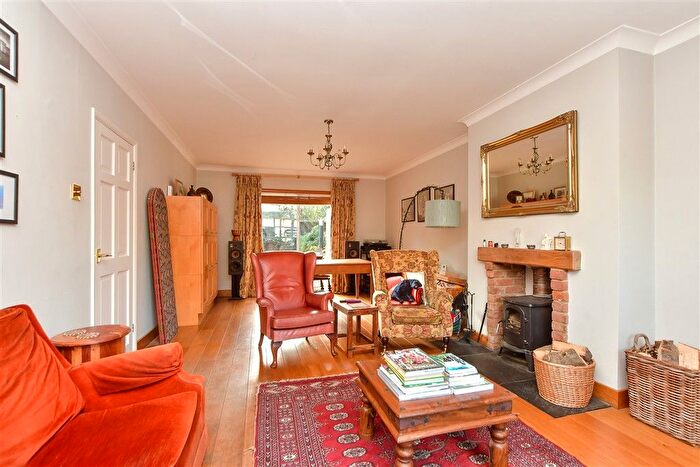
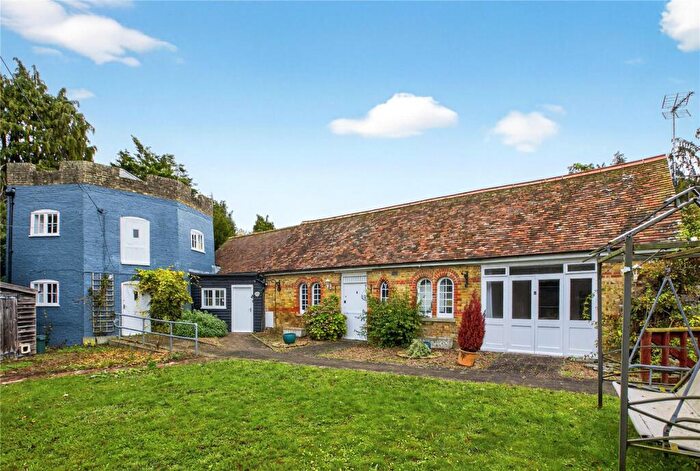
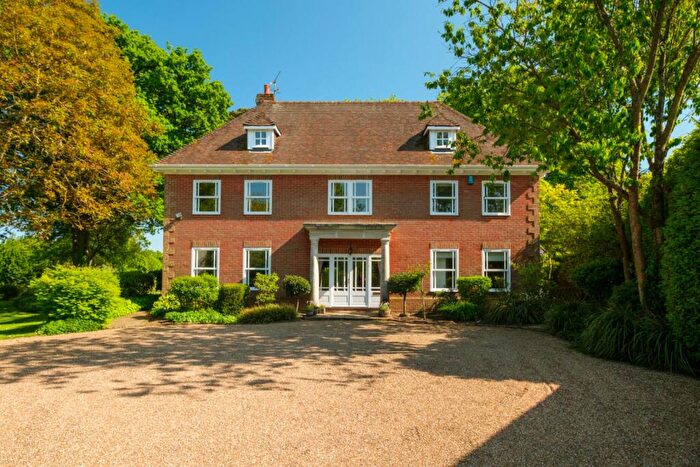
Houses for sale & to rent in East Downs, Sittingbourne
House Prices in East Downs
Properties in East Downs have an average house price of £458,737.00 and had 21 Property Transactions within the last 3 years¹.
East Downs is an area in Sittingbourne, Kent with 369 households², where the most expensive property was sold for £835,000.00.
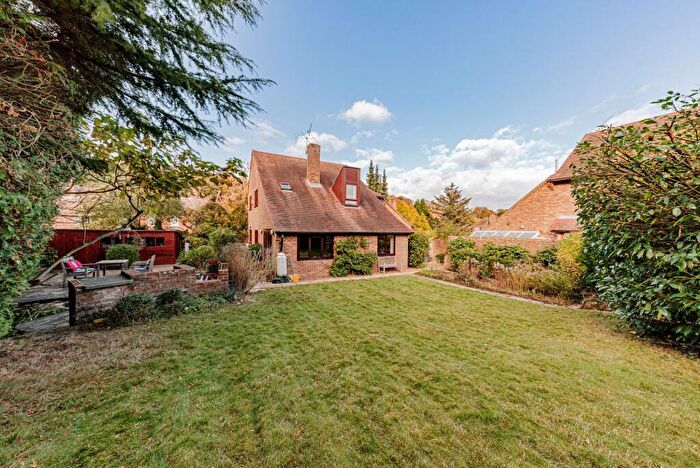
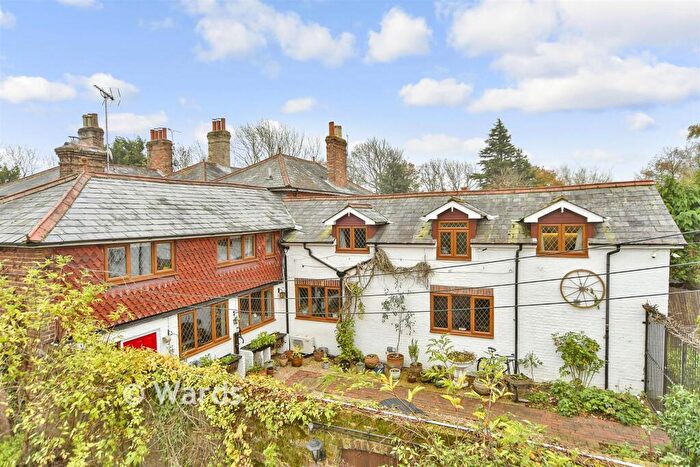
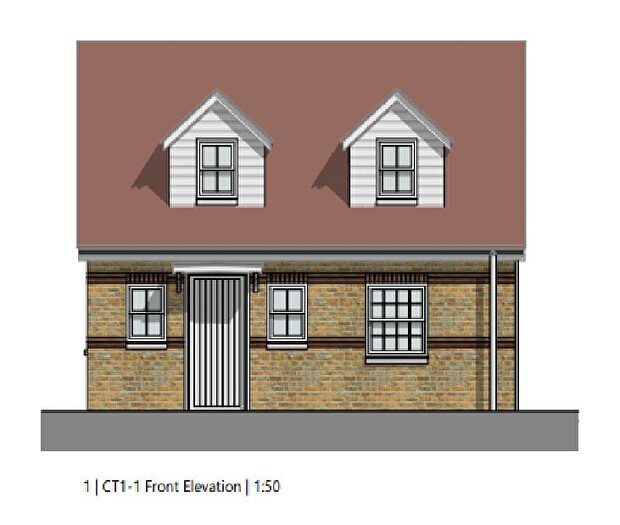
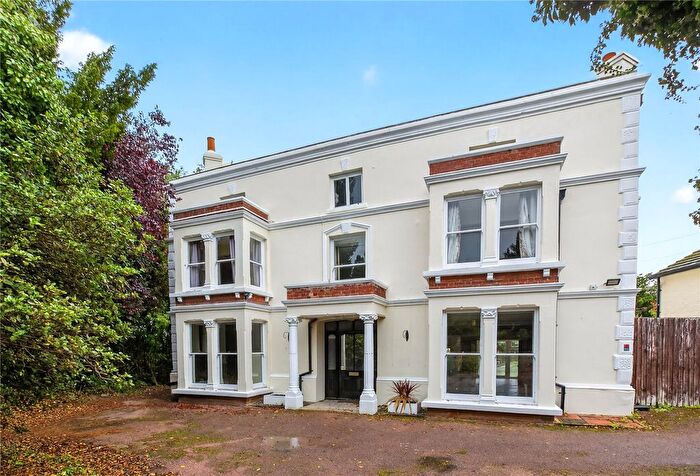
Properties for sale in East Downs
Previously listed properties in East Downs
Roads and Postcodes in East Downs
Navigate through our locations to find the location of your next house in East Downs, Sittingbourne for sale or to rent.
| Streets | Postcodes |
|---|---|
| Bailiffs Cottages | ME9 0JU |
| Bevan Terrace | ME9 0BY |
| Brewster Cottages | ME9 0AY |
| Chequers Hill | ME9 0BL ME9 0BN |
| Chequers Hill Road | ME9 0PA |
| Church Lane | ME9 0AZ ME9 0BD ME9 0BB |
| Down Court Road | ME9 0AT |
| Homestall Road | ME9 0HF ME9 0BE |
| Lady Margaret Manor Road | ME9 0NR ME9 0NT |
| Newnham Lane | ME9 0LH |
| Newnham Valley | ME9 0LB ME9 0LD |
| North Down | ME9 0BQ |
| Old Lenham Road | ME9 0BX |
| Palace Cottages | ME9 0AU |
| Primrose Place | ME9 0DA |
| Seed Road | ME9 0NA ME9 0NQ |
| Sharsted Hill | ME9 0JX ME9 0LT |
| Sharsted Road | ME9 0HG |
| Solomons Cottages | ME9 0NU |
| Stuppington Cottages | ME9 0HB |
| Swedish Houses | ME9 0NE |
| The Retreat | ME9 0DB |
| The Street | ME9 0BG ME9 0BH ME9 0BP ME9 0BS ME9 0LL ME9 0LN ME9 0LQ ME9 0LW ME9 0LG ME9 0LU |
| West End Cottages | ME9 0BZ |
| Wineycock | ME9 0NB |
| ME9 0NX ME9 0AX ME9 0JR ME9 0JS ME9 0JT ME9 0NG |
Transport near East Downs
- FAQ
- Price Paid By Year
- Property Type Price
Frequently asked questions about East Downs
What is the average price for a property for sale in East Downs?
The average price for a property for sale in East Downs is £458,737. This amount is 45% higher than the average price in Sittingbourne. There are 197 property listings for sale in East Downs.
What streets have the most expensive properties for sale in East Downs?
The streets with the most expensive properties for sale in East Downs are Brewster Cottages at an average of £700,000, The Street at an average of £527,000 and Chequers Hill at an average of £491,833.
What streets have the most affordable properties for sale in East Downs?
The streets with the most affordable properties for sale in East Downs are The Retreat at an average of £195,000, Bevan Terrace at an average of £285,000 and Primrose Place at an average of £321,000.
Which train stations are available in or near East Downs?
Some of the train stations available in or near East Downs are Teynham, Sittingbourne and Lenham.
Property Price Paid in East Downs by Year
The average sold property price by year was:
| Year | Average Sold Price | Price Change |
Sold Properties
|
|---|---|---|---|
| 2025 | £441,500 | 15% |
4 Properties |
| 2024 | £376,611 | -49% |
9 Properties |
| 2023 | £559,749 | 28% |
8 Properties |
| 2022 | £402,124 | -34% |
16 Properties |
| 2021 | £538,892 | 29% |
14 Properties |
| 2020 | £384,115 | 1% |
13 Properties |
| 2019 | £380,576 | -33% |
13 Properties |
| 2018 | £508,000 | 1% |
5 Properties |
| 2017 | £502,454 | 25% |
11 Properties |
| 2016 | £375,937 | 8% |
16 Properties |
| 2015 | £346,227 | 21% |
11 Properties |
| 2014 | £272,399 | 8% |
10 Properties |
| 2013 | £250,285 | -7% |
7 Properties |
| 2012 | £267,033 | 1% |
15 Properties |
| 2011 | £264,000 | -42% |
3 Properties |
| 2010 | £374,750 | 48% |
10 Properties |
| 2009 | £196,500 | -34% |
5 Properties |
| 2008 | £262,449 | -8% |
10 Properties |
| 2007 | £283,070 | -21% |
10 Properties |
| 2006 | £343,687 | 24% |
16 Properties |
| 2005 | £261,222 | 3% |
18 Properties |
| 2004 | £252,687 | 12% |
16 Properties |
| 2003 | £223,142 | 12% |
21 Properties |
| 2002 | £195,626 | 7% |
15 Properties |
| 2001 | £182,118 | 26% |
21 Properties |
| 2000 | £133,968 | -10% |
16 Properties |
| 1999 | £146,916 | 39% |
18 Properties |
| 1998 | £88,966 | -14% |
15 Properties |
| 1997 | £100,996 | 2% |
13 Properties |
| 1996 | £99,087 | -6% |
27 Properties |
| 1995 | £105,161 | - |
9 Properties |
Property Price per Property Type in East Downs
Here you can find historic sold price data in order to help with your property search.
The average Property Paid Price for specific property types in the last three years are:
| Property Type | Average Sold Price | Sold Properties |
|---|---|---|
| Semi Detached House | £367,142.00 | 7 Semi Detached Houses |
| Detached House | £640,333.00 | 9 Detached Houses |
| Terraced House | £260,099.00 | 5 Terraced Houses |

