
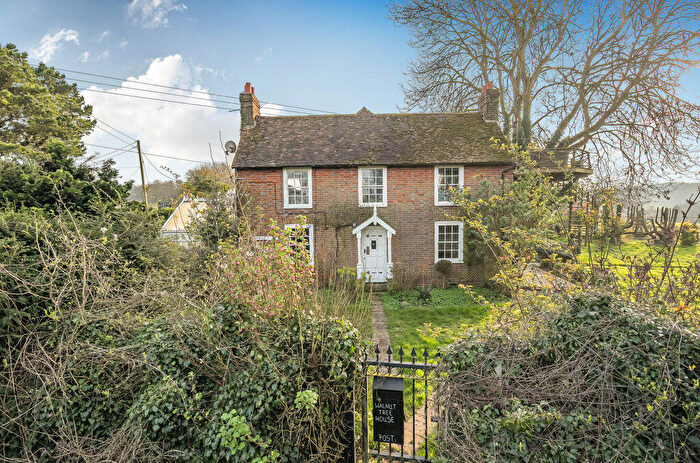
Houses for sale in North Downs, Faversham
House Prices in North Downs
Properties in North Downs have an average house price of £260k and had 1 Property Transaction within the last 3 years¹.
North Downs is an area in Faversham, Kent with 40 households², where the most expensive property was sold for £260k.
Properties for sale in North Downs
Previously listed properties in North Downs


Roads and Postcodes in North Downs
Navigate through our locations to find the location of your next house in North Downs, Faversham for sale or to rent.
| Streets | Postcodes |
|---|---|
| Bunce Court Road | ME13 0BU ME13 0BY ME13 0BZ |
| Coldharbour Road | ME13 0BF |
| Hurst Lane | ME13 0BX |
| Rigshill Road | ME13 0JD |
| Wyebanks Road | ME13 0DA |
| ME13 0BT ME13 0DB |
Property price trends in North Downs
According to the latest Land Registry data, the average home in North Downs sold for £260,000 in 2023. That figure comes from 31 sales logged over the past 27 years.
Prices have fallen back over the last three years. Compared with 2020, when the typical sale came in around £592,500, that's a fall of roughly 56.1%.
Zoom out to the past decade for the fuller picture. Back in 2013, homes here averaged £488,000, so the typical sold price has fallen about 46.7% since then, around 6.1% a year lower. Stretch the view to fifteen years and that annual pace edges up closer to -3.2%.
Frequently asked questions about North Downs
What is the average price for a property for sale in North Downs?
The average price for a property for sale in North Downs is £260,000. This amount is 30% lower than the average price in Faversham. There are 5 property listings for sale in North Downs.
Which train stations are available in or near North Downs?
Some of the train stations available in or near North Downs are Charing, Lenham and Harrietsham.
Property Price Paid in North Downs by Year
The average sold property price by year was:
| Year | Average Sold Price | Price Change |
Sold Properties
|
|---|---|---|---|
| 2023 | £260,000 | -223% |
1 Property |
| 2022 | £840,016 | -11% |
3 Properties |
| 2021 | £930,000 | 36% |
1 Property |
| 2020 | £592,500 | 38% |
1 Property |
| 2015 | £370,166 | -32% |
3 Properties |
| 2013 | £488,000 | -64% |
2 Properties |
| 2012 | £802,499 | -12% |
2 Properties |
| 2011 | £895,000 | 54% |
1 Property |
| 2009 | £412,500 | 50% |
1 Property |
| 2006 | £207,497 | -131% |
2 Properties |
Property Price per Property Type in North Downs
Here you can find historic sold price data in order to help with your property search.
The average Property Paid Price for specific property types in the last three years are:
| Property Type | Average Sold Price | Sold Properties |
|---|---|---|
| Detached House | £260,000.00 | 1 Detached House |
