
Houses for sale & to rent in CT19 5UP, Churchill Close, Folkestone East, Folkestone
House Prices in CT19 5UP, Churchill Close, Folkestone East
Properties in CT19 5UP have no sales history available within the last 3 years. CT19 5UP is a postcode in Churchill Close located in Folkestone East, an area in Folkestone, Kent, with 8 households².
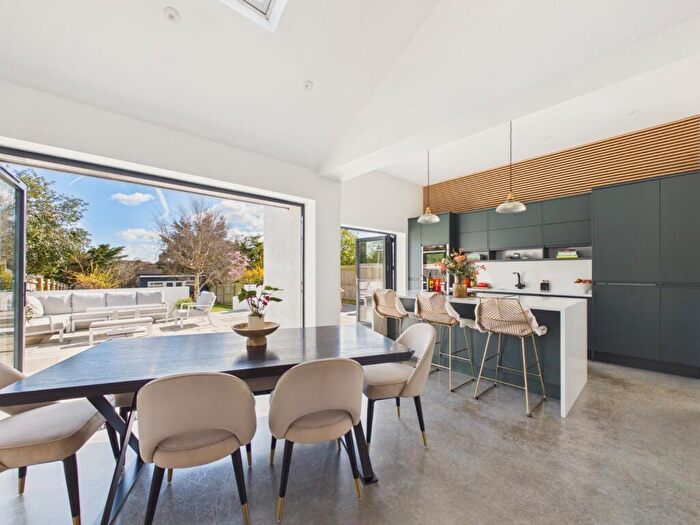
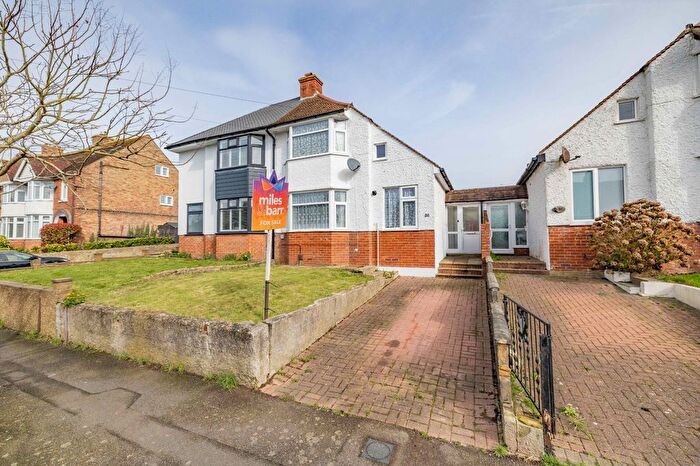
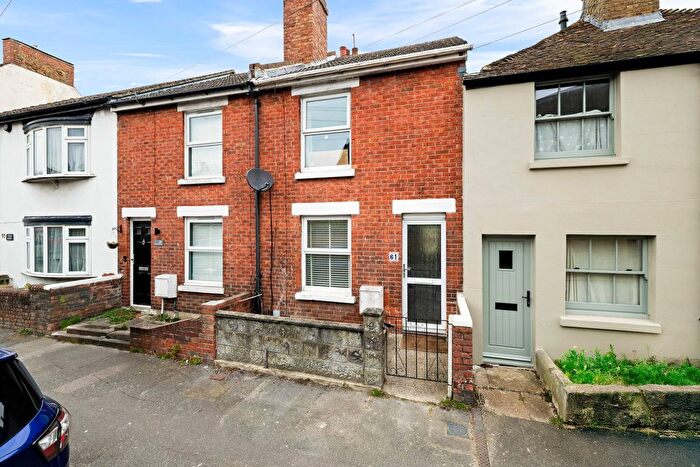
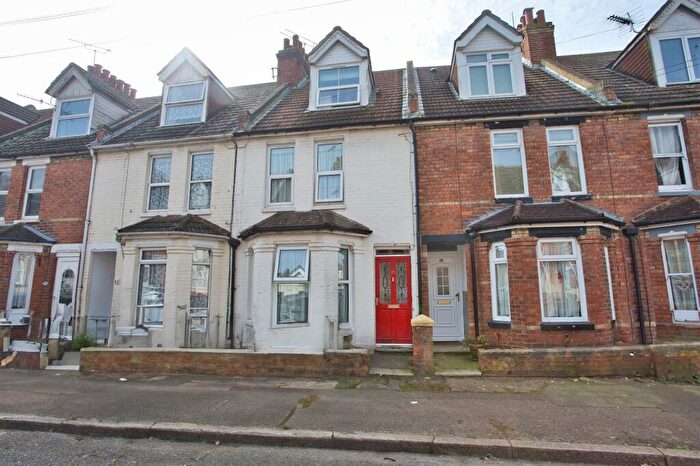
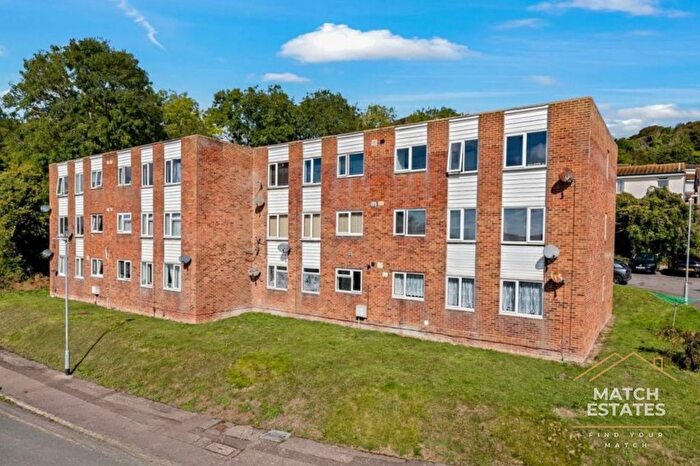
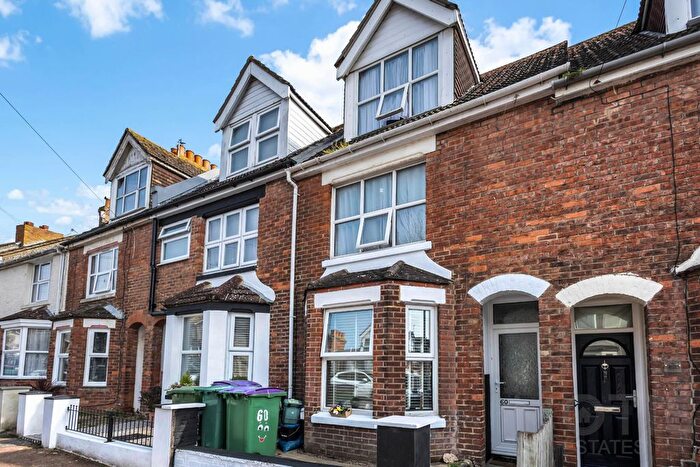
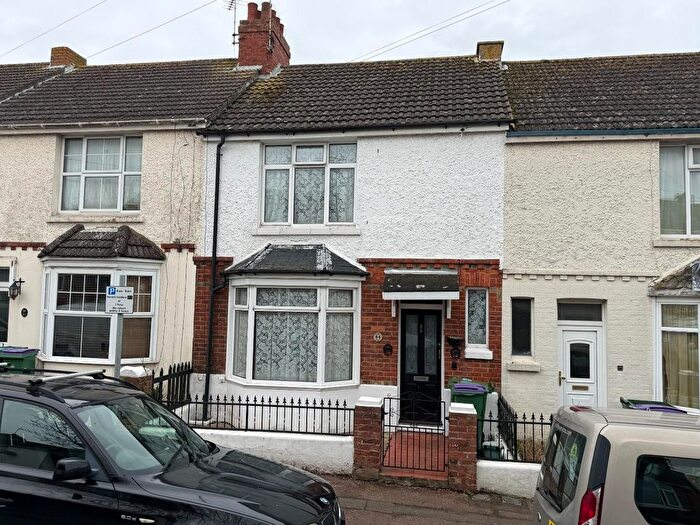
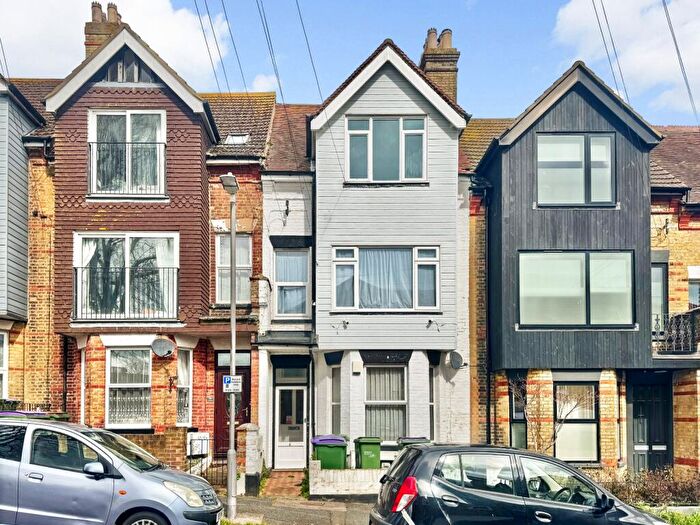
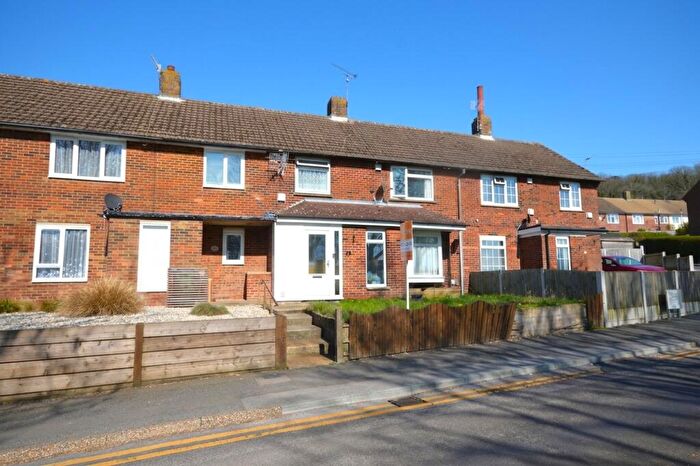
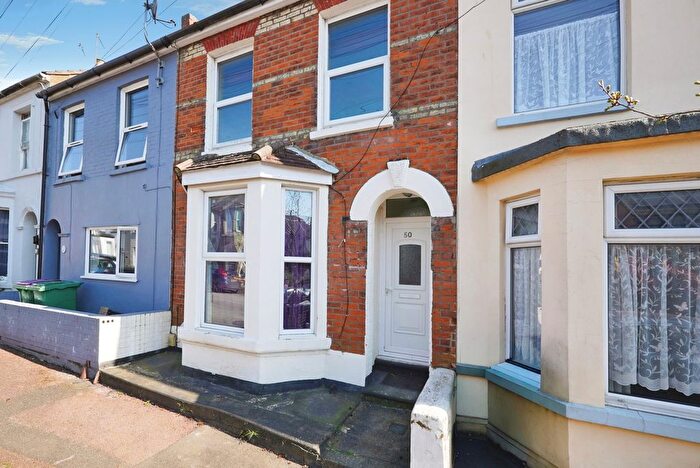
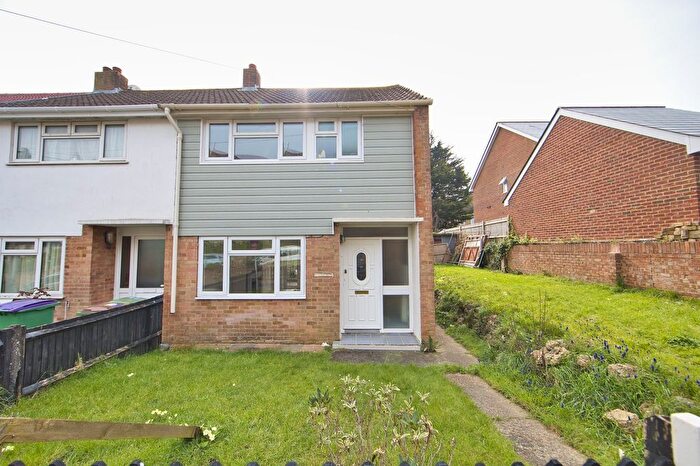
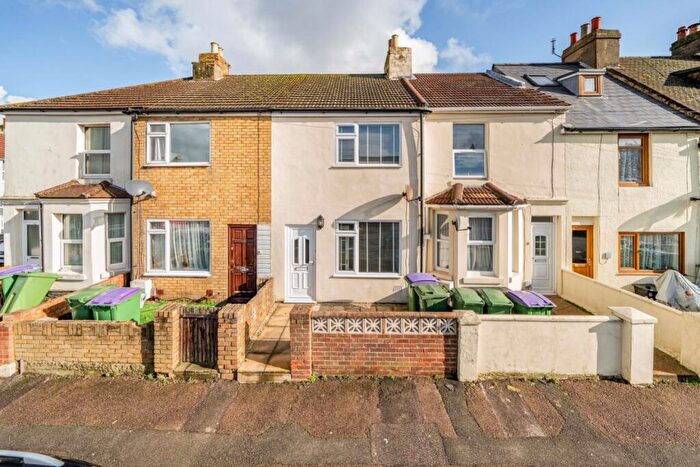
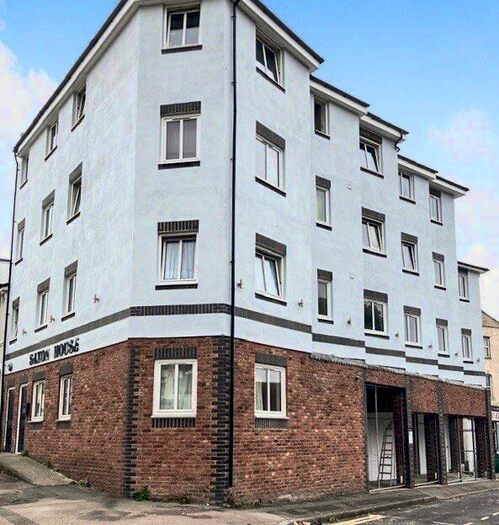
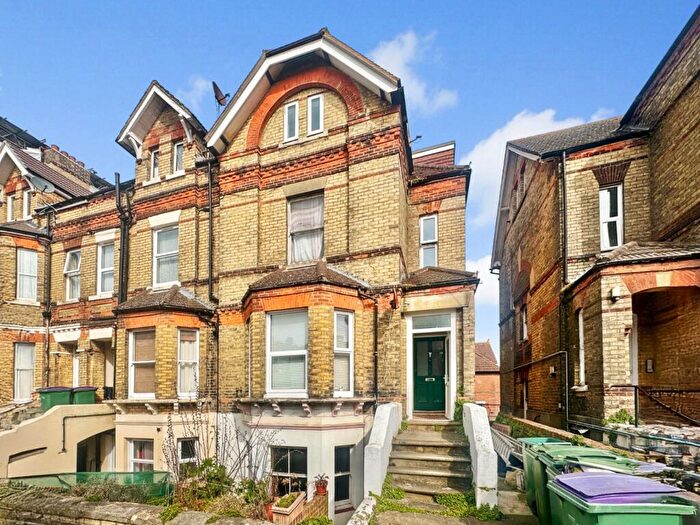
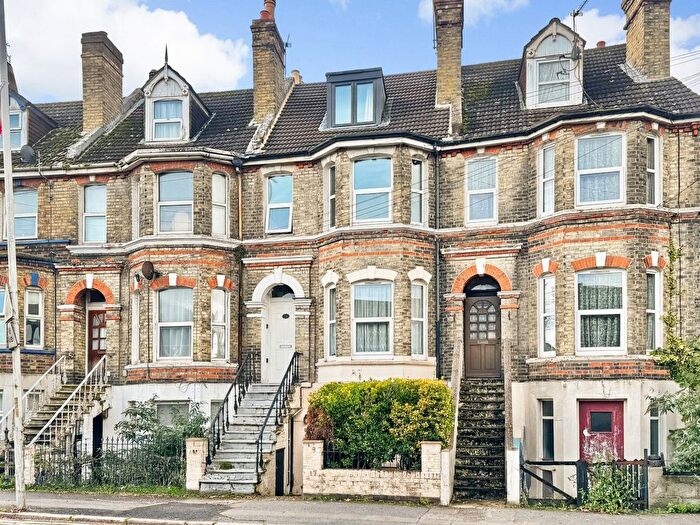
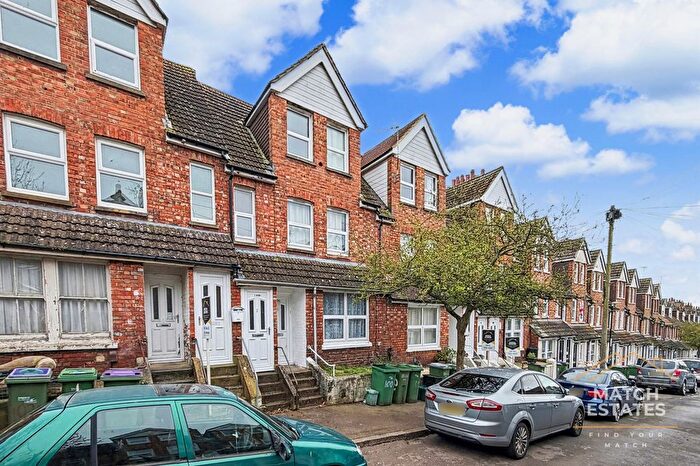
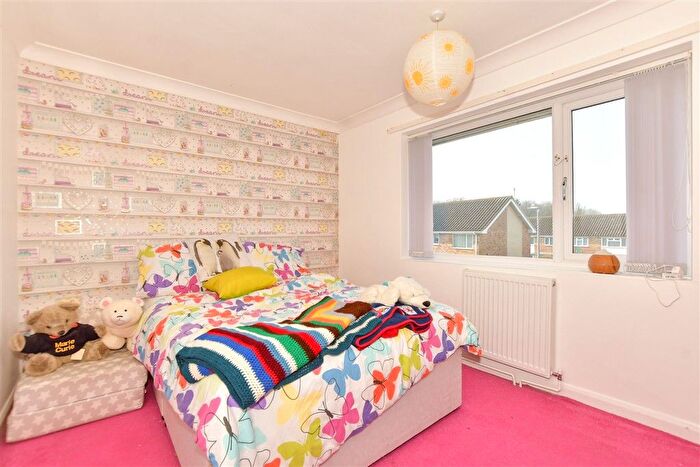
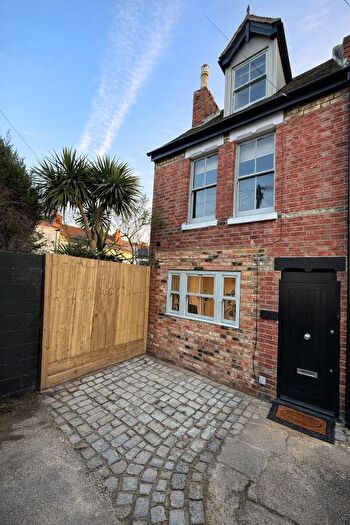
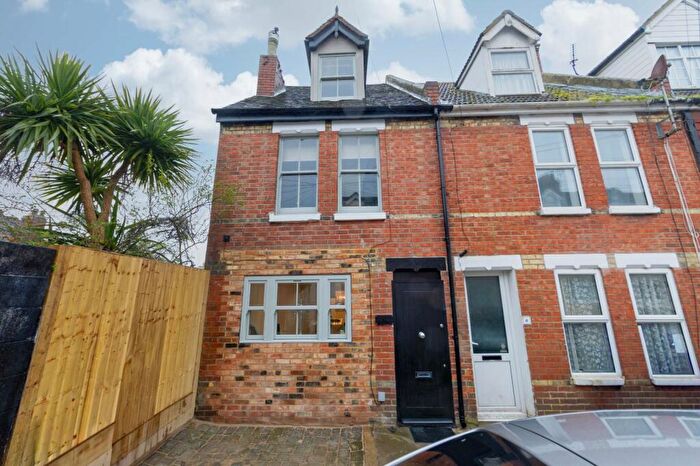
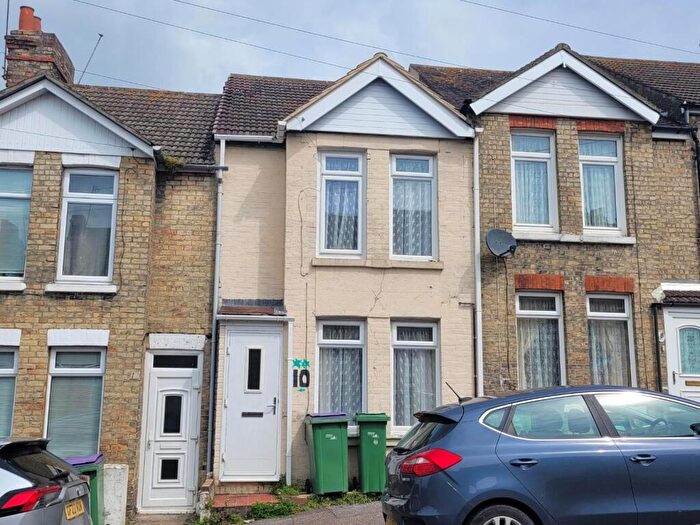
Properties for sale near CT19 5UP, Churchill Close


![]()
If you are looking to sell your house, let it out, or receive a property valuation, an expert can help you.
Click the button below to get started.

Price Paid in Churchill Close, CT19 5UP, Folkestone East
7 Churchill Close, CT19 5UP, Folkestone East Folkestone
Property 7 has been sold 3 times. The last time it was sold was in 24/06/2022 and the sold price was £287,500.00.
This terraced house, sold as a freehold on 24/06/2022, is a 67 sqm semi-detached house with an EPC rating of C.
| Date | Price | Property Type | Tenure | Classification |
|---|---|---|---|---|
| 24/06/2022 | £287,500.00 | Terraced House | freehold | Established Building |
| 20/06/2001 | £81,000.00 | Terraced House | freehold | Established Building |
| 28/03/1996 | £53,000.00 | Terraced House | freehold | Established Building |
5 Churchill Close, CT19 5UP, Folkestone East Folkestone
Property 5 has been sold 1 time. The last time it was sold was in 26/08/2021 and the sold price was £228,000.00.
This semi detached house, sold as a freehold on 26/08/2021, is a 67 sqm semi-detached house with an EPC rating of C.
| Date | Price | Property Type | Tenure | Classification |
|---|---|---|---|---|
| 26/08/2021 | £228,000.00 | Semi Detached House | freehold | Established Building |
1 Churchill Close, CT19 5UP, Folkestone East Folkestone
Property 1 has been sold 4 times. The last time it was sold was in 29/10/2020 and the sold price was £217,000.00.
This detached house, sold as a freehold on 29/10/2020, is a 58 sqm detached bungalow with an EPC rating of D.
| Date | Price | Property Type | Tenure | Classification |
|---|---|---|---|---|
| 29/10/2020 | £217,000.00 | Detached House | freehold | Established Building |
| 20/11/2007 | £169,500.00 | Detached House | freehold | Established Building |
| 15/03/2004 | £138,000.00 | Terraced House | freehold | Established Building |
| 07/11/1995 | £30,000.00 | Terraced House | freehold | Established Building |
8 Churchill Close, CT19 5UP, Folkestone East Folkestone
Property 8 has been sold 3 times. The last time it was sold was in 07/08/2020 and the sold price was £265,000.00.
This detached house, sold as a freehold on 07/08/2020, is a 59 sqm detached bungalow with an EPC rating of C.
| Date | Price | Property Type | Tenure | Classification |
|---|---|---|---|---|
| 07/08/2020 | £265,000.00 | Detached House | freehold | Established Building |
| 27/03/2017 | £230,000.00 | Detached House | freehold | Established Building |
| 10/09/2014 | £178,000.00 | Detached House | freehold | Established Building |
4 Churchill Close, CT19 5UP, Folkestone East Folkestone
Property 4 has been sold 2 times. The last time it was sold was in 12/06/2017 and the sold price was £200,000.00.
This semi detached house, sold as a freehold on 12/06/2017, is a 68 sqm semi-detached house with an EPC rating of D.
| Date | Price | Property Type | Tenure | Classification |
|---|---|---|---|---|
| 12/06/2017 | £200,000.00 | Semi Detached House | freehold | Established Building |
| 27/01/2006 | £137,000.00 | Semi Detached House | freehold | Established Building |
3 Churchill Close, CT19 5UP, Folkestone East Folkestone
Property 3 has been sold 2 times. The last time it was sold was in 23/11/2010 and the sold price was £127,500.00.
This semi detached house, sold as a freehold on 23/11/2010, is a 67 sqm semi-detached house with an EPC rating of C.
| Date | Price | Property Type | Tenure | Classification |
|---|---|---|---|---|
| 23/11/2010 | £127,500.00 | Semi Detached House | freehold | Established Building |
| 08/09/2000 | £77,000.00 | Terraced House | freehold | Established Building |
Transport near CT19 5UP, Churchill Close

House price paid reports for CT19 5UP, Churchill Close
Click on the buttons below to see price paid reports by year or property price:
- Price Paid By Year
Property Price Paid in CT19 5UP, Churchill Close by Year
The average sold property price by year was:
| Year | Average Sold Price | Price Change |
Sold Properties
|
|---|---|---|---|
| 2022 | £287,500 | 21% |
1 Property |
| 2021 | £228,000 | -6% |
1 Property |
| 2020 | £241,000 | 11% |
2 Properties |
| 2017 | £215,000 | 17% |
2 Properties |
| 2014 | £178,000 | 28% |
1 Property |
| 2010 | £127,500 | -33% |
1 Property |
| 2007 | £169,500 | 19% |
1 Property |
| 2006 | £137,000 | -1% |
1 Property |
| 2004 | £138,000 | 41% |
1 Property |
| 2001 | £81,000 | 5% |
1 Property |
| 2000 | £77,000 | 31% |
1 Property |
| 1996 | £53,000 | 43% |
1 Property |
| 1995 | £30,000 | - |
1 Property |