
Houses for sale & to rent in CT20 1NE, Rosemary Villas, Folkestone Harbour, Folkestone
House Prices in CT20 1NE, Rosemary Villas, Folkestone Harbour
Properties in CT20 1NE have no sales history available within the last 3 years. CT20 1NE is a postcode in Rosemary Villas located in Folkestone Harbour, an area in Folkestone, Kent, with 5 households².
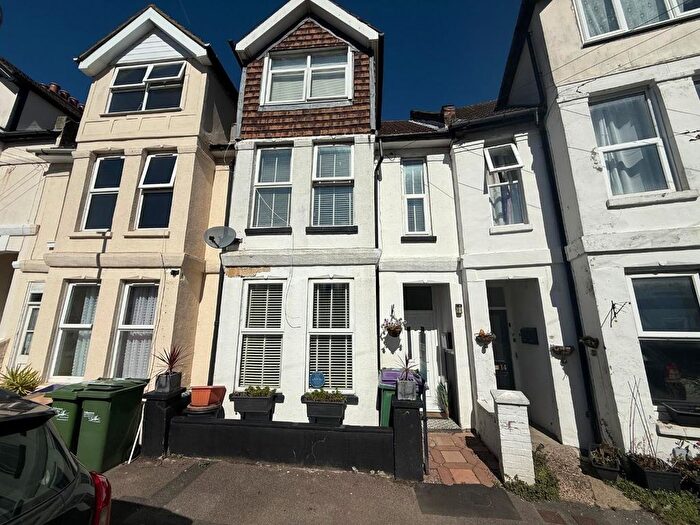
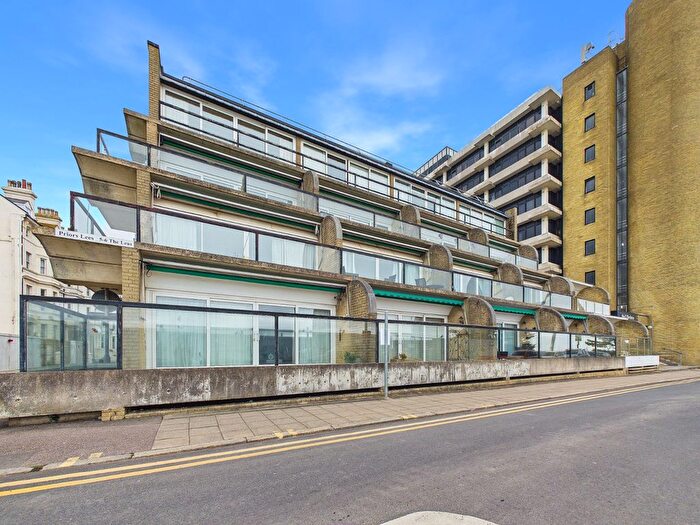
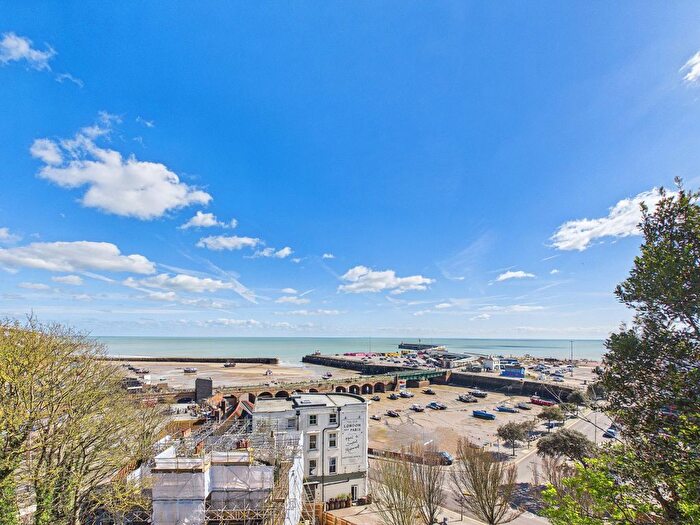
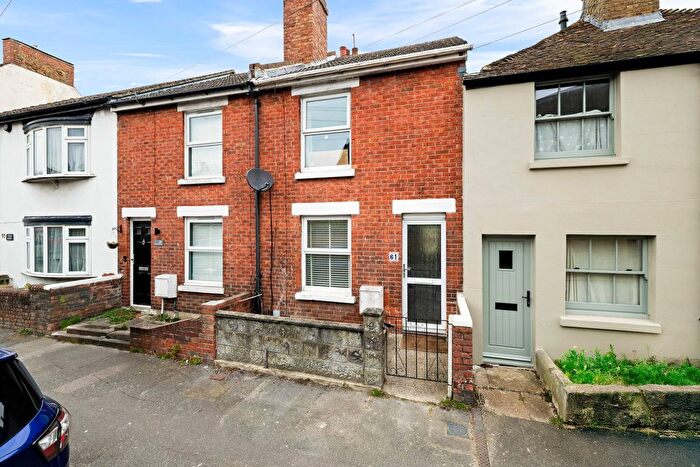
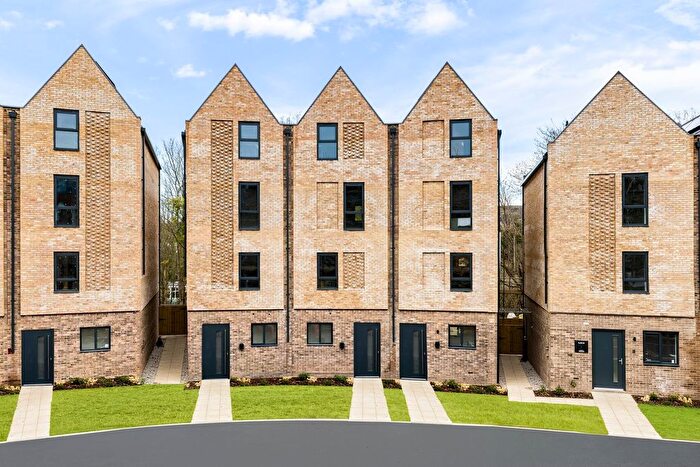
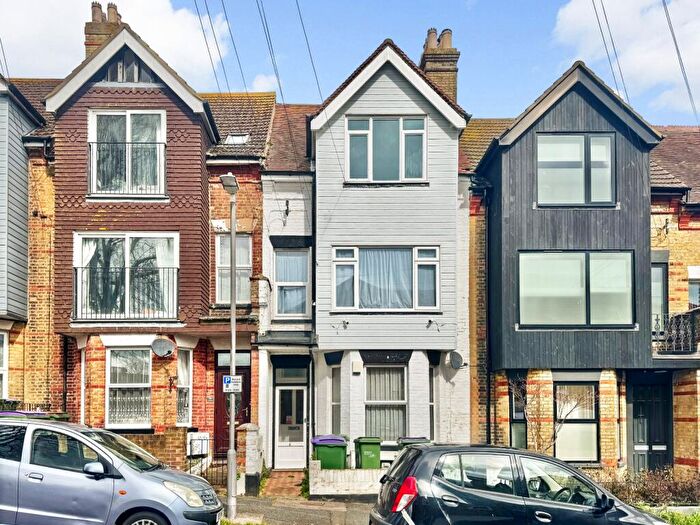
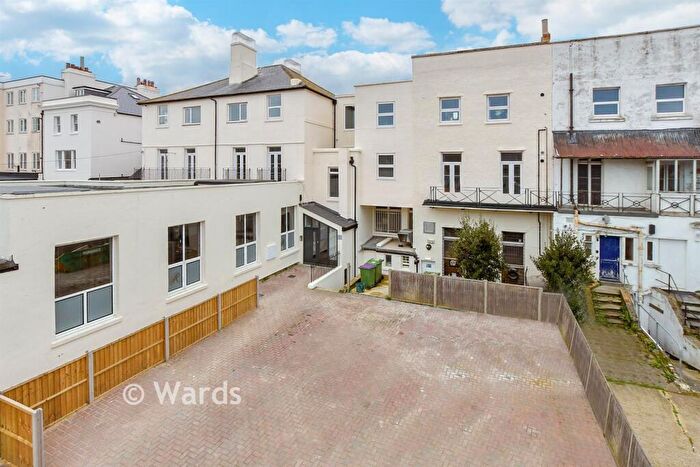
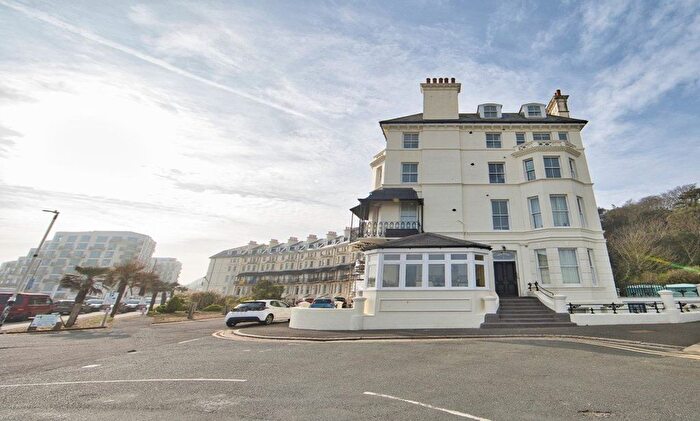
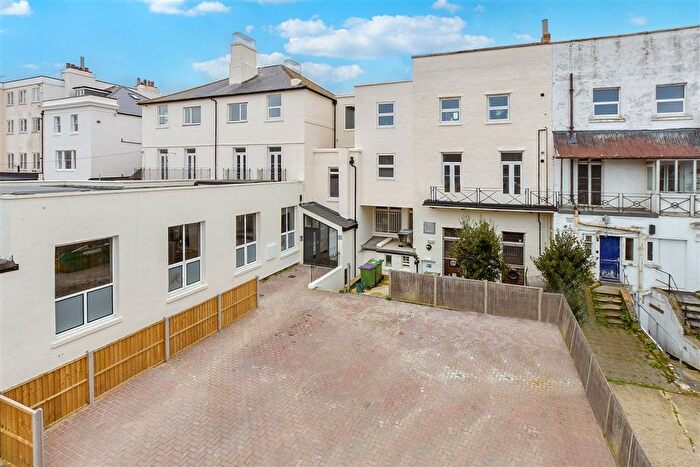
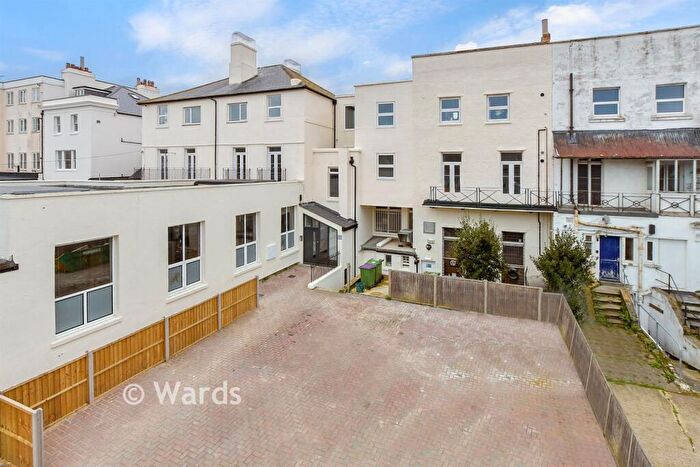
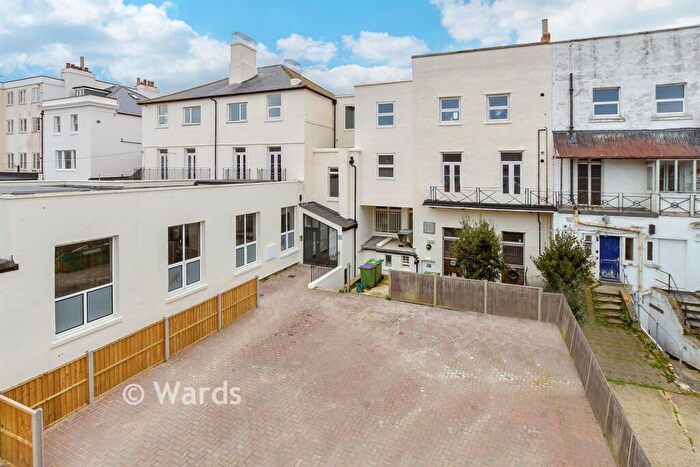
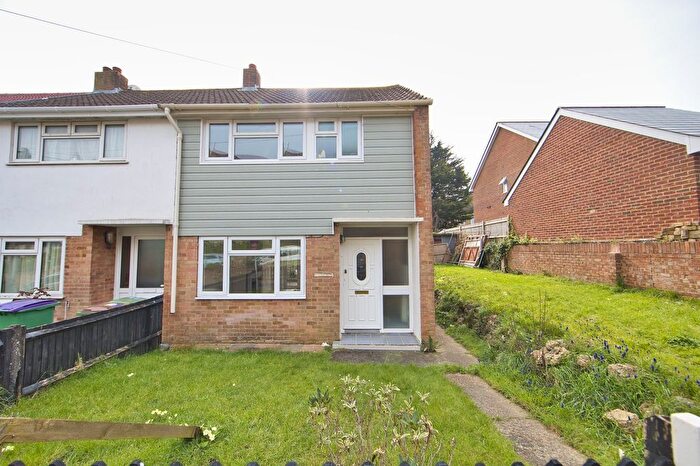
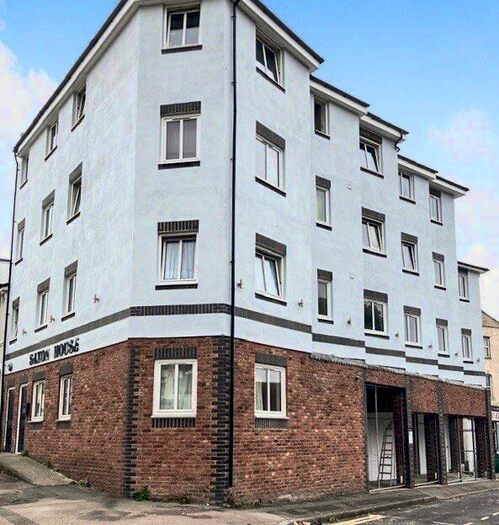
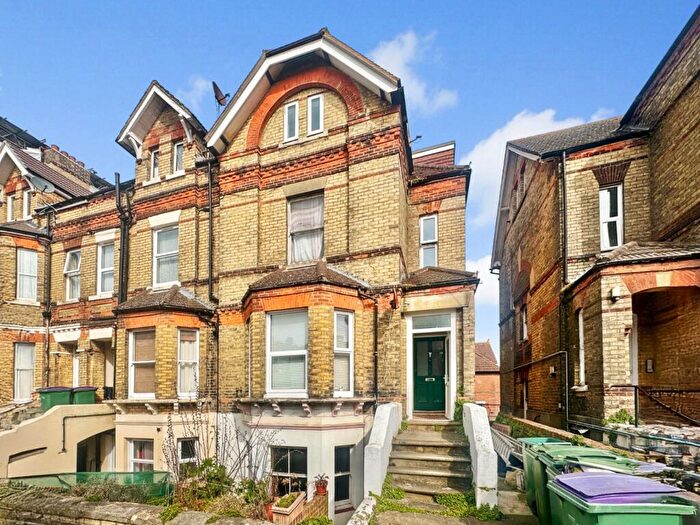
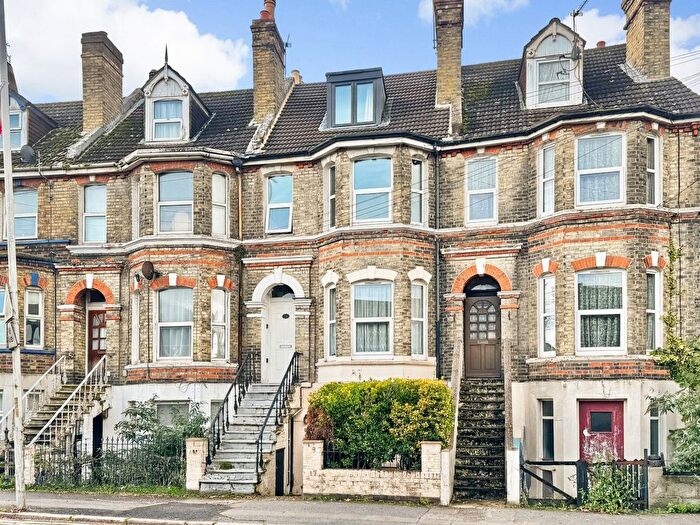
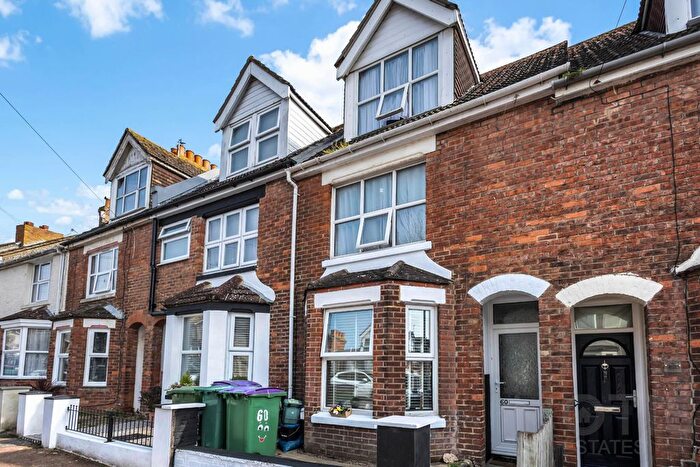
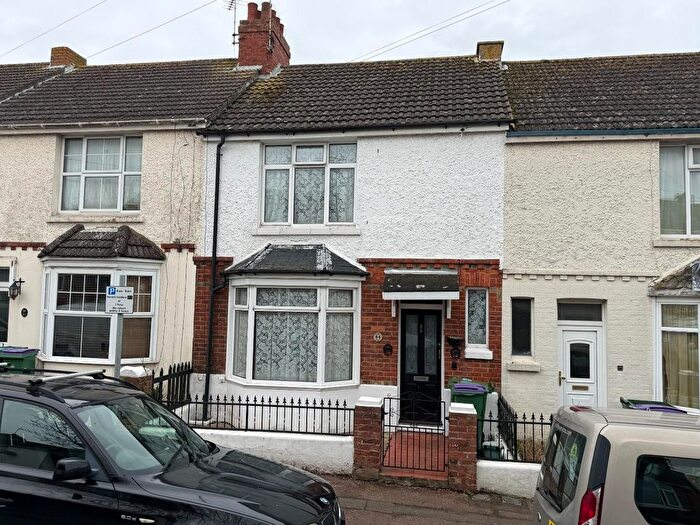
Properties for sale near CT20 1NE, Rosemary Villas
![]()
If you are looking to sell your house, let it out, or receive a property valuation, an expert can help you.
Click the button below to get started.


Price Paid in Rosemary Villas, CT20 1NE, Folkestone Harbour
2 Rosemary Villas, CT20 1NE, Folkestone Harbour Folkestone
Property 2 has been sold 3 times. The last time it was sold was in 25/02/2022 and the sold price was £348,500.00.
This semi detached house, sold as a freehold on 25/02/2022, is a 102 sqm semi-detached house with an EPC rating of E.
| Date | Price | Property Type | Tenure | Classification |
|---|---|---|---|---|
| 25/02/2022 | £348,500.00 | Semi Detached House | freehold | Established Building |
| 17/03/2016 | £170,000.00 | Semi Detached House | freehold | Established Building |
| 14/10/2005 | £170,000.00 | Semi Detached House | freehold | Established Building |
1 Rosemary Villas, CT20 1NE, Folkestone Harbour Folkestone
Property 1 has been sold 1 time. The last time it was sold was in 14/12/2017 and the sold price was £168,000.00.
This semi detached house, sold as a freehold on 14/12/2017, is a 101 sqm semi-detached house with an EPC rating of E.
| Date | Price | Property Type | Tenure | Classification |
|---|---|---|---|---|
| 14/12/2017 | £168,000.00 | Semi Detached House | freehold | Established Building |
Transport near CT20 1NE, Rosemary Villas
-
 Folkestone Central Station
 -
Folkestone West Station
-
Sandling Station
-
Kearsney Station
-
Dover Priory Station
-
Westenhanger Station
-
Shepherd's Well Station
-
Snowdown Station
-
Martin Mill Station
House price paid reports for CT20 1NE, Rosemary Villas
Click on the buttons below to see price paid reports by year or property price:
- Price Paid By Year
Property Price Paid in CT20 1NE, Rosemary Villas by Year
The average sold property price by year was:
| Year | Average Sold Price | Price Change |
Sold Properties
|
|---|---|---|---|
| 2022 | £348,500 | 52% |
1 Property |
| 2017 | £168,000 | -1% |
1 Property |
| 2016 | £170,000 | - |
1 Property |
| 2005 | £170,000 | - |
1 Property |