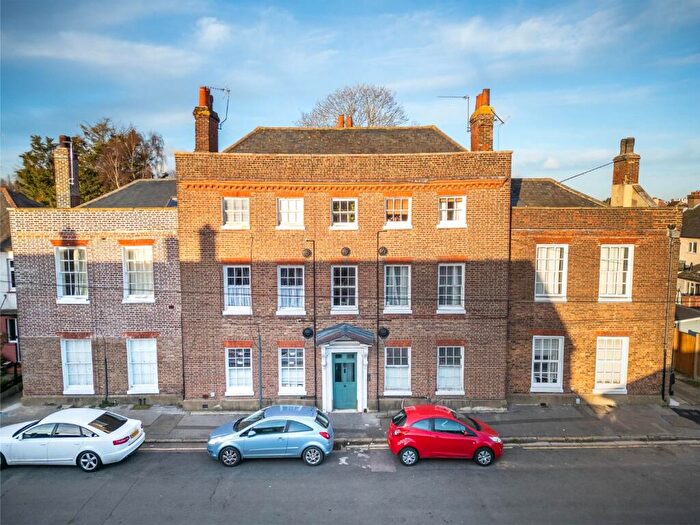
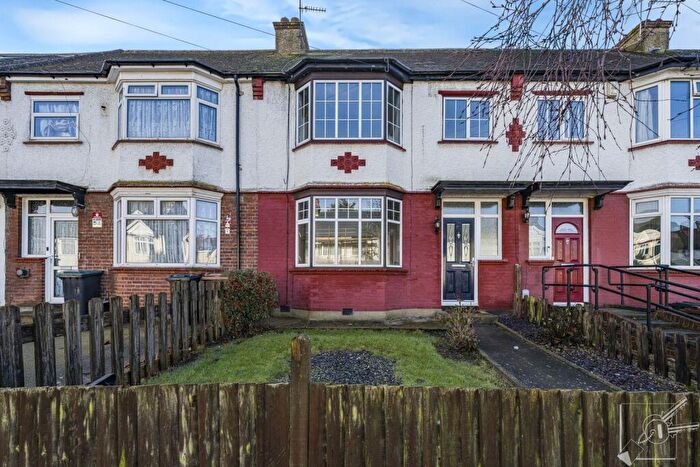
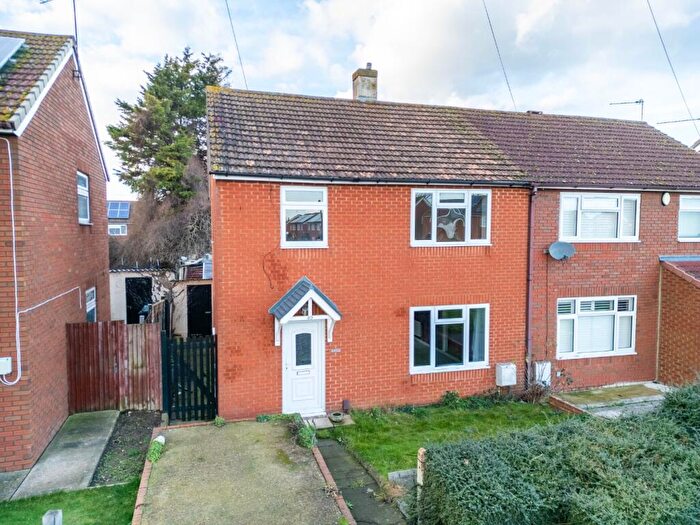
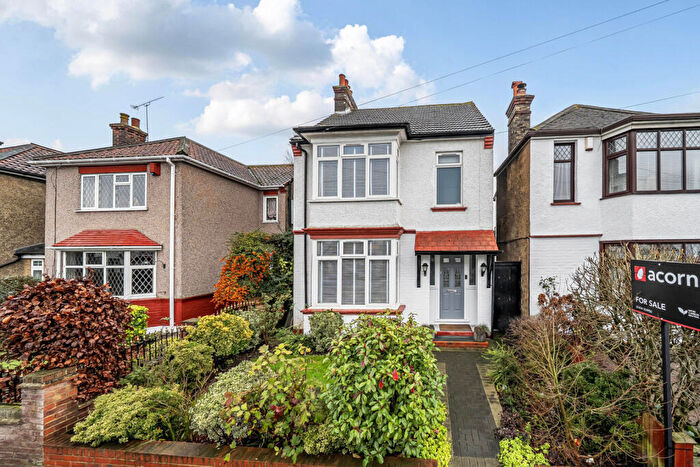
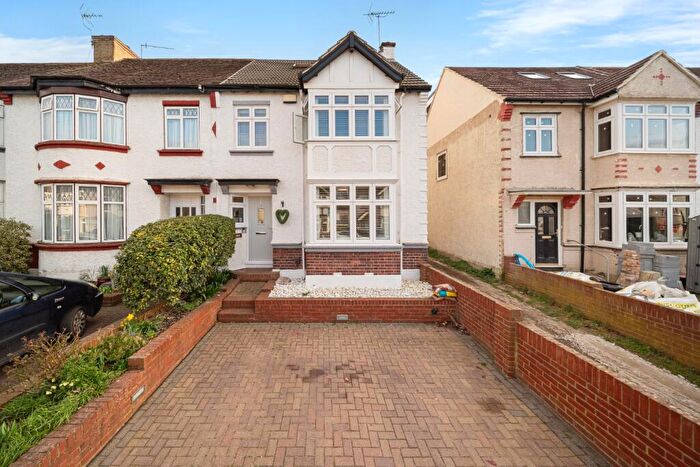
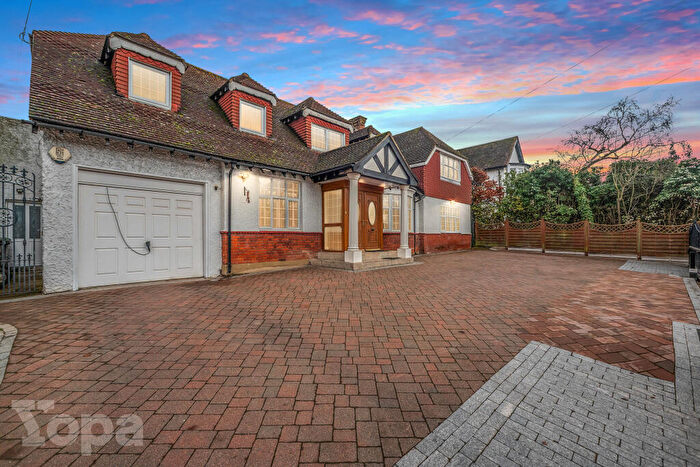
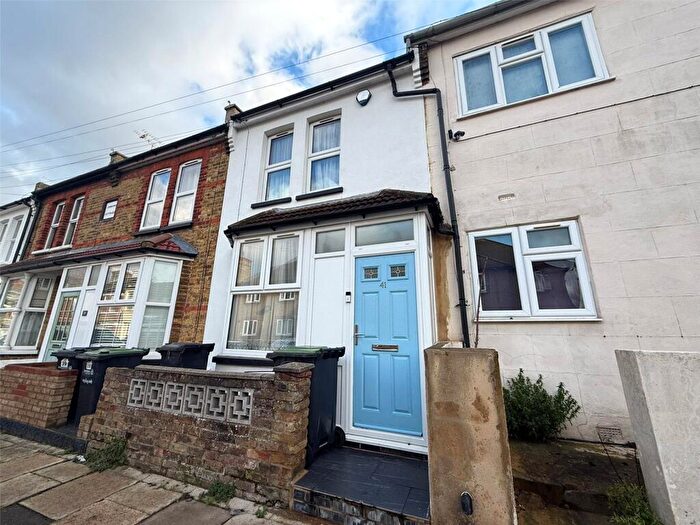
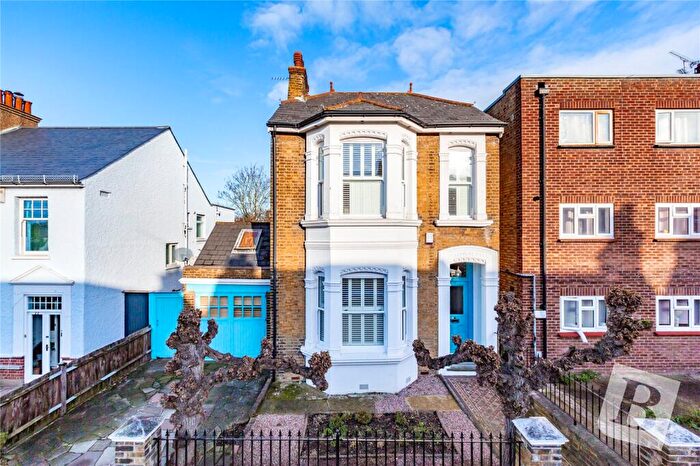
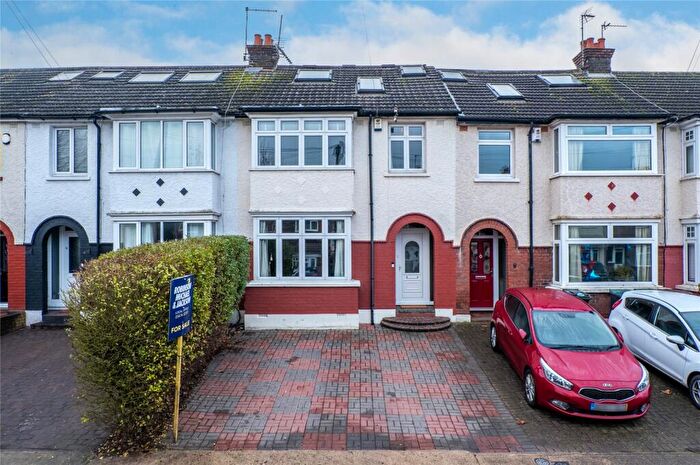
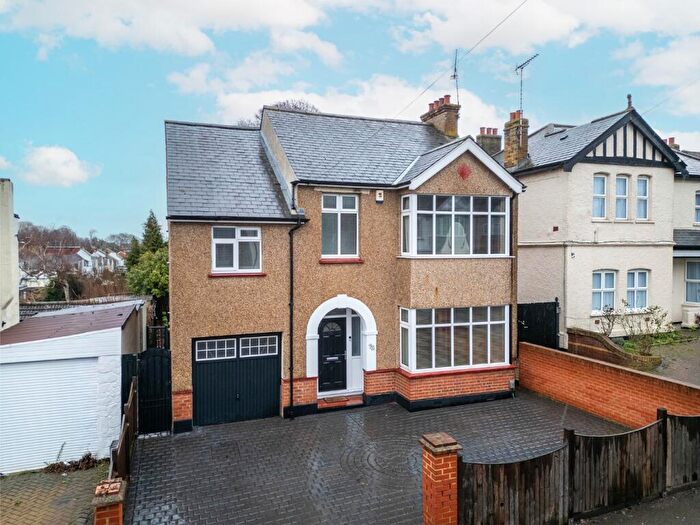
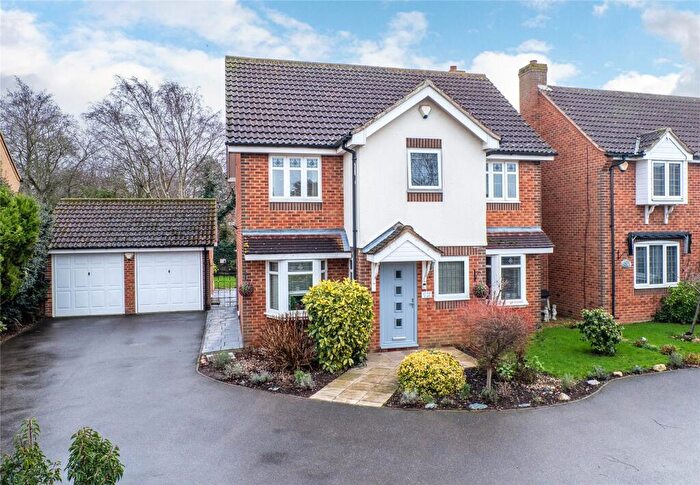
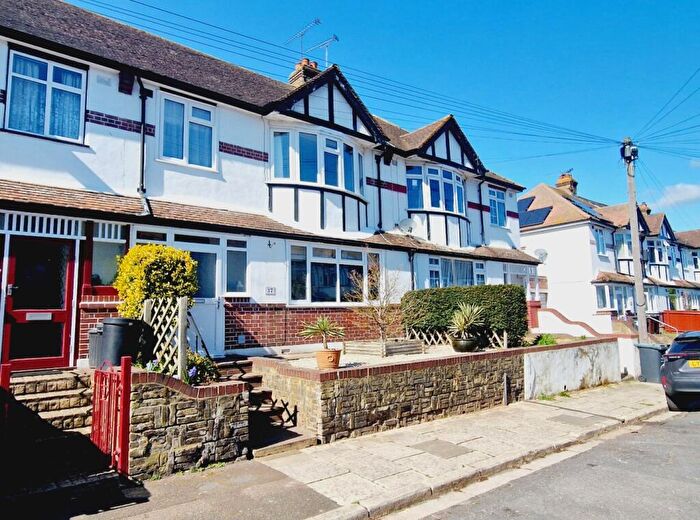
Houses for sale & to rent in Woodlands, Gravesend
House Prices in Woodlands
Properties in Woodlands have an average house price of £407,041.00 and had 235 Property Transactions within the last 3 years¹.
Woodlands is an area in Gravesend, Kent with 2,514 households², where the most expensive property was sold for £1,280,000.00.
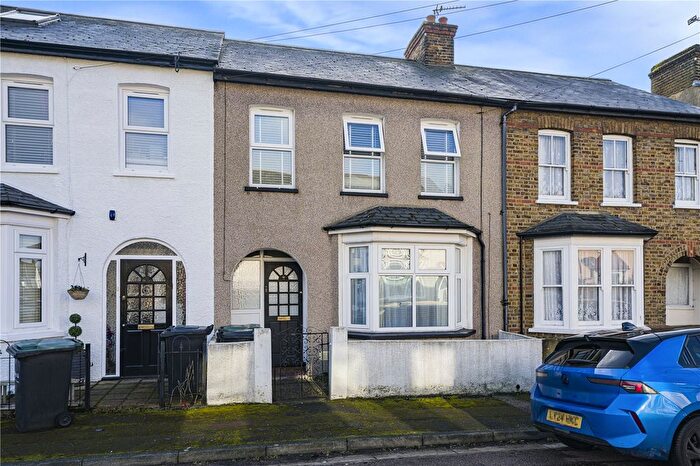
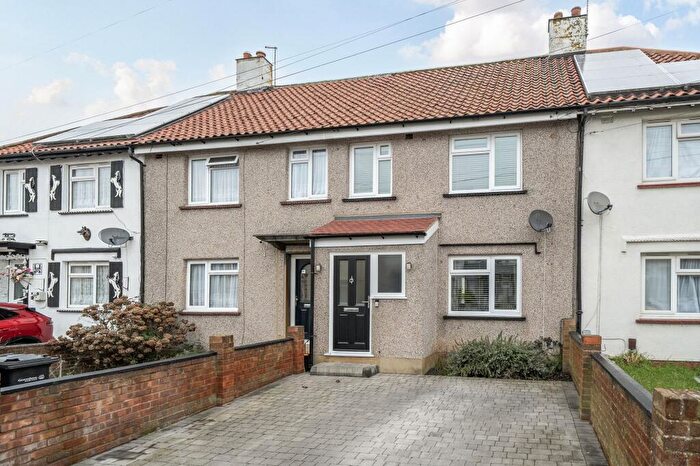
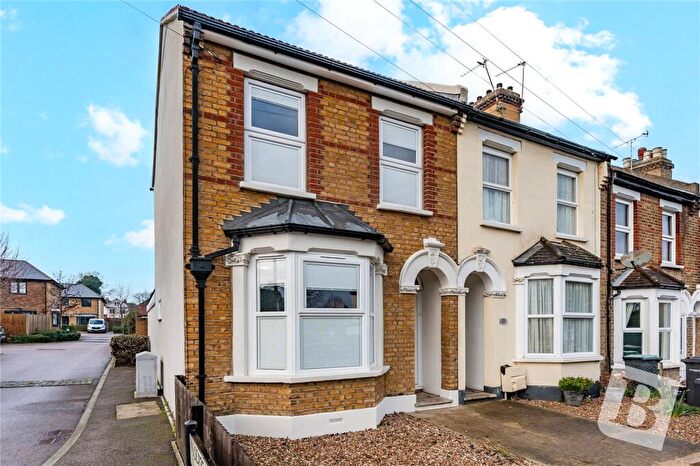
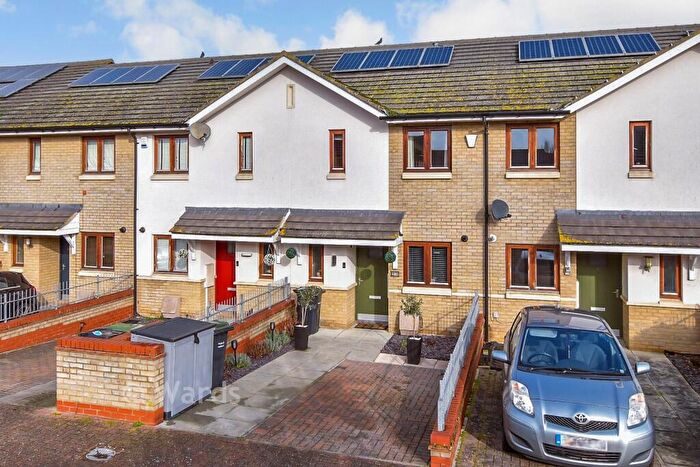
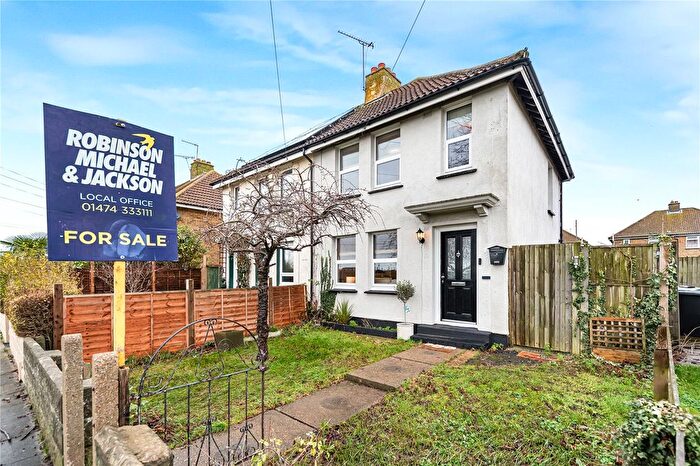
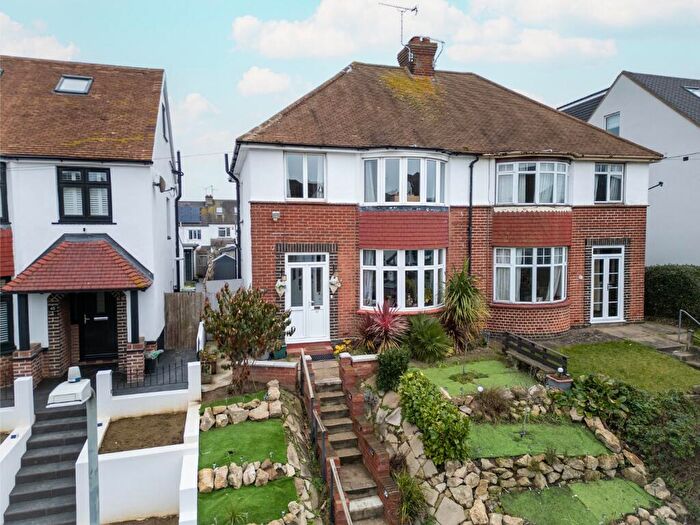
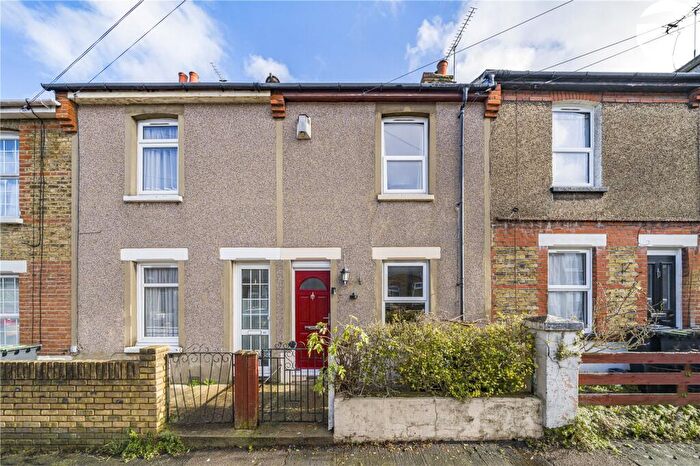
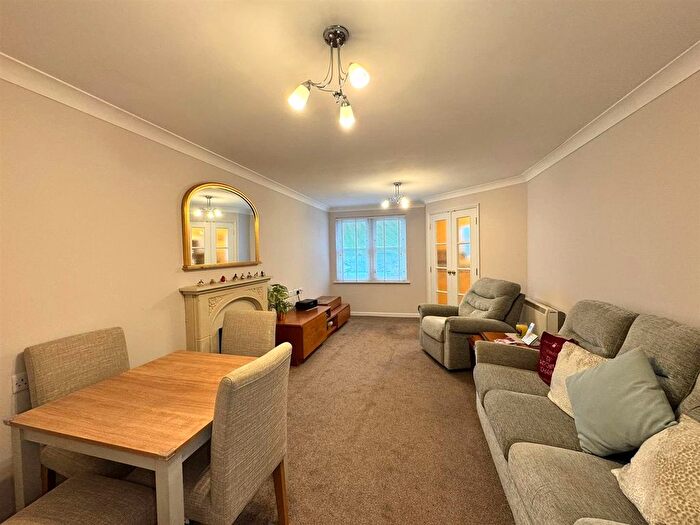
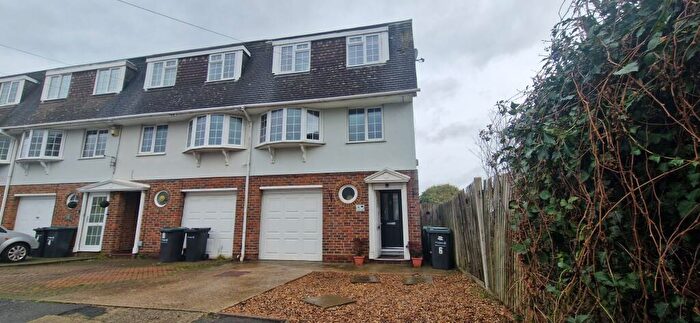
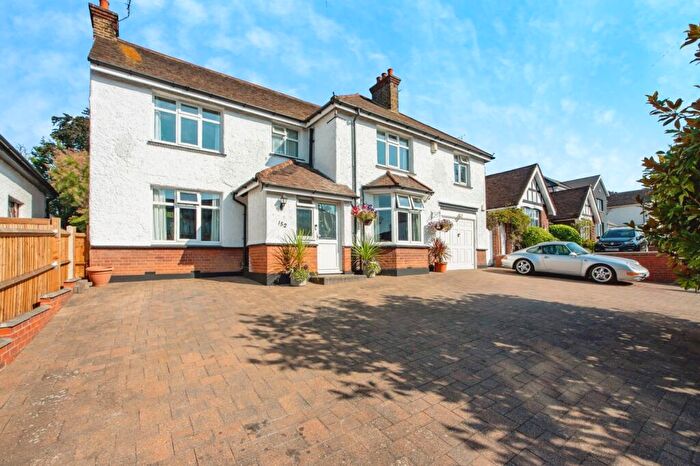
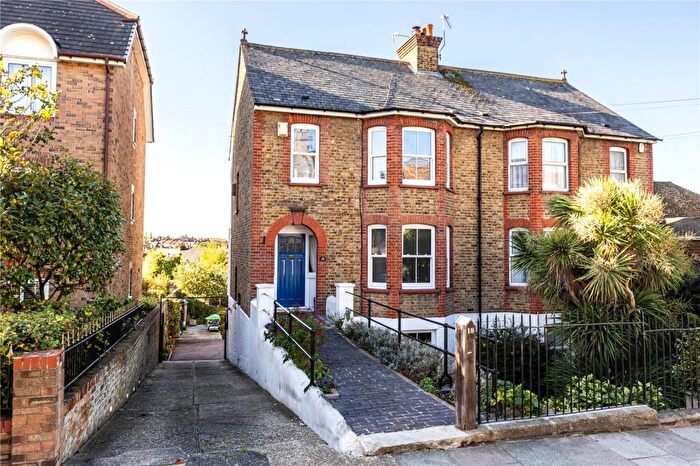
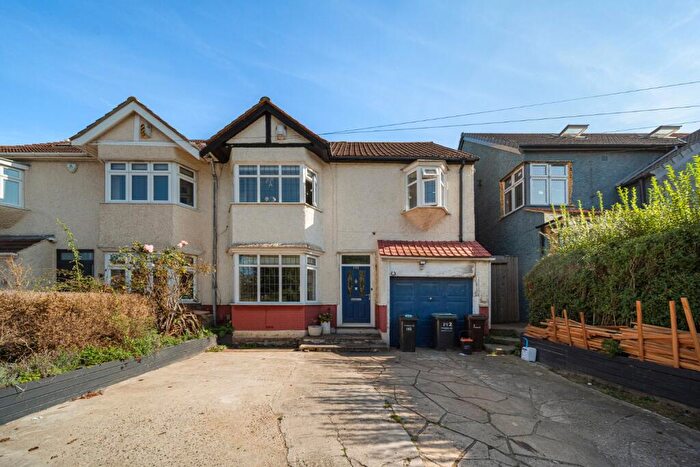
Properties for sale in Woodlands
Roads and Postcodes in Woodlands
Navigate through our locations to find the location of your next house in Woodlands, Gravesend for sale or to rent.
| Streets | Postcodes |
|---|---|
| Aintree Close | DA12 5AS |
| Alfred Road | DA11 7QF DA11 7QE |
| Appleshaw Close | DA11 7PB |
| Ascot Road | DA12 5AL |
| Bartlett Road | DA11 7LU |
| Brenchley Avenue | DA11 7RG DA11 7RQ |
| Broadacre View | DA11 7FX |
| Broadwood | DA11 7RX |
| Bushel Close | DA11 7GQ |
| Buttercup Walk | DA11 7GB |
| Central Avenue | DA12 5AD |
| Chalky Bank | DA11 7NY DA11 7NZ |
| Cheltenham Close | DA12 5DX |
| Church Road | DA12 5UR |
| Cornfield Drive | DA11 7FD DA11 7FE DA11 7FG DA11 7FH DA11 7FJ DA11 7FN DA11 7FP DA11 7FQ DA11 7FR DA11 7FS DA11 7FT DA11 7FU |
| Cross Lane East | DA12 5HD DA12 5HH |
| Cross Lane West | DA11 7PY DA11 7PZ DA11 7QB DA11 7LD |
| Daisy Walk | DA11 7GN |
| Dashwood Road | DA11 7LZ |
| Dennis Road | DA11 7NN DA11 7NW |
| Devonshire Road | DA12 5AA |
| Elizabeth Huggins Court | DA11 7LX |
| Elm Road | DA12 5LE DA12 5LF |
| Epsom Close | DA12 5BF |
| Fallow Field | DA11 7GD |
| Ferndale Road | DA12 5AF |
| Field Lane | DA11 7FY |
| Furrow Lane | DA11 7GT |
| Gatwick Road | DA12 5AJ |
| Golf Links Avenue | DA11 7PA |
| Goodwood Crescent | DA12 5EL DA12 5EY DA12 5EZ |
| Harman Avenue | DA11 7RJ |
| Harvest Lane | DA11 7GU |
| Hawthorne Close | DA12 5LD |
| Haywain Drive | DA11 7GA |
| Hectare Lane | DA11 7FW |
| Hever Court Road | DA12 5EG DA12 5EQ |
| Hillingdon Road | DA11 7LG DA11 7LQ |
| Hither Fields | DA11 7DH DA11 7DJ |
| Jubilee Cottages | DA12 5EJ |
| Kings Drive | DA12 5BJ DA12 5BQ |
| Leigh Road | DA11 7PS |
| Lingfield Road | DA12 5AH |
| Lynton Road South | DA11 7NE DA11 7NF DA11 7GJ |
| Mcmillan Close | DA12 5LH |
| Mead Road | DA11 7PP |
| Meadow Road | DA11 7LR DA11 7LS |
| Meadowsweet Mews | DA11 7GE |
| New House Lane | DA11 7LP |
| North Lane | DA11 7BJ |
| Nursery Grove | DA11 7BB DA11 7BG DA11 7BQ |
| Nursery Mews | DA11 7BU |
| Oak Road | DA12 5LG DA12 5LQ |
| Old Road East | DA12 1NG |
| Old Road West | DA11 0LH DA11 0LW DA11 7LA |
| Old Watling Street | DA11 7NT |
| Orchard Avenue | DA11 7NX |
| Park Road | DA11 7PR |
| Pinnocks Avenue | DA11 7QD |
| Plough Road | DA11 7GS |
| Pomarium Close | DA11 7FA |
| Poppy Walk | DA11 7GF |
| Portland Avenue | DA12 5HE |
| Ridgeway Avenue | DA12 5BB DA12 5BD |
| Sandown Road | DA12 5EN DA12 5EW |
| Shire Close | DA11 7GW |
| Singlewell Road | DA11 7PN DA11 7PT DA11 7PU DA11 7PW DA11 7PX DA11 7QA DA11 7RB DA11 7RE DA11 7RF DA11 7RH DA11 7RL DA11 7RN DA11 7RW DA11 7RZ DA11 7RA |
| Southfields Green | DA11 7AD DA11 7BF |
| St Thomass Avenue | DA11 7QH |
| Templar Drive | DA11 7NS |
| The Fairway | DA11 7LN DA11 7LW |
| Thresher Drive | DA11 7GR |
| Tillage Gardens | DA11 7GL |
| Tree Tops | DA12 5BL |
| Trosley Avenue | DA11 7QN DA11 7QW |
| Watling Street | DA11 7NR DA11 7NU DA11 7NP |
| Wentworth Close | DA11 7NL |
| Westfield Close | DA12 5EH |
| Westwood | DA11 7AA DA11 7EX |
| Wheat Field | DA11 7FZ |
| Windsor Road | DA12 5BN DA12 5BW |
| Woodfield Avenue | DA11 7QG DA11 7QQ |
| Wrotham Road | DA11 7LB DA11 7LE DA11 7LH DA11 7LJ DA11 7LL DA11 7PE DA11 7PF DA11 7LF |
| DA11 7FL DA11 7GP |
Transport near Woodlands
-
Gravesend Station
-
Northfleet Station
-
Ebbsfleet International Station
-
Meopham Station
-
Tilbury Town Station
-
Sole Street Station
- FAQ
- Price Paid By Year
- Property Type Price
Frequently asked questions about Woodlands
What is the average price for a property for sale in Woodlands?
The average price for a property for sale in Woodlands is £407,041. This amount is 11% higher than the average price in Gravesend. There are 1,639 property listings for sale in Woodlands.
What streets have the most expensive properties for sale in Woodlands?
The streets with the most expensive properties for sale in Woodlands are Broadwood at an average of £783,333, Pomarium Close at an average of £773,000 and Brenchley Avenue at an average of £602,875.
What streets have the most affordable properties for sale in Woodlands?
The streets with the most affordable properties for sale in Woodlands are Hither Fields at an average of £196,050, Nursery Grove at an average of £260,000 and Mead Road at an average of £270,329.
Which train stations are available in or near Woodlands?
Some of the train stations available in or near Woodlands are Gravesend, Northfleet and Ebbsfleet International.
Property Price Paid in Woodlands by Year
The average sold property price by year was:
| Year | Average Sold Price | Price Change |
Sold Properties
|
|---|---|---|---|
| 2025 | £442,504 | 6% |
81 Properties |
| 2024 | £417,534 | 13% |
73 Properties |
| 2023 | £362,122 | -9% |
81 Properties |
| 2022 | £395,422 | 5% |
88 Properties |
| 2021 | £376,788 | 2% |
118 Properties |
| 2020 | £368,080 | 5% |
119 Properties |
| 2019 | £350,744 | 6% |
94 Properties |
| 2018 | £329,659 | -18% |
72 Properties |
| 2017 | £390,493 | 16% |
98 Properties |
| 2016 | £328,304 | 13% |
120 Properties |
| 2015 | £285,388 | 9% |
110 Properties |
| 2014 | £259,952 | 14% |
129 Properties |
| 2013 | £224,377 | -10% |
134 Properties |
| 2012 | £247,371 | 17% |
80 Properties |
| 2011 | £206,229 | -10% |
61 Properties |
| 2010 | £226,811 | 10% |
62 Properties |
| 2009 | £204,492 | -10% |
71 Properties |
| 2008 | £225,057 | -5% |
74 Properties |
| 2007 | £236,737 | 7% |
109 Properties |
| 2006 | £219,711 | -2% |
118 Properties |
| 2005 | £224,410 | 14% |
92 Properties |
| 2004 | £193,271 | 5% |
124 Properties |
| 2003 | £182,731 | 13% |
118 Properties |
| 2002 | £159,425 | 19% |
119 Properties |
| 2001 | £128,674 | 10% |
116 Properties |
| 2000 | £116,073 | 12% |
86 Properties |
| 1999 | £101,774 | 5% |
99 Properties |
| 1998 | £96,296 | 17% |
126 Properties |
| 1997 | £80,221 | 12% |
130 Properties |
| 1996 | £70,521 | 4% |
108 Properties |
| 1995 | £67,996 | - |
75 Properties |
Property Price per Property Type in Woodlands
Here you can find historic sold price data in order to help with your property search.
The average Property Paid Price for specific property types in the last three years are:
| Property Type | Average Sold Price | Sold Properties |
|---|---|---|
| Semi Detached House | £428,426.00 | 65 Semi Detached Houses |
| Detached House | £608,198.00 | 42 Detached Houses |
| Terraced House | £340,053.00 | 121 Terraced Houses |
| Flat | £159,464.00 | 7 Flats |

