
Houses for sale in CT11 9JN, The Broadway, Central Harbour, Ramsgate
House Prices in CT11 9JN, The Broadway, Central Harbour
Properties in CT11 9JN have no sales history available within the last 3 years. CT11 9JN is a postcode in The Broadway located in Central Harbour, an area in Ramsgate, Kent, with 3 households².
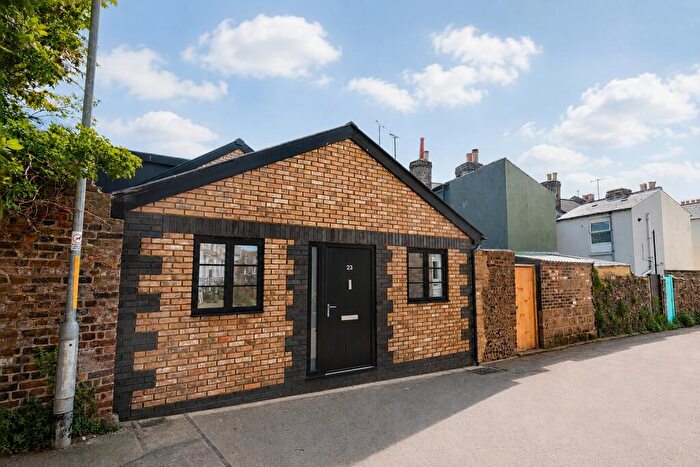
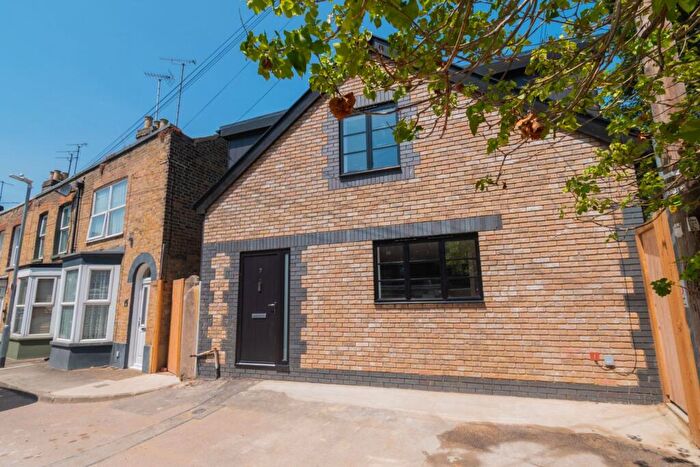
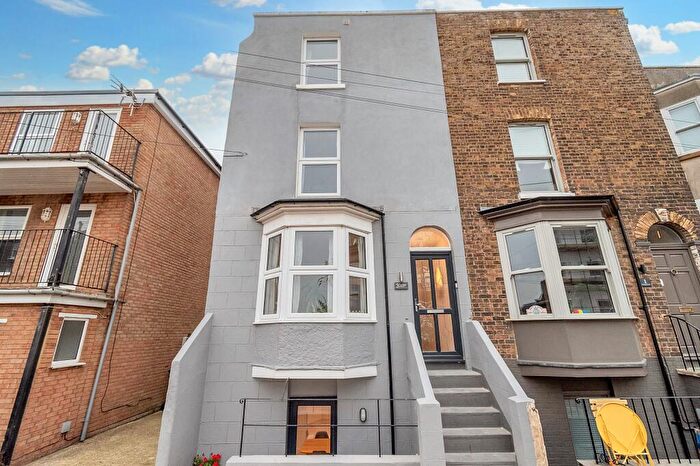
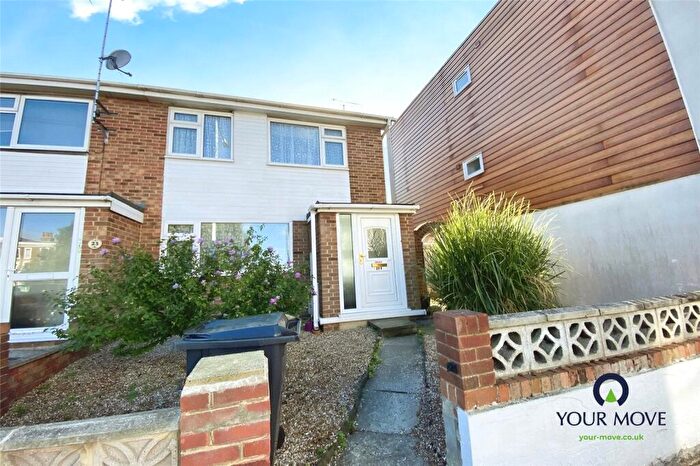
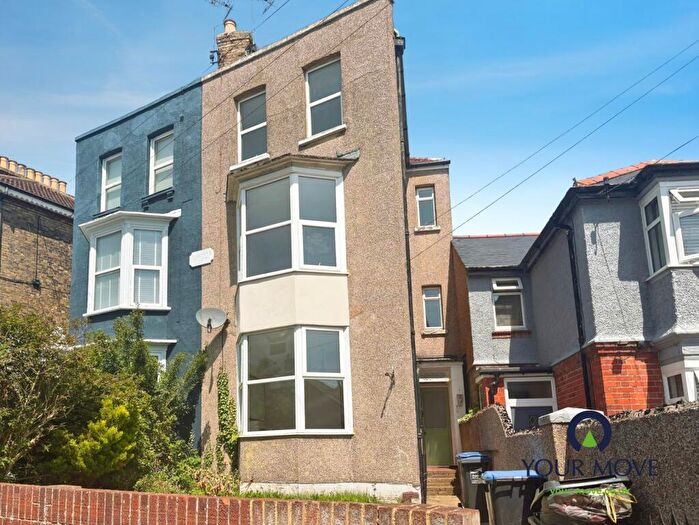
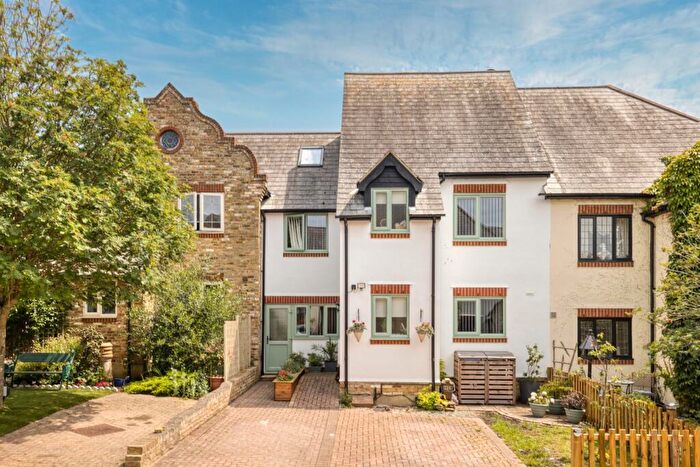
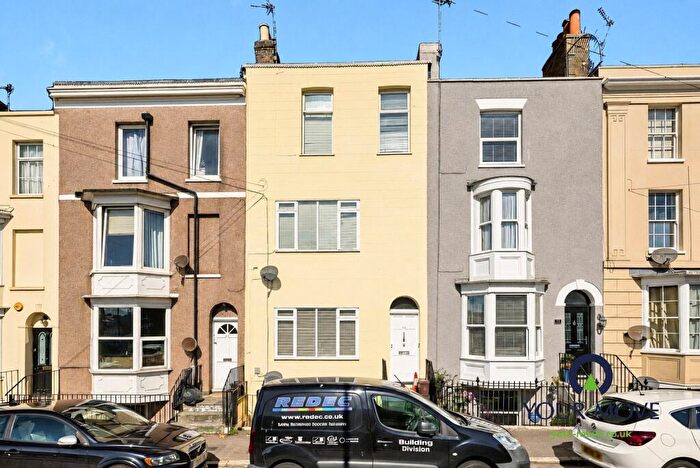
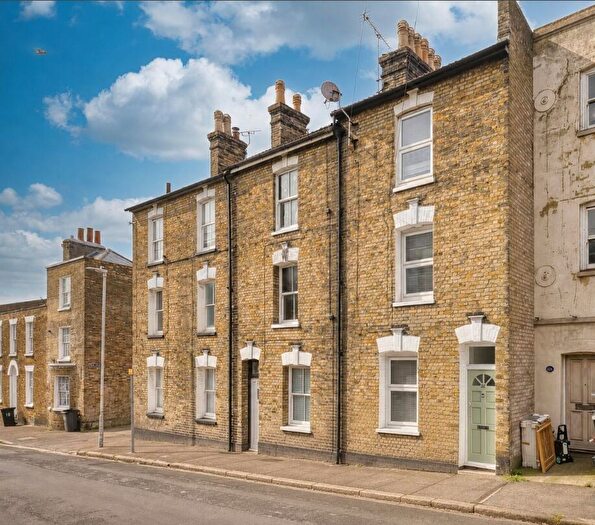
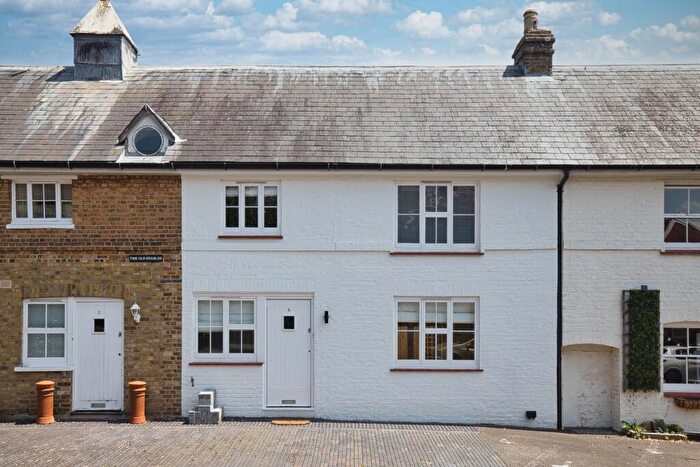
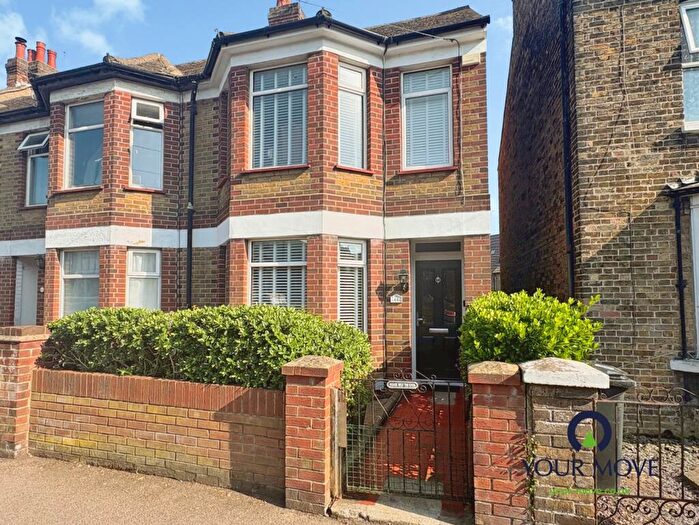
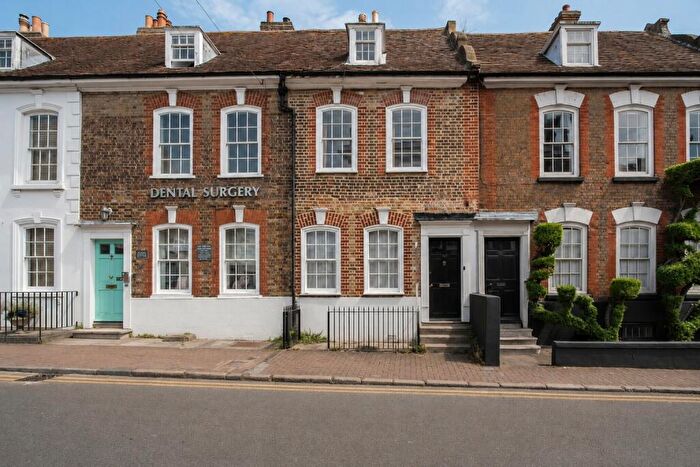
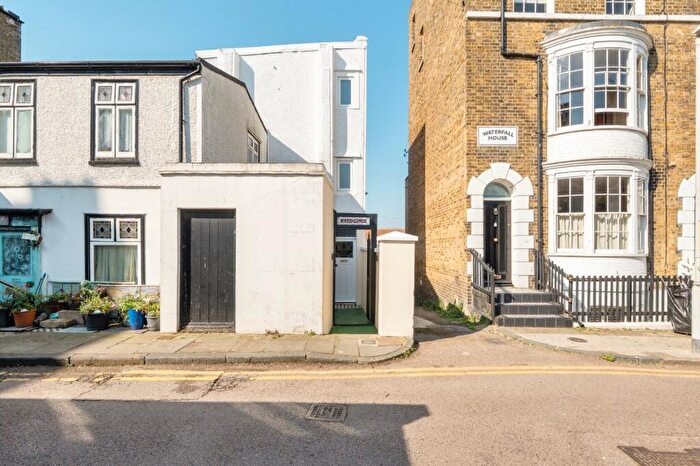
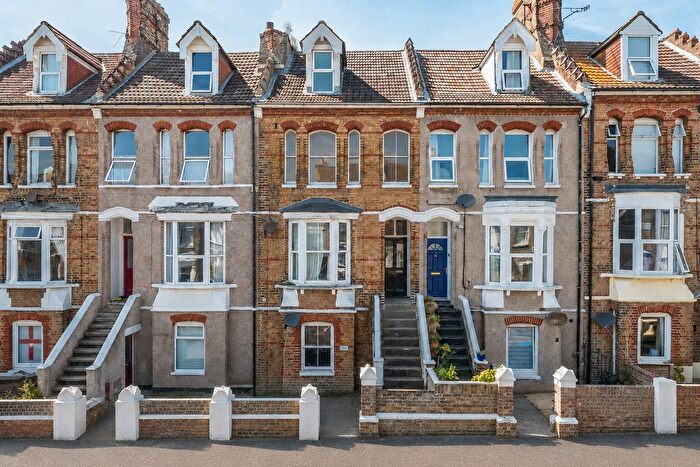
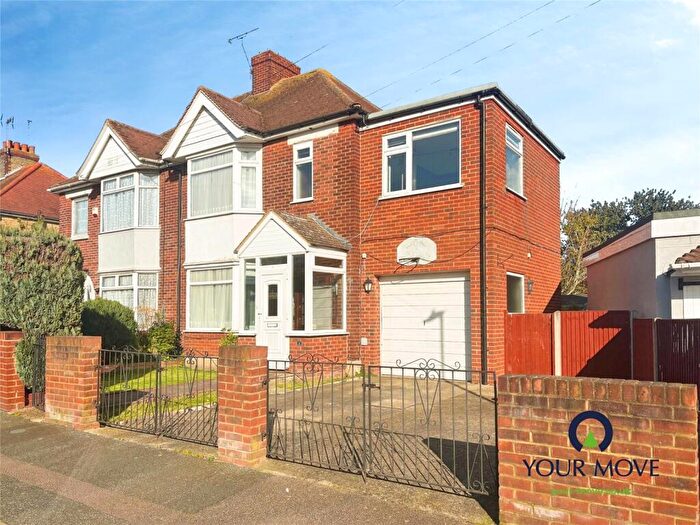
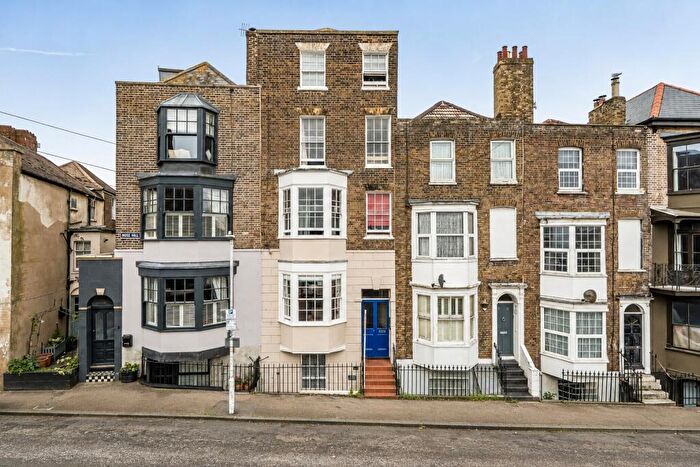
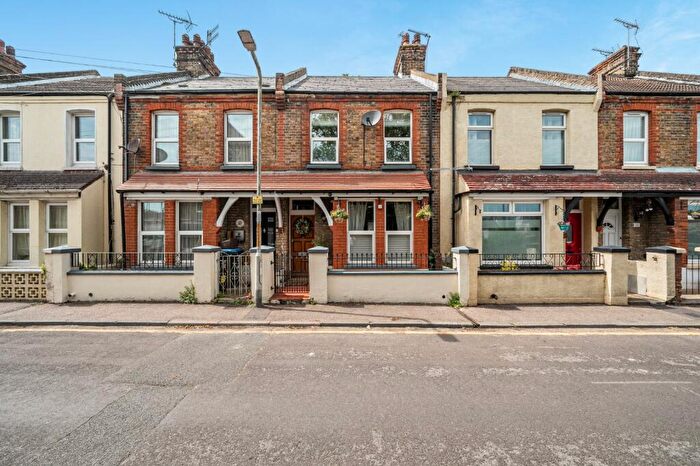
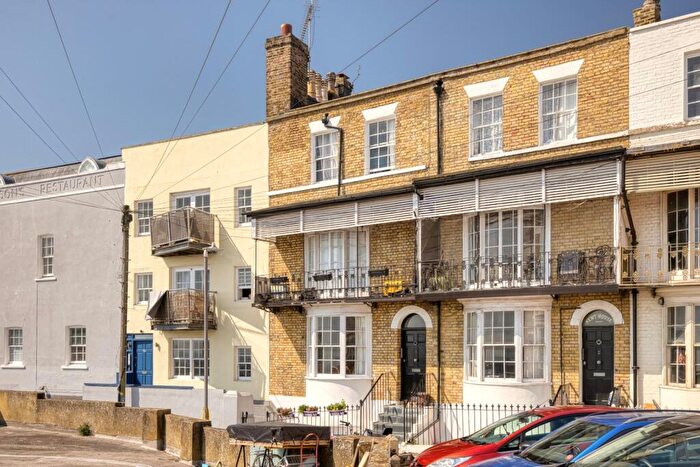
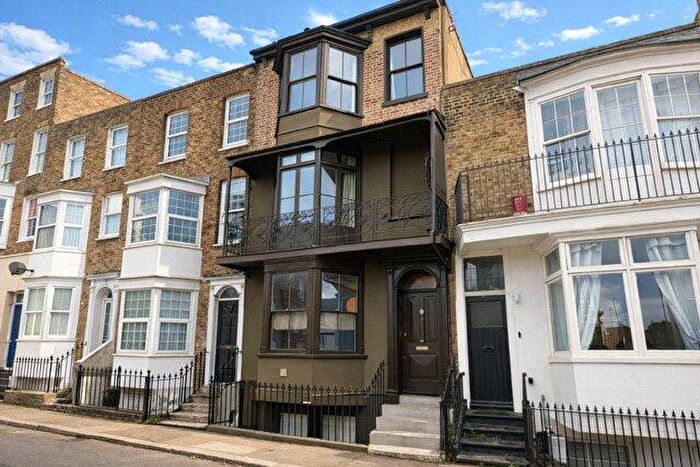
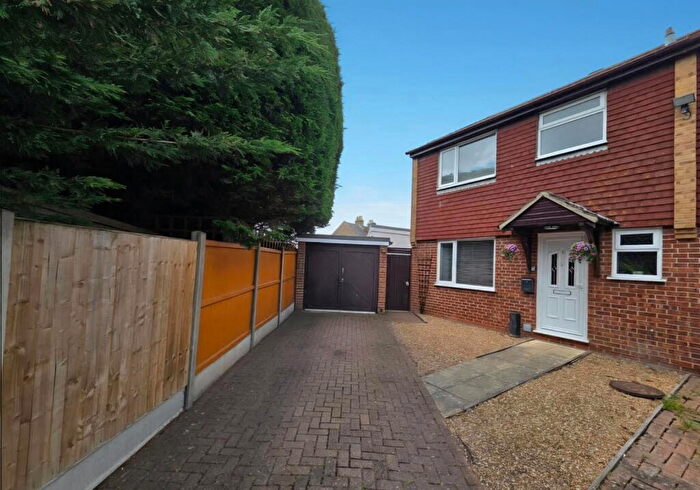
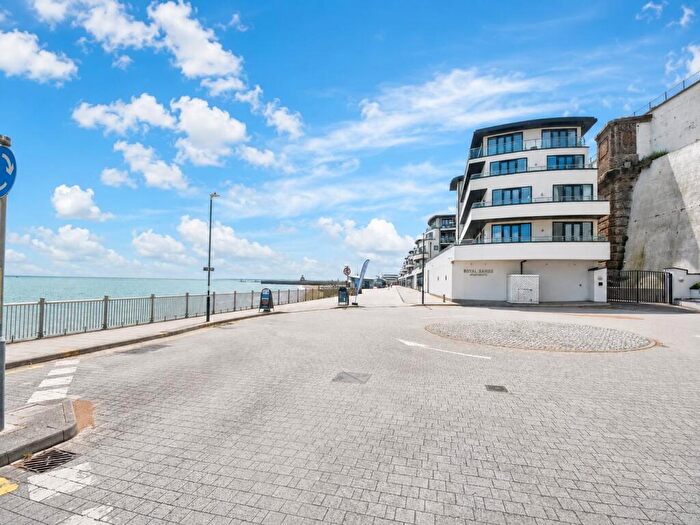
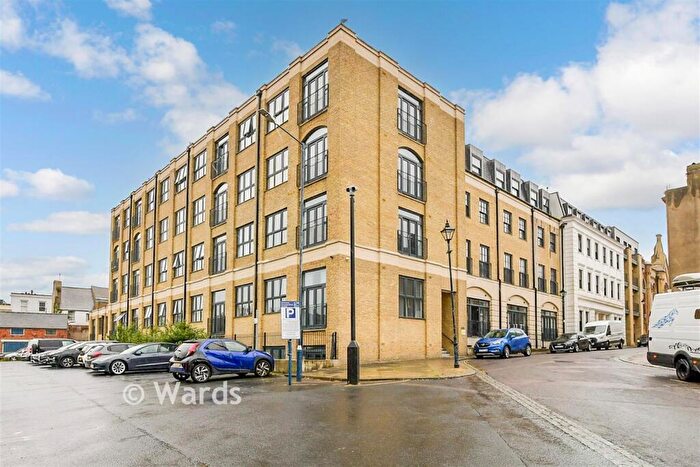
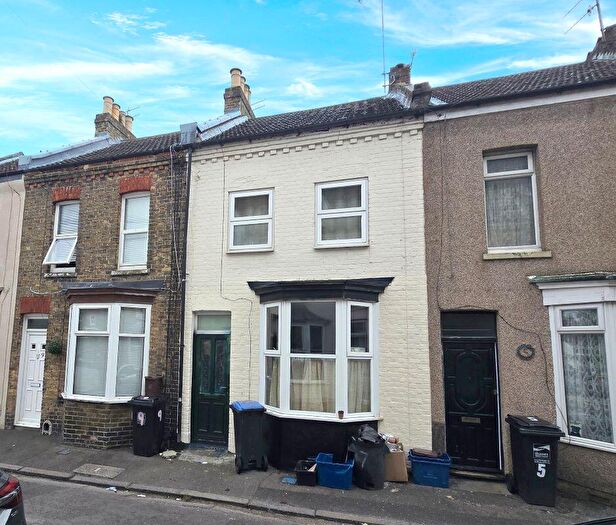
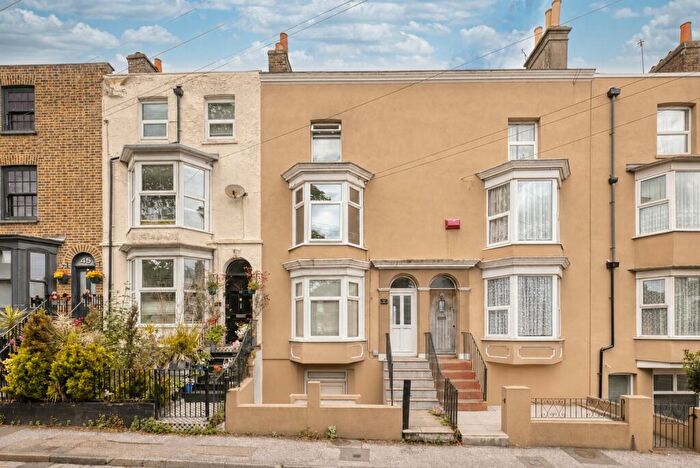
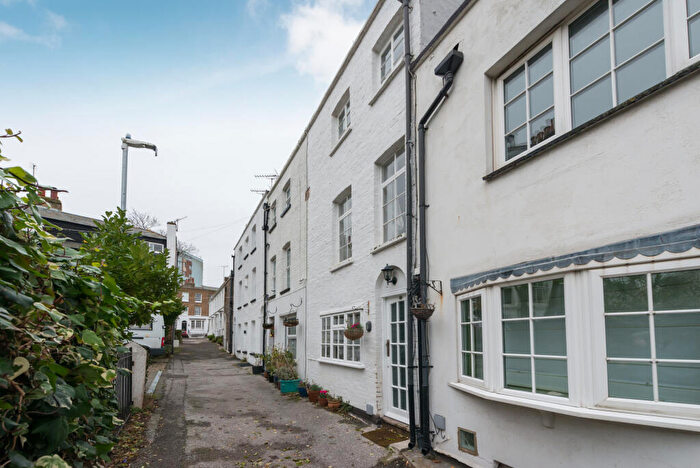
Properties for sale near CT11 9JN, The Broadway
![]()
If you are looking to sell your house, let it out, or receive a property valuation, an expert can help you.
Click the button below to get started.
Price Paid in The Broadway, CT11 9JN, Central Harbour
BROADWAY HOUSE FLAT 1 The Broadway, CT11 9JN, Central Harbour Ramsgate
Property BROADWAY HOUSE FLAT 1 has been sold 3 times. The last time it was sold was in 09/03/2016 and the sold price was £140,000.00.
This is a Flat which was sold as a leasehold in 09/03/2016
| Date | Price | Property Type | Tenure | Classification |
|---|---|---|---|---|
| 09/03/2016 | £140,000.00 | Flat | leasehold | Established Building |
| 27/02/2015 | £89,500.00 | Flat | leasehold | Established Building |
| 28/02/2013 | £65,000.00 | Flat | leasehold | New Build |
THE CHAPEL, 4 The Broadway, CT11 9JN, Central Harbour Ramsgate
Property THE CHAPEL, 4 has been sold 1 time. The last time it was sold was in 06/04/2011 and the sold price was £108,000.00.
This terraced house, sold as a freehold on 06/04/2011, is a 90 sqm detached house with an EPC rating of D.
| Date | Price | Property Type | Tenure | Classification |
|---|---|---|---|---|
| 06/04/2011 | £108,000.00 | Terraced House | freehold | Established Building |
Property price trends in CT11 9JN, The Broadway
According to the latest Land Registry data, the average home in CT11 9JN, The Broadway sold for £140,000 in 2016. That figure comes from 4 sales logged over the past 5 years.
Prices have continued to climb over the last three years. Compared with 2013, when the typical sale came in around £65,000, that's a rise of roughly 115.4%.
Looking back five years, average prices are up about 29.6% since 2011, a gain of around £32,000 in cash terms.
Property Price Paid in CT11 9JN, The Broadway by Year
The average sold property price by year was:
| Year | Average Sold Price | Price Change |
Sold Properties
|
|---|---|---|---|
| 2016 | £140,000 | 36% |
1 Property |
| 2015 | £89,500 | 27% |
1 Property |
| 2013 | £65,000 | -66% |
1 Property |
| 2011 | £108,000 | - |
1 Property |
