
Houses for sale in CT5 1EF, Island Wall, Harbour, Whitstable
House Prices in CT5 1EF, Island Wall, Harbour
Properties in CT5 1EF have no sales history available within the last 3 years. CT5 1EF is a postcode in Island Wall located in Harbour, an area in Whitstable, Kent, with 1 household².
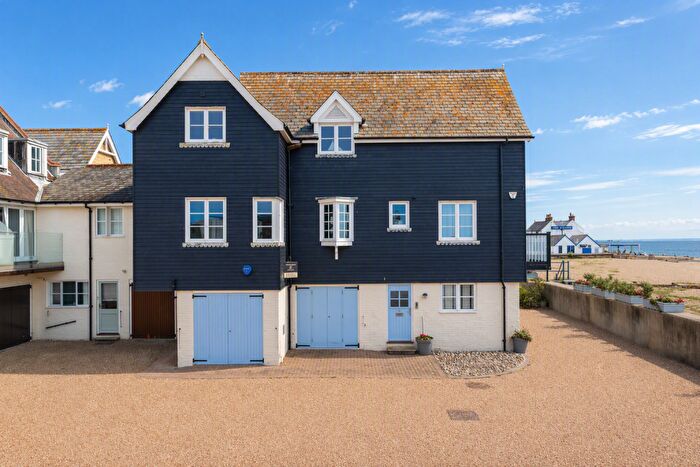
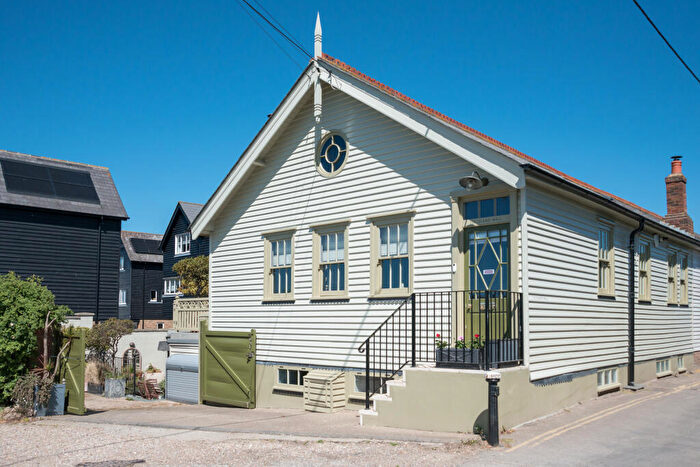
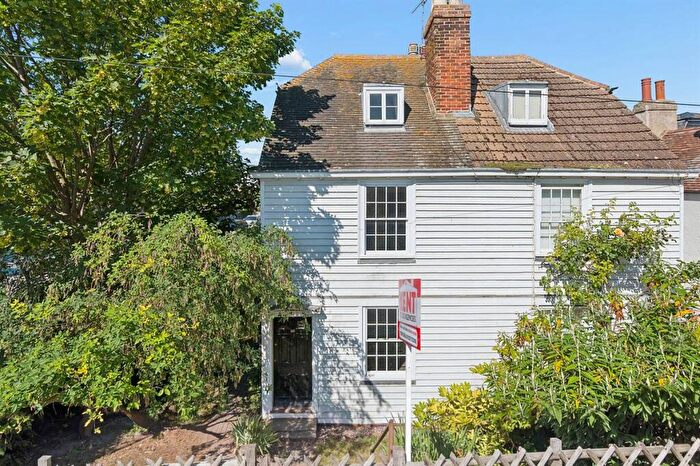
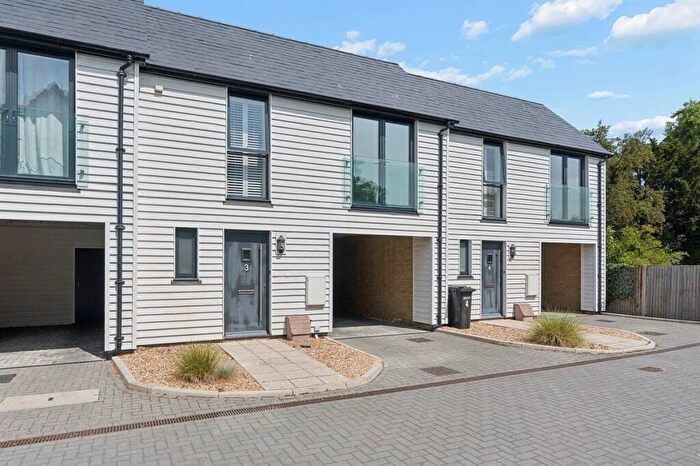
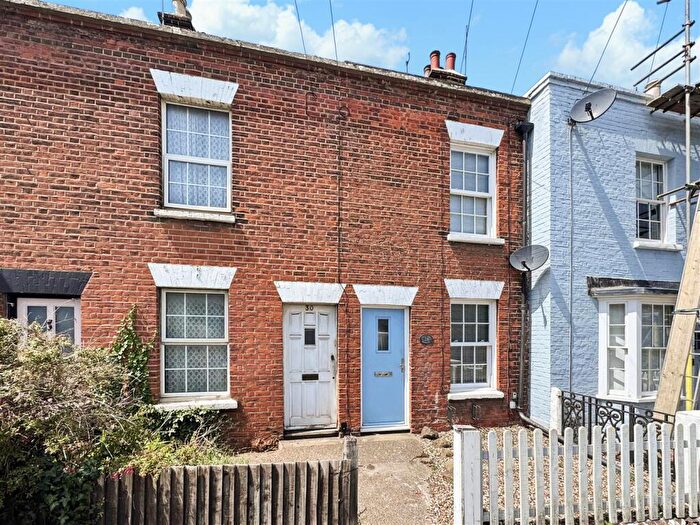
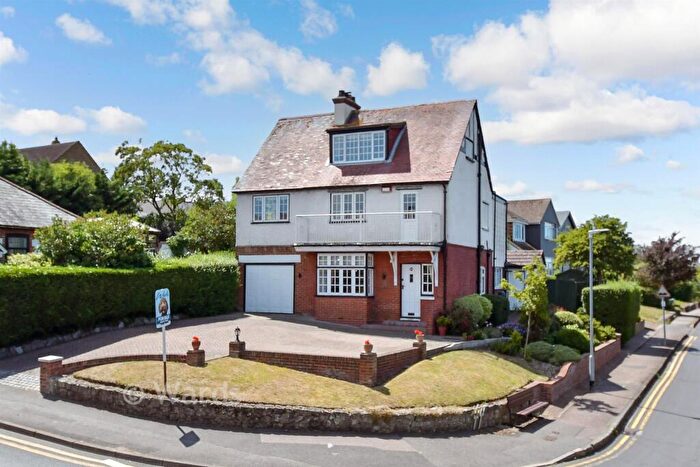
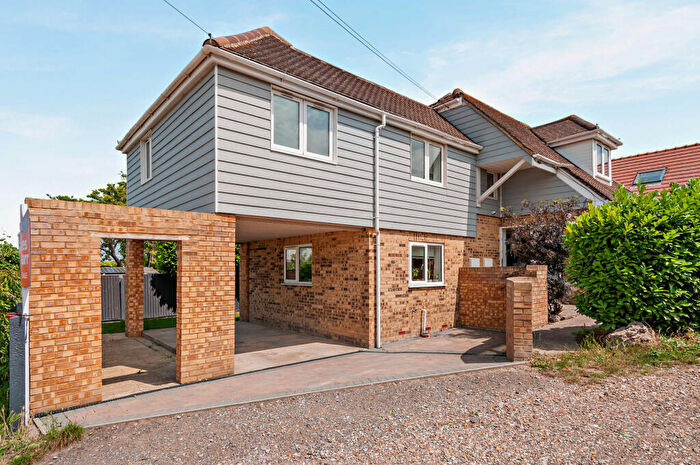
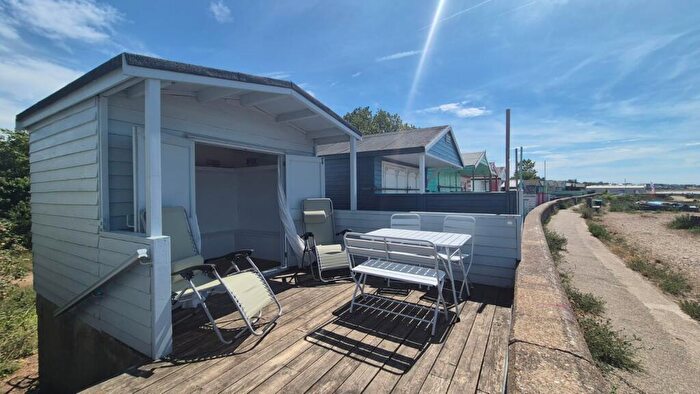
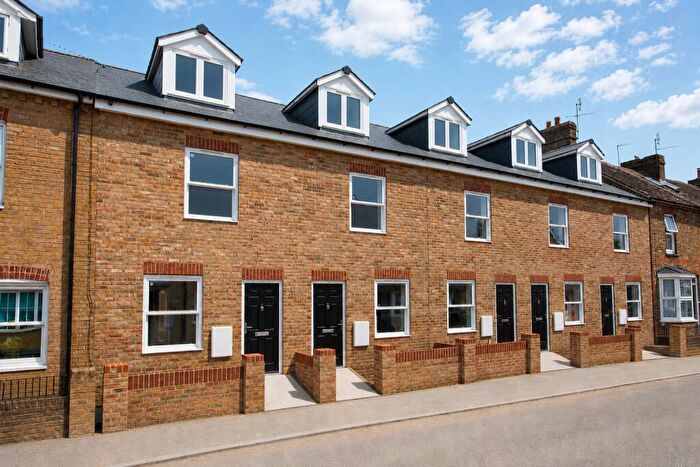
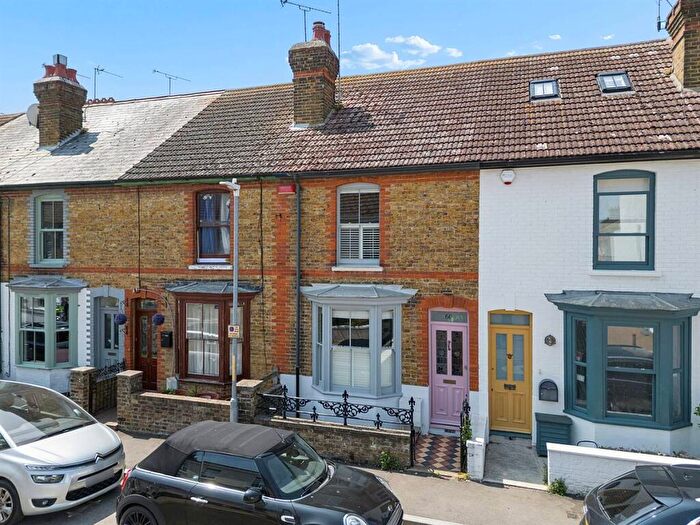
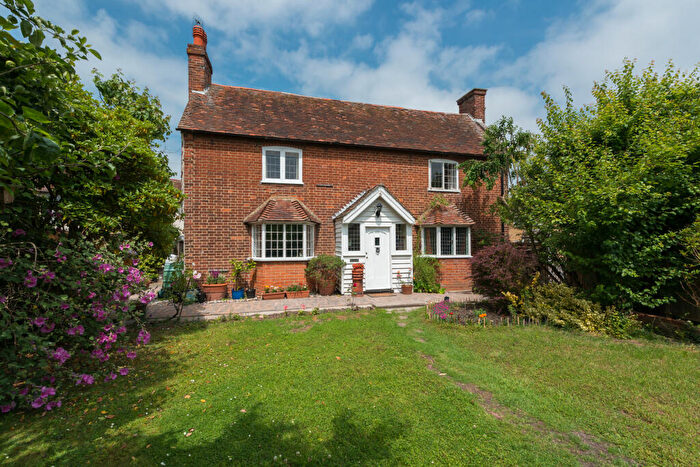
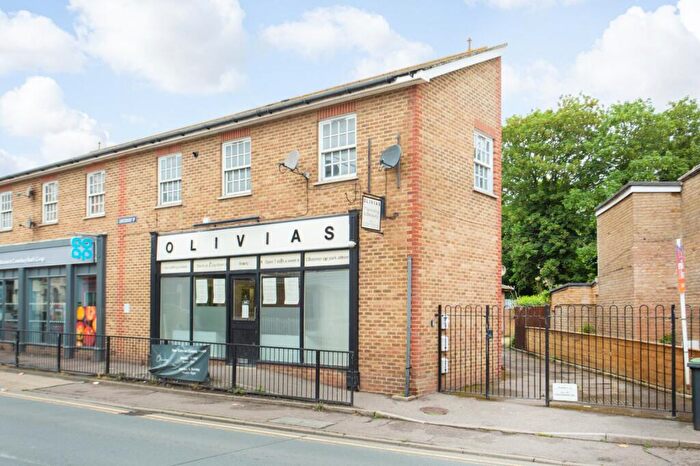
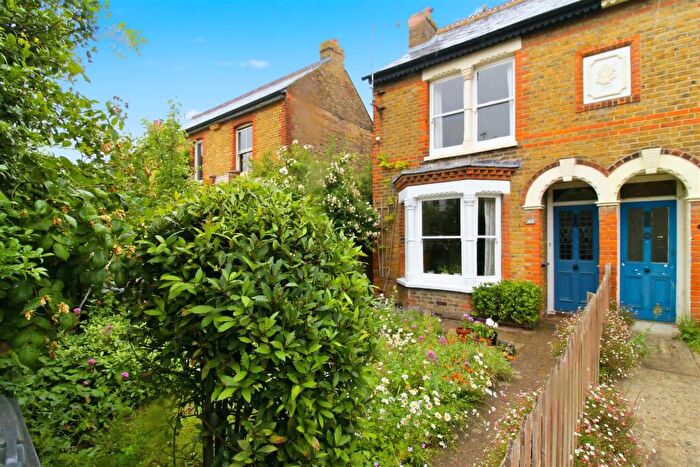
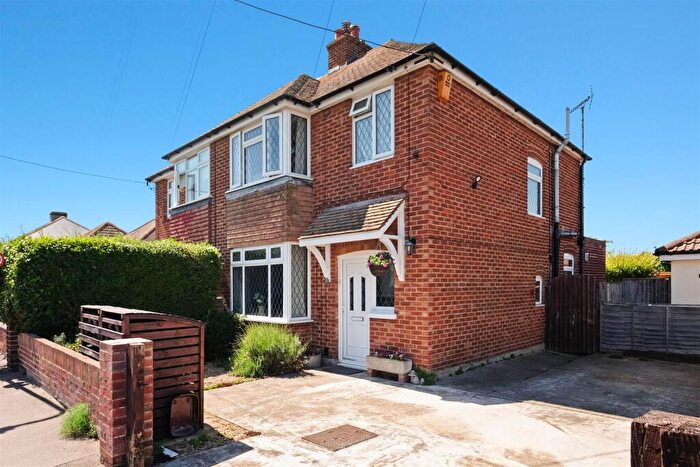
Properties for sale near CT5 1EF, Island Wall
![]()
If you are looking to sell your house, let it out, or receive a property valuation, an expert can help you.
Click the button below to get started.
Price Paid in Island Wall, CT5 1EF, Harbour
191 Island Wall, CT5 1EF, Harbour Whitstable
Property 191 has been sold 3 times. The last time it was sold was in 01/05/2009 and the sold price was £820,000.00.
This is a Detached House which was sold as a freehold in 01/05/2009
| Date | Price | Property Type | Tenure | Classification |
|---|---|---|---|---|
| 01/05/2009 | £820,000.00 | Detached House | freehold | Established Building |
| 06/09/2002 | £465,000.00 | Detached House | freehold | Established Building |
| 14/06/2000 | £310,000.00 | Detached House | freehold | New Build |
189 Island Wall, CT5 1EF, Harbour Whitstable
Property 189 has been sold 2 times. The last time it was sold was in 06/03/2006 and the sold price was £660,000.00.
This is a Detached House which was sold as a freehold in 06/03/2006
| Date | Price | Property Type | Tenure | Classification |
|---|---|---|---|---|
| 06/03/2006 | £660,000.00 | Detached House | freehold | Established Building |
| 23/08/2000 | £295,000.00 | Detached House | freehold | New Build |
Postcodes in Island Wall, Harbour
Navigate through other locations in Island Wall, Harbour, Whitstable to see more property listings for sale or to rent.
Property price trends in CT5 1EF, Island Wall
According to the latest Land Registry data, the average home in CT5 1EF, Island Wall sold for £820,000 in 2009. That figure comes from 5 sales logged over the past 9 years.
Prices have continued to climb over the last three years. Compared with 2006, when the typical sale came in around £660,000, that's a rise of roughly 24.2%.
Zoom out to the past decade for the fuller picture. Back in 2000, homes here averaged £302,500, so the typical sold price has climbed about 171.1% since then, roughly 11.7% a year.
Property Price Paid in CT5 1EF, Island Wall by Year
The average sold property price by year was:
| Year | Average Sold Price | Price Change |
Sold Properties
|
|---|---|---|---|
| 2009 | £820,000 | 20% |
1 Property |
| 2006 | £660,000 | 30% |
1 Property |
| 2002 | £465,000 | 35% |
1 Property |
| 2000 | £302,500 | - |
2 Properties |
