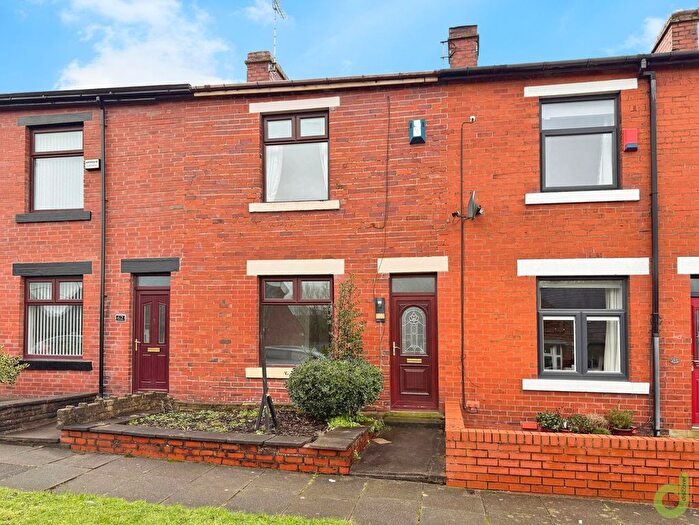
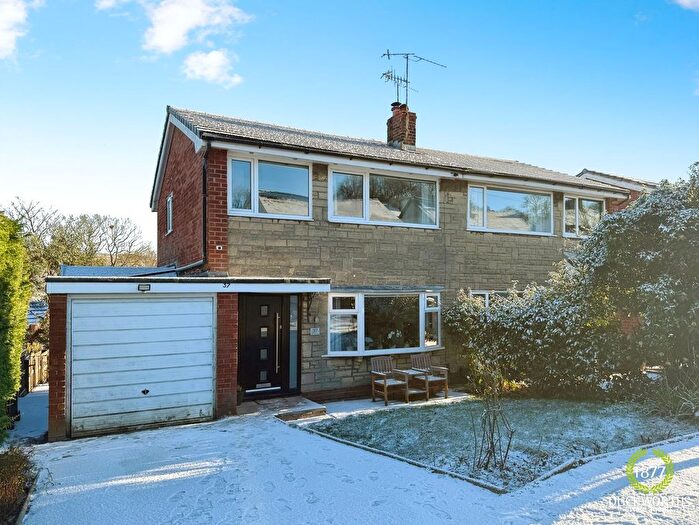
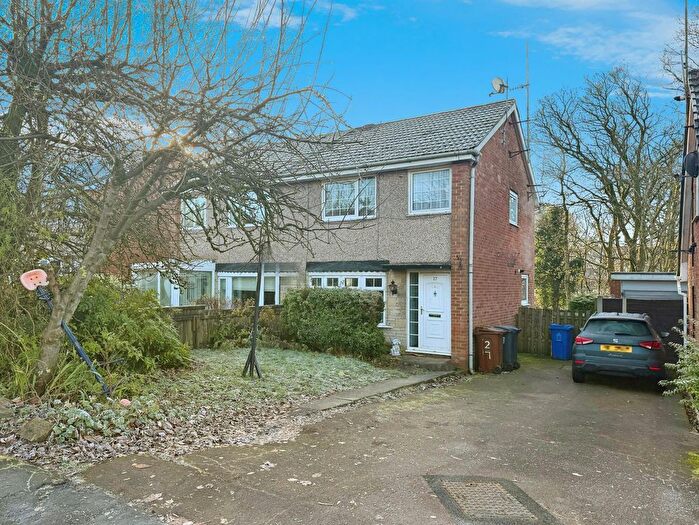
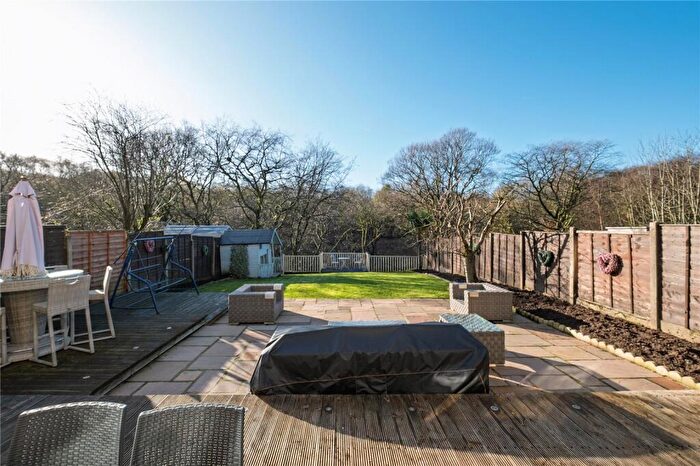
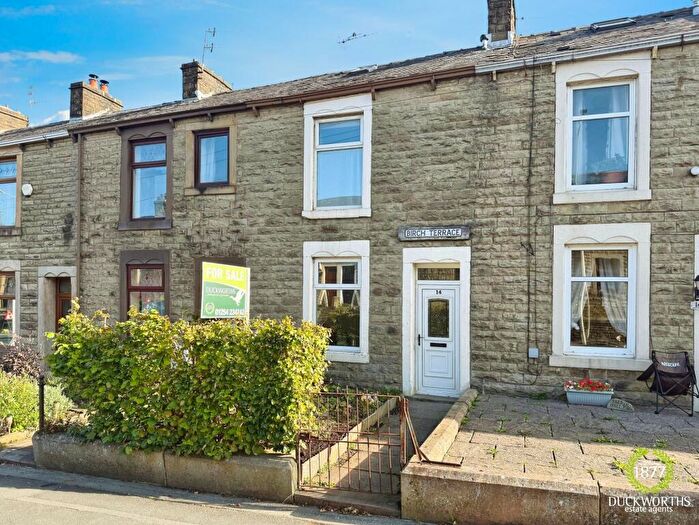
Houses for sale & to rent in Baxenden, Accrington
House Prices in Baxenden
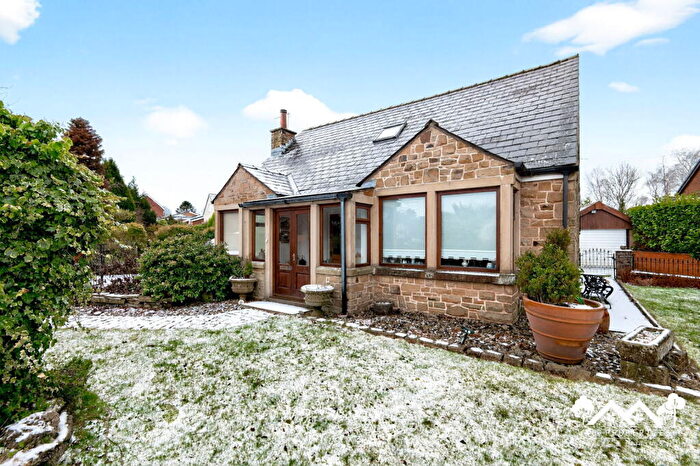
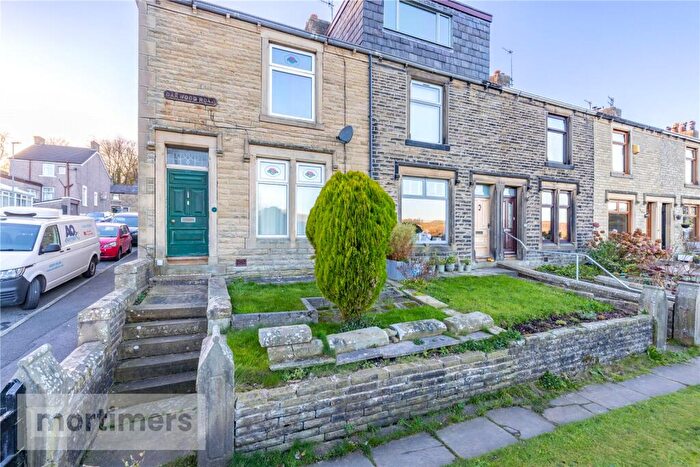
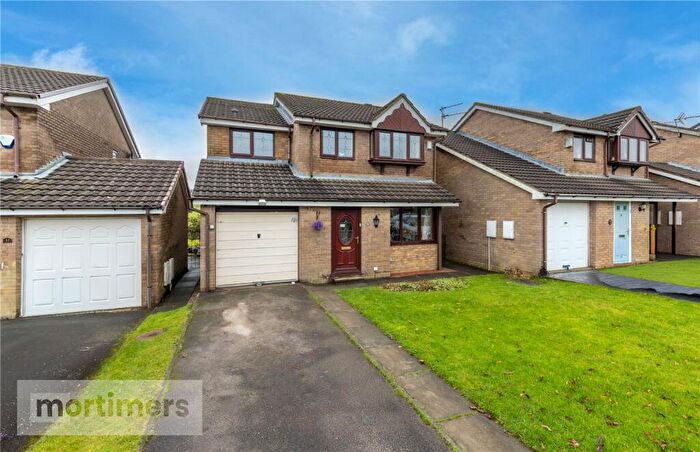
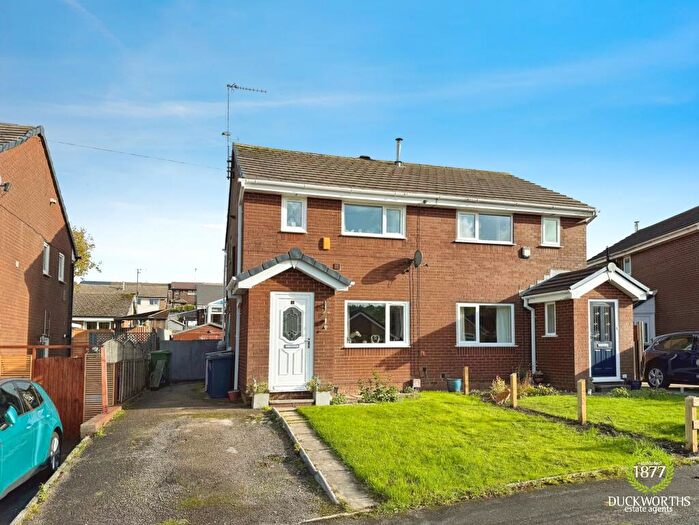
Properties in Baxenden have an average house price of £209,575.00 and had 167 Property Transactions within the last 3 years¹.
Baxenden is an area in Accrington, Lancashire with 1,684 households², where the most expensive property was sold for £642,000.00.
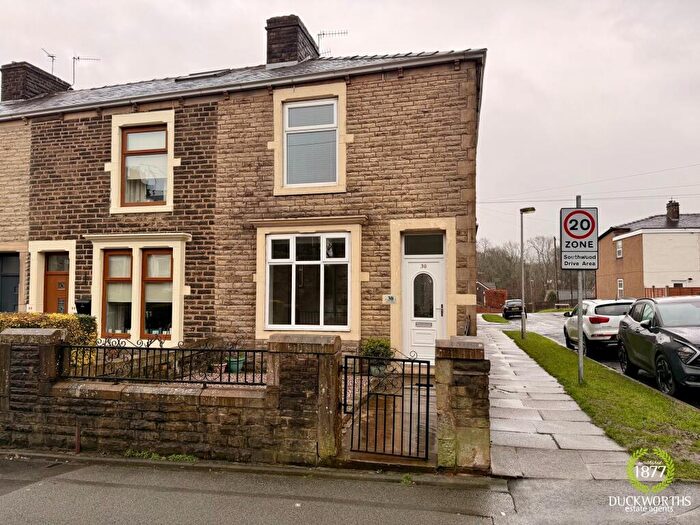
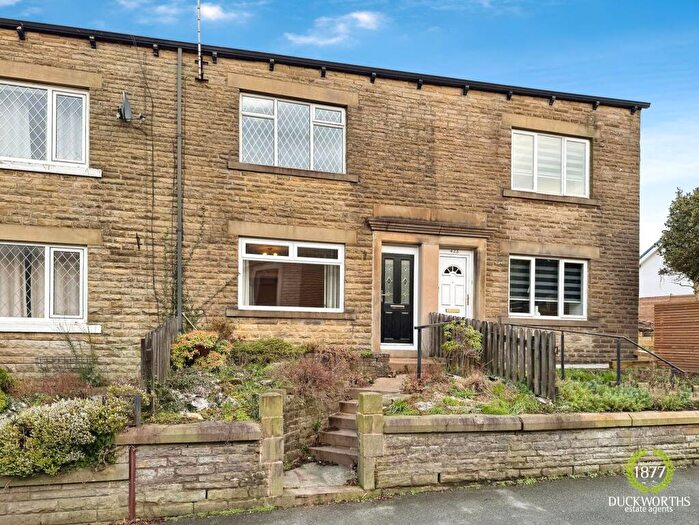
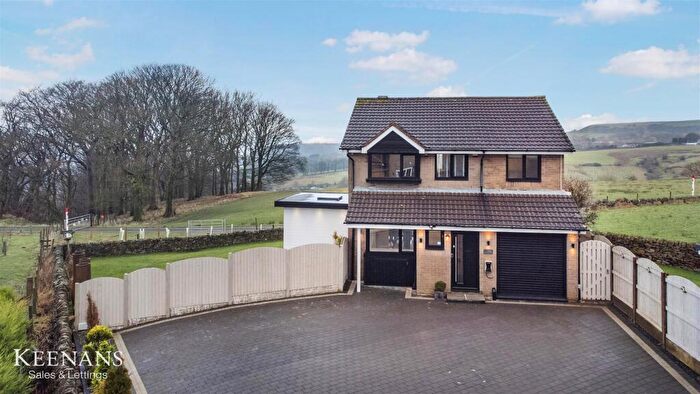
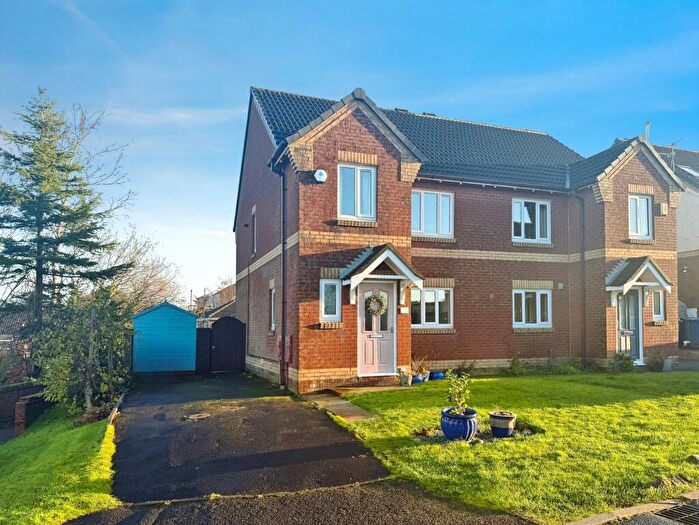
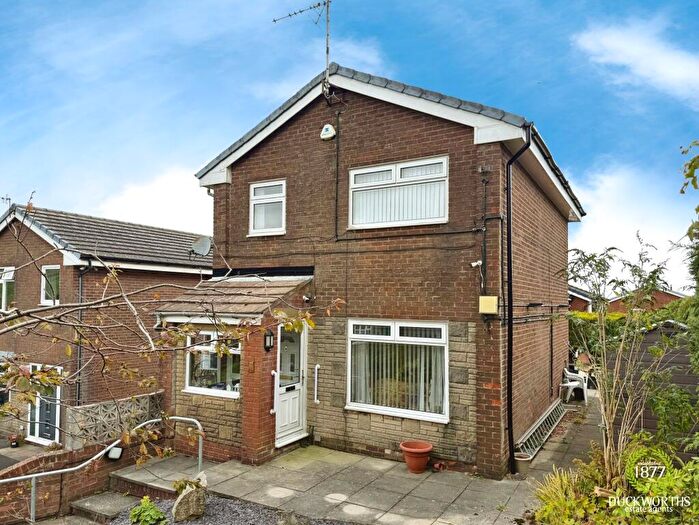
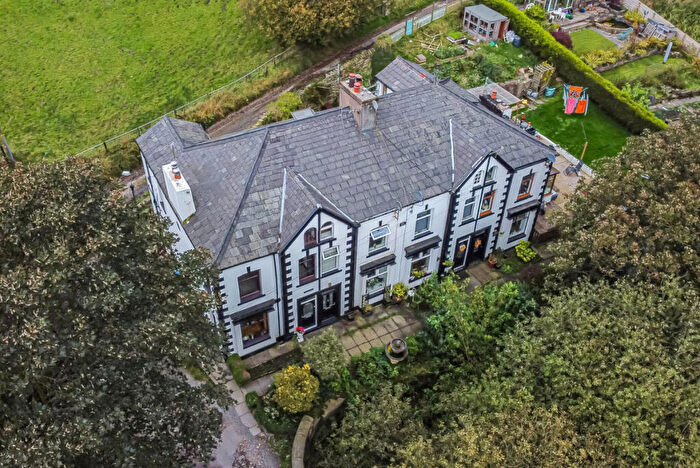
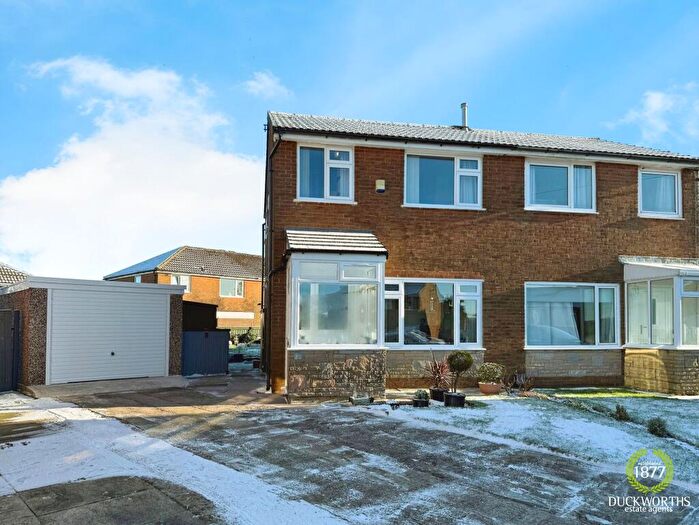
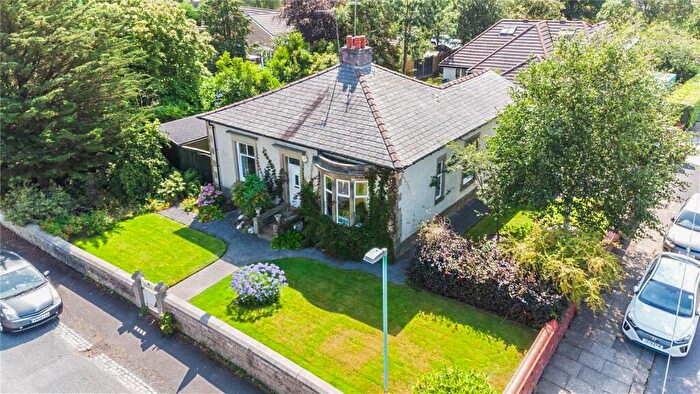
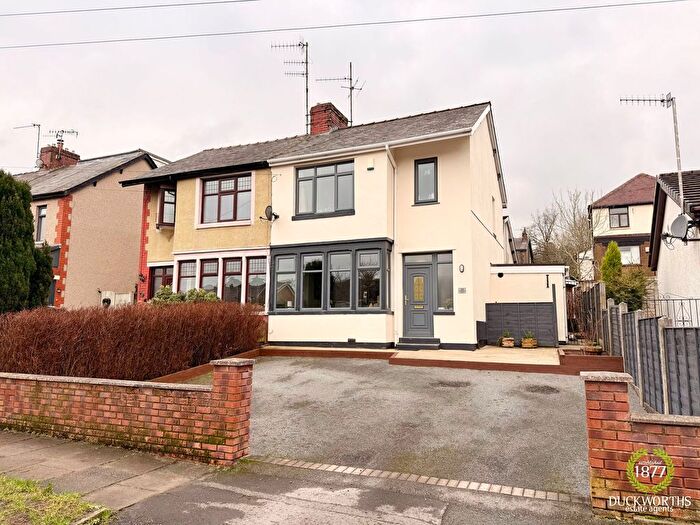
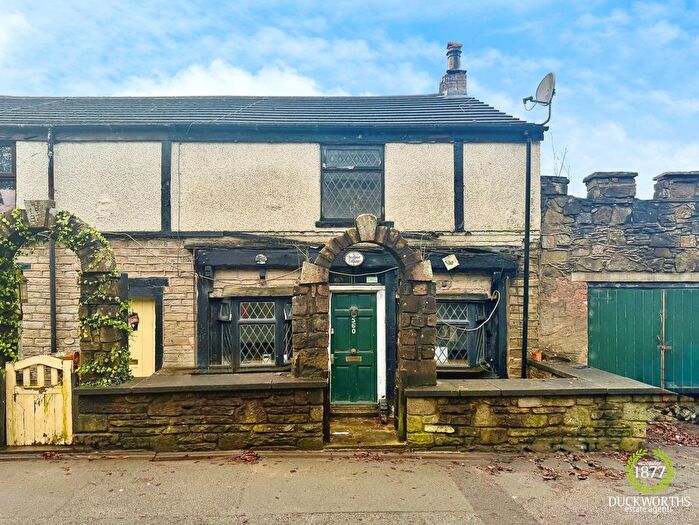
Properties for sale in Baxenden
Previously listed properties in Baxenden
Roads and Postcodes in Baxenden
Navigate through our locations to find the location of your next house in Baxenden, Accrington for sale or to rent.
| Streets | Postcodes |
|---|---|
| Alexander Close | BB5 2SY |
| Alliance Street | BB5 2RT |
| Alma Place | BB5 2RR |
| Ashworth Street | BB5 2QB |
| Back Lane | BB5 2DZ BB5 2RE BB5 2SF BB5 2TB |
| Bamford Crescent | BB5 2PQ |
| Beechwood Avenue | BB5 2PL |
| Birch Terrace | BB5 2QE |
| Bridge Houses | BB5 2RS |
| Broad Oak Road | BB5 2DE BB5 2DF |
| Brooke Close | BB5 2QX |
| Burns Drive | BB5 2PY |
| Byron Close | BB5 2QT |
| Chatterton Drive | BB5 2TD |
| Church Avenue | BB5 2RQ |
| Coleridge Drive | BB5 2PU |
| Collier Street | BB5 2QQ |
| Collins Drive | BB5 2QU |
| Edward Street | BB5 2RW |
| Glenmore Close | BB5 2TF |
| Grafton Avenue | BB5 2PT |
| Grafton Gardens | BB5 2TY |
| Green Haworth | BB5 3SL |
| Hameldon Avenue | BB5 2QD |
| Haworth Avenue | BB5 2PH |
| Henry Street | BB5 2PB |
| Hexham Close | BB5 2TJ |
| Hill Street | BB5 2RB BB5 2RA |
| Hilltop Mews | BB5 2QW |
| Hollins Lane | BB5 2JS BB5 2JU BB5 2QY |
| Hurstead Street | BB5 2RH |
| Icconhurst Close | BB5 2XF |
| Ing Cottages | BB5 2RJ |
| Keats Close | BB5 2QR |
| Langcliffe Close | BB5 2TG |
| Langford Street | BB5 2RF |
| Laund Grove | BB5 2PN |
| Laund Road | BB5 2PP |
| Ley Street | BB5 2QH |
| Manchester Road | BB5 2PF BB5 2QF BB5 2QG BB5 2QJ BB5 2QL BB5 2RG BB5 2RU BB5 2RX |
| Marlowe Avenue | BB5 2QA |
| Montgomery Close | BB5 2ET |
| Newton Drive | BB5 2JT |
| Oakwood Road | BB5 2PG |
| Partridge Drive | BB5 2RL |
| Pilling Avenue | BB5 2QN |
| Rock Street | BB5 2TE |
| Roundhill Road | BB5 3SW |
| Royds Avenue | BB5 2JX |
| Sandybeds Close | BB5 2XG |
| Scott Avenue | BB5 2XA |
| Selby Close | BB5 2TQ |
| Shap Close | BB5 2TL |
| Shelley Drive | BB5 2QS |
| Sherbourne Road | BB5 2TW |
| Southwood Drive | BB5 2PZ BB5 2TU BB5 2TX |
| St Johns Close | BB5 2XE |
| Swinburne Close | BB5 2PX |
| Sycamore Grove | BB5 2PS |
| Tewkesbury Close | BB5 2TN |
| Tintern Close | BB5 2TH |
| Turkey Red Industrial Estate | BB5 2SZ |
| Vicarage Lane | BB5 2RD |
| Victoria Avenue | BB5 2XD |
| Waltham Close | BB5 2TP |
| Warmden Avenue | BB5 2PR |
| Wavell Close | BB5 2SX |
| Waverley Road | BB5 2TT |
| Westminster Close | BB5 2TR |
| White Acre Road | BB5 2RN |
| Whitecroft View | BB5 2QP |
| Woburn Close | BB5 2TS |
| Woodfield Avenue | BB5 2PJ |
| Wooley Lane | BB5 2EA BB5 2XB |
| Worsley Street | BB5 2PA |
Transport near Baxenden
- FAQ
- Price Paid By Year
- Property Type Price
Frequently asked questions about Baxenden
What is the average price for a property for sale in Baxenden?
The average price for a property for sale in Baxenden is £209,575. This amount is 55% higher than the average price in Accrington. There are 203 property listings for sale in Baxenden.
What streets have the most expensive properties for sale in Baxenden?
The streets with the most expensive properties for sale in Baxenden are Green Haworth at an average of £450,000, Wooley Lane at an average of £411,000 and Wavell Close at an average of £393,000.
What streets have the most affordable properties for sale in Baxenden?
The streets with the most affordable properties for sale in Baxenden are Alliance Street at an average of £88,950, Edward Street at an average of £97,500 and Ashworth Street at an average of £118,222.
Which train stations are available in or near Baxenden?
Some of the train stations available in or near Baxenden are Accrington, Church and Oswaldtwistle and Huncoat.
Property Price Paid in Baxenden by Year
The average sold property price by year was:
| Year | Average Sold Price | Price Change |
Sold Properties
|
|---|---|---|---|
| 2025 | £197,988 | -17% |
50 Properties |
| 2024 | £231,696 | 18% |
68 Properties |
| 2023 | £190,702 | -8% |
49 Properties |
| 2022 | £205,549 | 3% |
69 Properties |
| 2021 | £199,316 | 7% |
92 Properties |
| 2020 | £184,562 | 9% |
78 Properties |
| 2019 | £168,137 | 3% |
64 Properties |
| 2018 | £162,813 | 1% |
67 Properties |
| 2017 | £161,850 | 7% |
88 Properties |
| 2016 | £151,303 | 15% |
65 Properties |
| 2015 | £128,929 | -12% |
68 Properties |
| 2014 | £144,615 | 6% |
54 Properties |
| 2013 | £136,566 | -1% |
51 Properties |
| 2012 | £137,549 | 3% |
46 Properties |
| 2011 | £134,109 | -9% |
50 Properties |
| 2010 | £145,794 | -4% |
36 Properties |
| 2009 | £151,139 | -8% |
44 Properties |
| 2008 | £163,485 | 8% |
37 Properties |
| 2007 | £150,611 | 8% |
84 Properties |
| 2006 | £138,676 | 6% |
105 Properties |
| 2005 | £130,667 | 4% |
64 Properties |
| 2004 | £125,113 | 27% |
113 Properties |
| 2003 | £91,507 | 21% |
89 Properties |
| 2002 | £72,242 | 11% |
96 Properties |
| 2001 | £64,618 | 1% |
87 Properties |
| 2000 | £64,168 | 8% |
87 Properties |
| 1999 | £58,760 | -4% |
103 Properties |
| 1998 | £61,093 | 3% |
83 Properties |
| 1997 | £59,103 | 16% |
97 Properties |
| 1996 | £49,509 | -14% |
87 Properties |
| 1995 | £56,205 | - |
75 Properties |
Property Price per Property Type in Baxenden
Here you can find historic sold price data in order to help with your property search.
The average Property Paid Price for specific property types in the last three years are:
| Property Type | Average Sold Price | Sold Properties |
|---|---|---|
| Semi Detached House | £212,563.00 | 69 Semi Detached Houses |
| Detached House | £313,747.00 | 43 Detached Houses |
| Terraced House | £122,757.00 | 53 Terraced Houses |
| Flat | £167,500.00 | 2 Flats |

