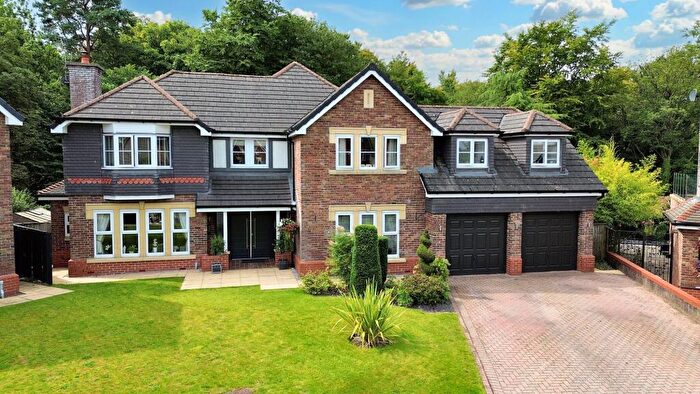
Houses for sale & to rent in Billington And Old Langho, Blackburn
House Prices in Billington And Old Langho
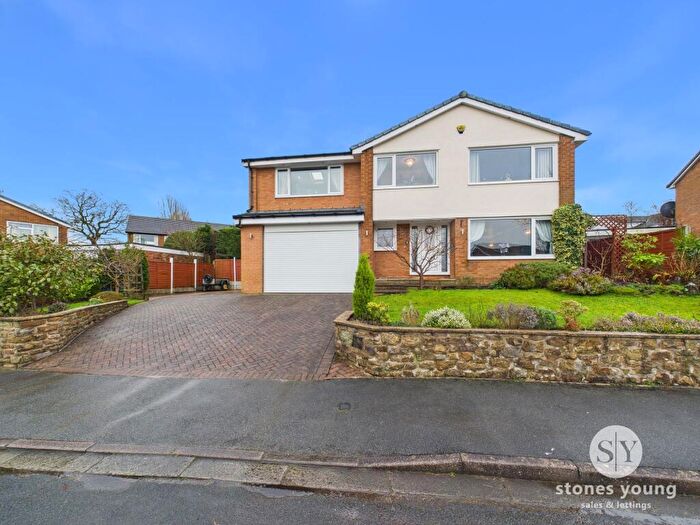
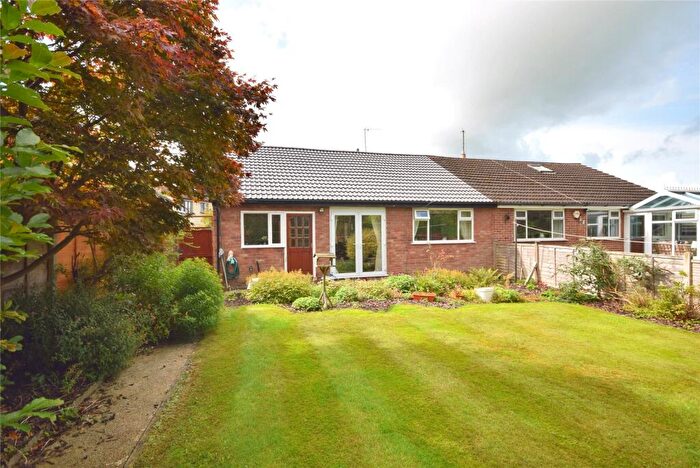
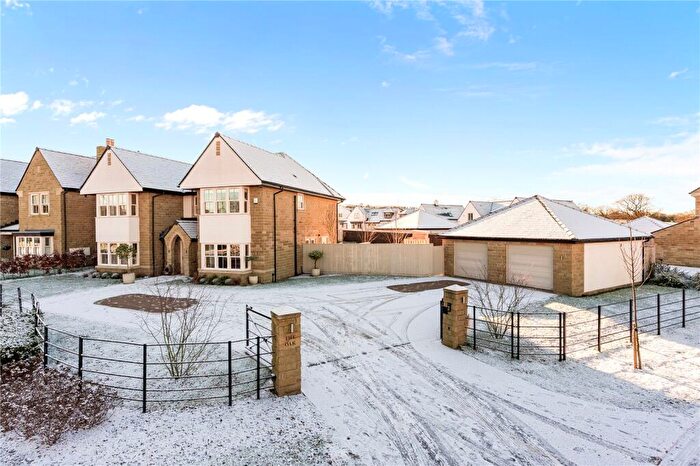
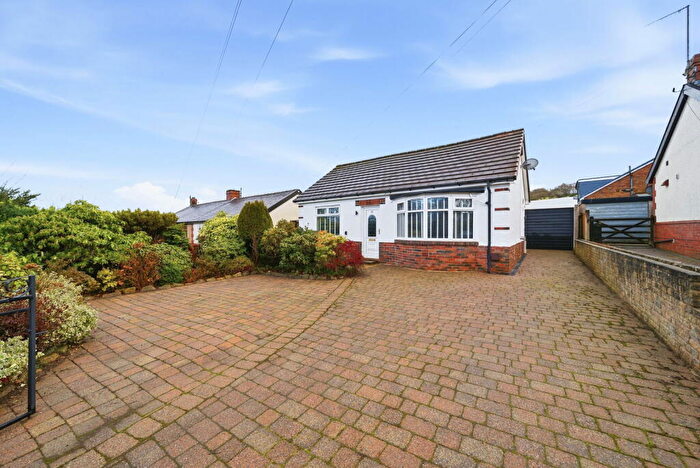
Properties in Billington And Old Langho have an average house price of £521,068.00 and had 48 Property Transactions within the last 3 years¹.
Billington And Old Langho is an area in Blackburn, Lancashire with 434 households², where the most expensive property was sold for £1,650,000.00.
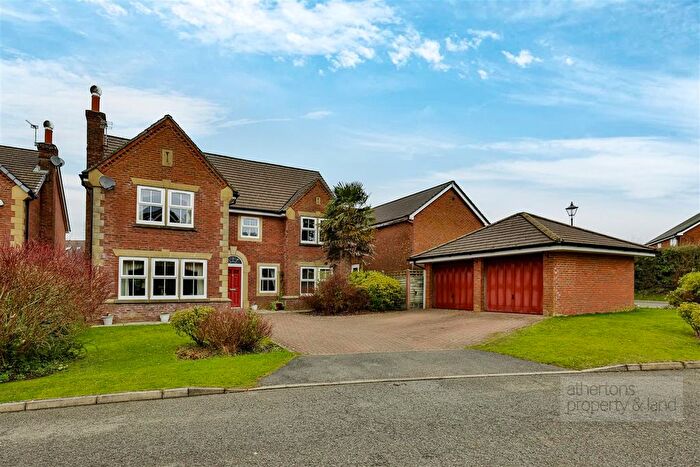
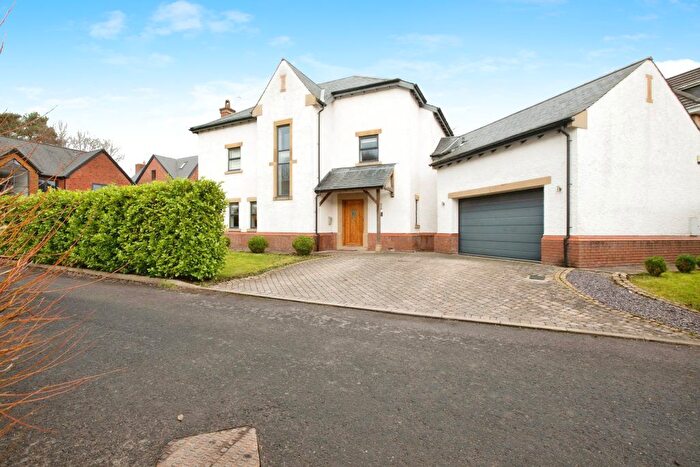
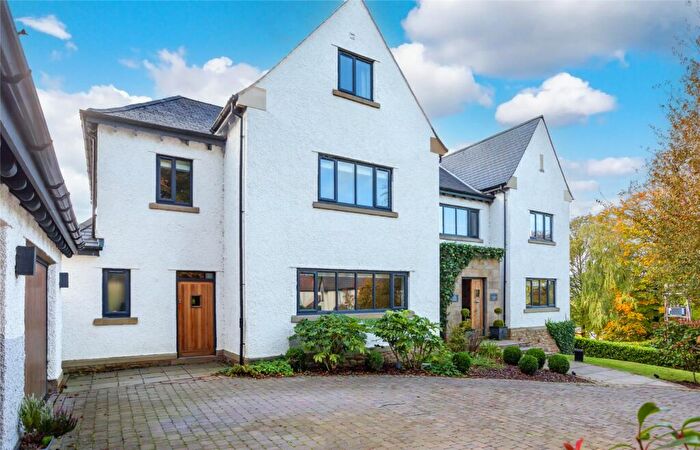
Properties for sale in Billington And Old Langho
Roads and Postcodes in Billington And Old Langho
Navigate through our locations to find the location of your next house in Billington And Old Langho, Blackburn for sale or to rent.
| Streets | Postcodes |
|---|---|
| Bowling Green Cottages | BB6 8BL |
| Bradyll Court | BB6 8AS |
| Brockhall Village | BB6 8AY BB6 8BB |
| Brookside | BB6 8AP |
| Chapel Close | BB6 8HU |
| Cherry Drive | BB6 8DX BB6 8HJ |
| Damson Close | BB6 8HL |
| Dickens Court | BB6 8HT |
| Eden Gardens | BB6 8HW |
| Elm Tree Grove | BB6 8HP |
| Franklin Hill | BB6 8HY |
| Gleneagles Drive | BB6 8BF |
| Highwoods Park | BB6 8HN |
| Lanchester Gardens | BB6 8DE |
| Langho Woods | BB6 8AG |
| Larkhill | BB6 8AR |
| Masefield Close | BB6 8HS |
| Netherwood Gardens | BB6 8HR |
| Old Nab Road | BB6 8DY |
| Pendle View | BB6 8AT |
| Provence Avenue | BB6 8DF |
| St Andrews Road | BB6 8BP BB6 8BS |
| The Drive | BB6 8BJ |
| The Woodlands | BB6 8BH |
| Tuscany Grove | BB6 8DG |
| Watling Gate | BB6 8BN |
Transport near Billington And Old Langho
- FAQ
- Price Paid By Year
- Property Type Price
Frequently asked questions about Billington And Old Langho
What is the average price for a property for sale in Billington And Old Langho?
The average price for a property for sale in Billington And Old Langho is £521,068. This amount is 141% higher than the average price in Blackburn. There are 290 property listings for sale in Billington And Old Langho.
What streets have the most expensive properties for sale in Billington And Old Langho?
The streets with the most expensive properties for sale in Billington And Old Langho are Franklin Hill at an average of £1,286,250, Eden Gardens at an average of £950,000 and Old Nab Road at an average of £763,500.
What streets have the most affordable properties for sale in Billington And Old Langho?
The streets with the most affordable properties for sale in Billington And Old Langho are Watling Gate at an average of £180,000, St Andrews Road at an average of £214,975 and Larkhill at an average of £227,950.
Which train stations are available in or near Billington And Old Langho?
Some of the train stations available in or near Billington And Old Langho are Langho, Whalley and Ramsgreave and Wilpshire.
Property Price Paid in Billington And Old Langho by Year
The average sold property price by year was:
| Year | Average Sold Price | Price Change |
Sold Properties
|
|---|---|---|---|
| 2025 | £536,465 | 7% |
16 Properties |
| 2024 | £500,254 | -8% |
21 Properties |
| 2023 | £538,409 | 21% |
11 Properties |
| 2022 | £424,506 | 2% |
20 Properties |
| 2021 | £415,196 | -10% |
35 Properties |
| 2020 | £457,430 | 25% |
15 Properties |
| 2019 | £344,148 | 6% |
32 Properties |
| 2018 | £325,118 | -12% |
22 Properties |
| 2017 | £362,908 | 4% |
23 Properties |
| 2016 | £348,749 | 8% |
30 Properties |
| 2015 | £321,988 | -1% |
20 Properties |
| 2014 | £324,522 | 16% |
25 Properties |
| 2013 | £271,961 | -99% |
26 Properties |
| 2012 | £541,500 | 44% |
14 Properties |
| 2011 | £301,037 | -14% |
12 Properties |
| 2010 | £342,894 | 7% |
19 Properties |
| 2009 | £319,636 | -16% |
11 Properties |
| 2008 | £370,112 | 13% |
24 Properties |
| 2007 | £323,252 | 1% |
52 Properties |
| 2006 | £318,568 | -3% |
58 Properties |
| 2005 | £327,982 | 16% |
28 Properties |
| 2004 | £276,021 | 6% |
79 Properties |
| 2003 | £258,827 | 19% |
85 Properties |
| 2002 | £210,606 | 21% |
70 Properties |
| 2001 | £165,893 | -8% |
57 Properties |
| 2000 | £178,556 | 14% |
34 Properties |
| 1999 | £153,463 | 24% |
50 Properties |
| 1998 | £116,742 | 7% |
32 Properties |
| 1997 | £108,821 | 31% |
25 Properties |
| 1996 | £74,662 | 2% |
5 Properties |
| 1995 | £73,245 | - |
10 Properties |
Property Price per Property Type in Billington And Old Langho
Here you can find historic sold price data in order to help with your property search.
The average Property Paid Price for specific property types in the last three years are:
| Property Type | Average Sold Price | Sold Properties |
|---|---|---|
| Semi Detached House | £415,487.00 | 4 Semi Detached Houses |
| Flat | £239,575.00 | 12 Flats |
| Detached House | £653,112.00 | 31 Detached Houses |
| Terraced House | £227,950.00 | 1 Terraced House |

