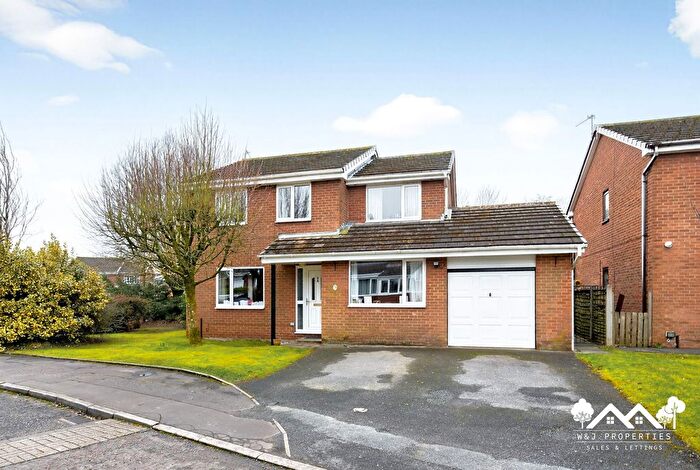
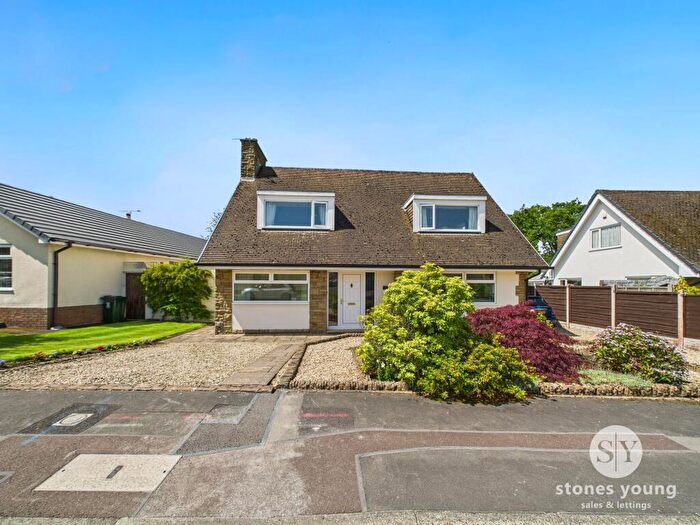
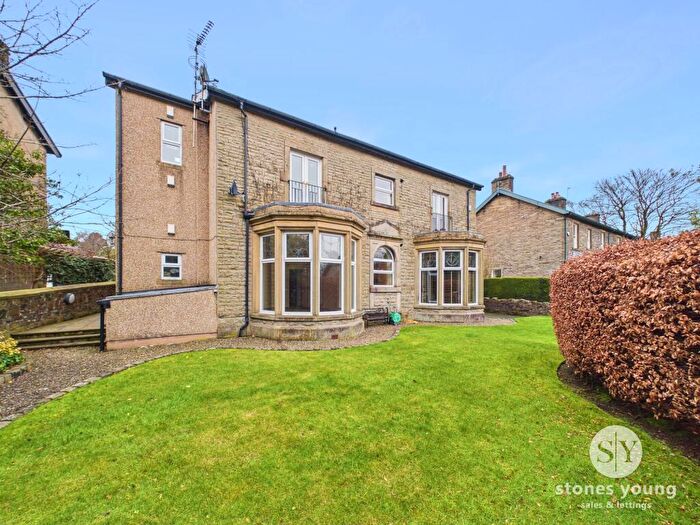
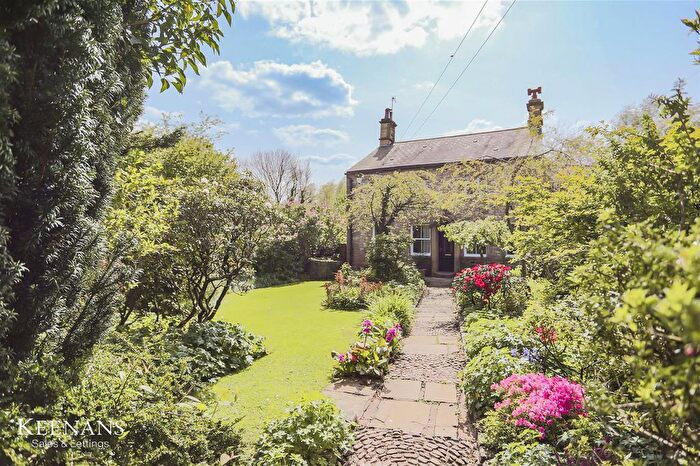
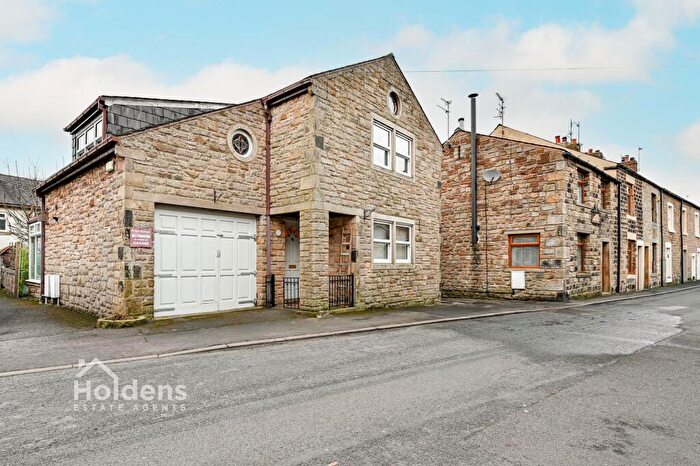
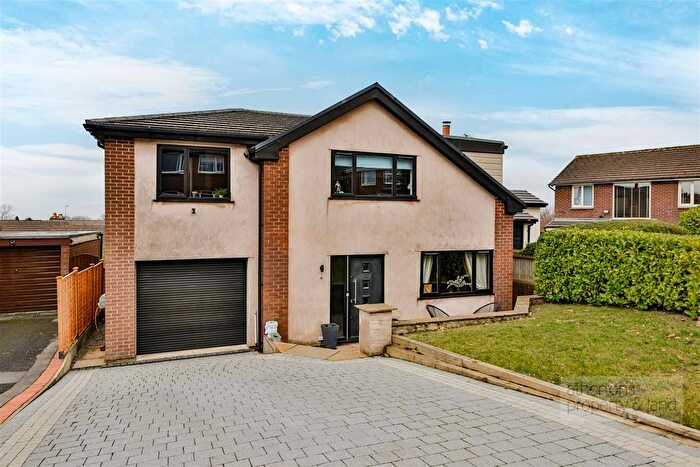
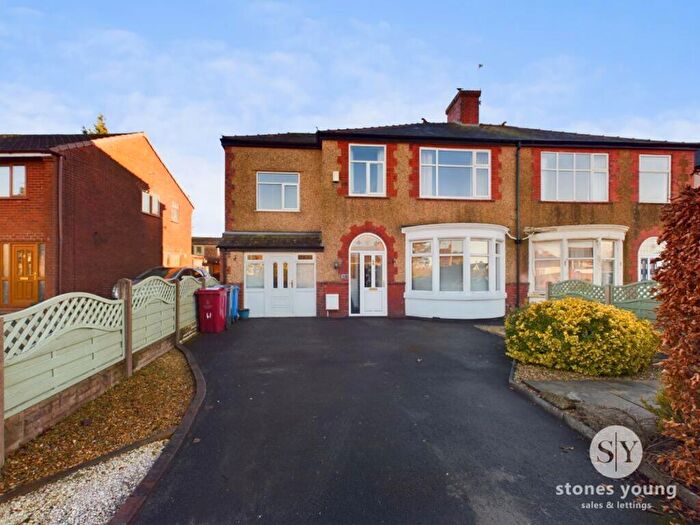
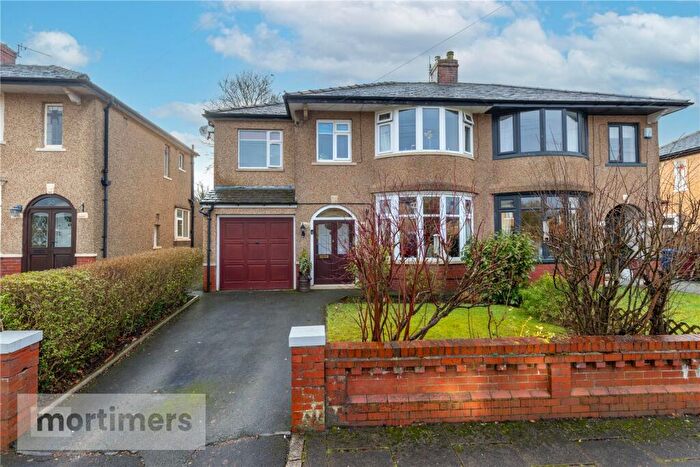
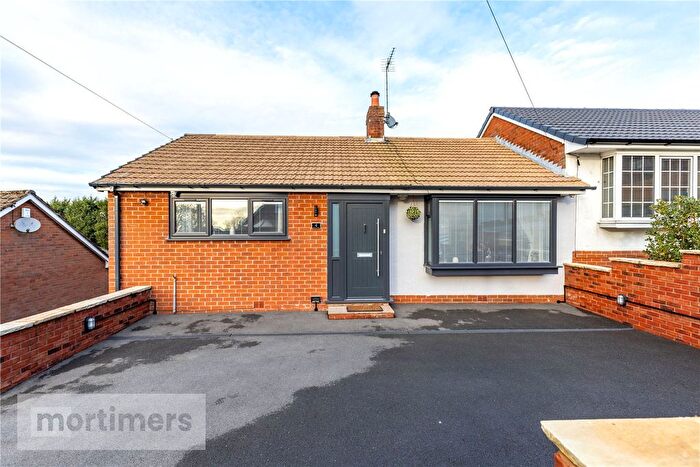
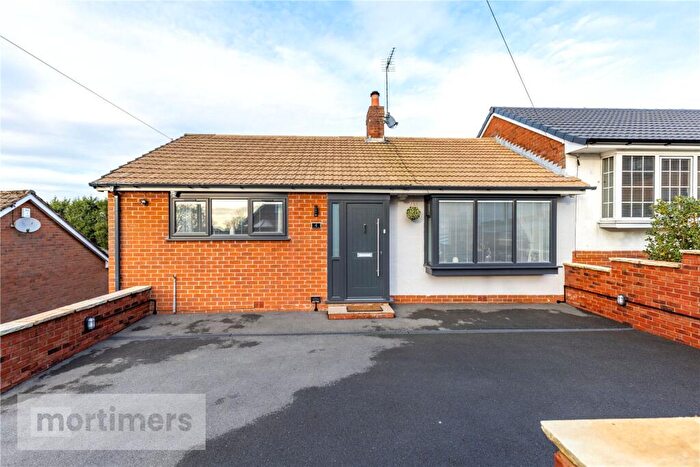
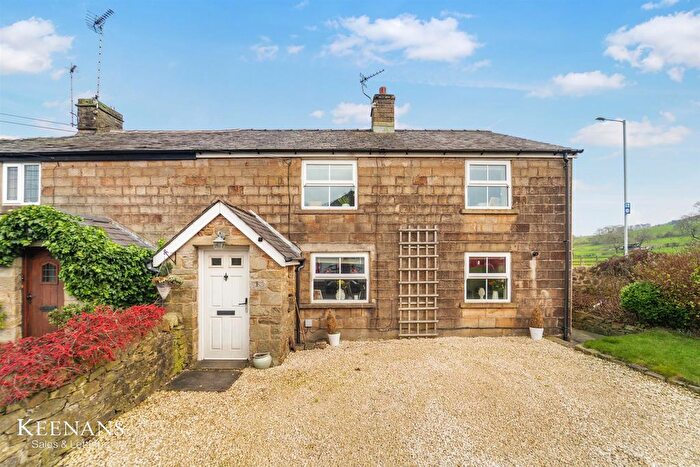
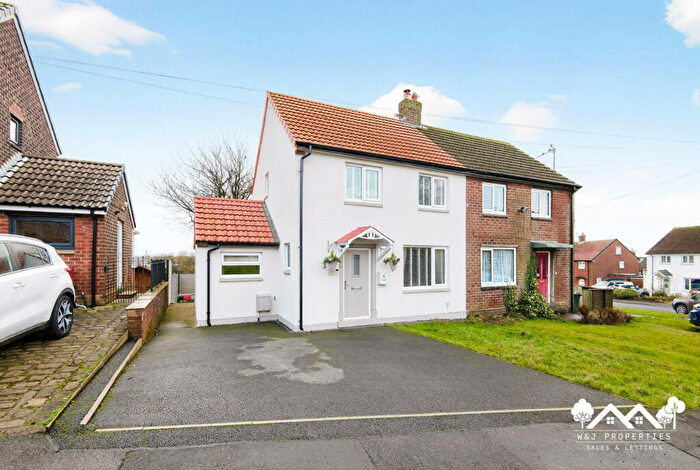
Houses for sale & to rent in Clayton-le-dale With Ramsgreave, Blackburn
House Prices in Clayton-le-dale With Ramsgreave
Properties in Clayton-le-dale With Ramsgreave have an average house price of £302,223.00 and had 107 Property Transactions within the last 3 years¹.
Clayton-le-dale With Ramsgreave is an area in Blackburn, Lancashire with 1,038 households², where the most expensive property was sold for £1,380,000.00.
Properties for sale in Clayton-le-dale With Ramsgreave
Roads and Postcodes in Clayton-le-dale With Ramsgreave
Navigate through our locations to find the location of your next house in Clayton-le-dale With Ramsgreave, Blackburn for sale or to rent.
| Streets | Postcodes |
|---|---|
| Albany Drive | BB1 9EH |
| Barker Lane | BB2 7ED |
| Beech Close | BB1 9JF |
| Church View | BB1 9HL |
| Clayton Grove | BB1 9HJ |
| Copster Green | BB1 9EP BB1 9EW |
| Court Grove | BB1 9HR |
| Flashgate | BB1 9DH |
| Glendene Park | BB1 9JQ |
| Glengreave Avenue | BB1 9BY |
| Greencroft | BB1 9EL |
| Haggs Hall Fields | BB1 9DS |
| Hazel Moor | BB1 9HN |
| Higher Commons Lane | BB2 7LS |
| Higher Ramsgreave Road | BB1 9DJ BB1 9DQ |
| Isle Of Man | BB1 9BW |
| Kay Fold Lodge | BB1 8NG |
| Knowsley Road | BB1 9PX |
| Knowsley Road West | BB1 9PW |
| Longsight Road | BB1 9ES BB1 9EU BB1 9EX BB2 7HX BB2 7JA |
| Lovely Hall Lane | BB1 9EQ |
| Maple Close | BB1 9JG |
| Mayfield Road | BB1 9BT |
| Moorfield Avenue | BB1 9BU BB1 9BX |
| Osbaldeston Lane | BB2 7JB BB2 7LT BB2 7LY BB2 7LZ |
| Paris | BB1 9BJ |
| Parkgate Row | BB1 9ET |
| Parkgate View | BB1 9EN |
| Pleckgate Road | BB1 8QU BB1 8QY |
| Ramsgreave Road | BB1 9BH |
| Ribblesdale Place | BB2 7LX |
| Ribchester Road | BB1 9EE BB1 9EG BB1 9EY BB1 9HQ BB1 9HT BB1 9HU |
| Showley Road | BB1 9DP BB1 9DR |
| St Peters Close | BB1 9HH |
| Waverley Road | BB1 9BN |
| Yew Tree Close | BB1 9HP |
Transport near Clayton-le-dale With Ramsgreave
- FAQ
- Price Paid By Year
- Property Type Price
Frequently asked questions about Clayton-le-dale With Ramsgreave
What is the average price for a property for sale in Clayton-le-dale With Ramsgreave?
The average price for a property for sale in Clayton-le-dale With Ramsgreave is £302,223. This amount is 40% higher than the average price in Blackburn. There are 2,602 property listings for sale in Clayton-le-dale With Ramsgreave.
What streets have the most expensive properties for sale in Clayton-le-dale With Ramsgreave?
The streets with the most expensive properties for sale in Clayton-le-dale With Ramsgreave are Higher Ramsgreave Road at an average of £650,000, Osbaldeston Lane at an average of £491,833 and Glendene Park at an average of £480,000.
What streets have the most affordable properties for sale in Clayton-le-dale With Ramsgreave?
The streets with the most affordable properties for sale in Clayton-le-dale With Ramsgreave are Moorfield Avenue at an average of £147,281, Hazel Moor at an average of £152,500 and Ramsgreave Road at an average of £187,433.
Which train stations are available in or near Clayton-le-dale With Ramsgreave?
Some of the train stations available in or near Clayton-le-dale With Ramsgreave are Ramsgreave and Wilpshire, Langho and Blackburn.
Property Price Paid in Clayton-le-dale With Ramsgreave by Year
The average sold property price by year was:
| Year | Average Sold Price | Price Change |
Sold Properties
|
|---|---|---|---|
| 2025 | £285,131 | -0,4% |
36 Properties |
| 2024 | £286,210 | -18% |
37 Properties |
| 2023 | £337,747 | 8% |
34 Properties |
| 2022 | £309,857 | 9% |
42 Properties |
| 2021 | £280,782 | -2% |
60 Properties |
| 2020 | £287,234 | 8% |
50 Properties |
| 2019 | £263,263 | 17% |
36 Properties |
| 2018 | £217,287 | -10% |
49 Properties |
| 2017 | £238,362 | 4% |
44 Properties |
| 2016 | £229,875 | -1% |
34 Properties |
| 2015 | £231,998 | -18% |
41 Properties |
| 2014 | £274,316 | 23% |
47 Properties |
| 2013 | £212,296 | 12% |
32 Properties |
| 2012 | £187,302 | 1% |
18 Properties |
| 2011 | £186,263 | -29% |
19 Properties |
| 2010 | £240,018 | 20% |
24 Properties |
| 2009 | £191,881 | -22% |
22 Properties |
| 2008 | £234,943 | -12% |
22 Properties |
| 2007 | £262,884 | 16% |
54 Properties |
| 2006 | £221,977 | -6% |
65 Properties |
| 2005 | £235,978 | 0,3% |
48 Properties |
| 2004 | £235,245 | 22% |
41 Properties |
| 2003 | £183,042 | 28% |
53 Properties |
| 2002 | £131,405 | 10% |
67 Properties |
| 2001 | £118,352 | -16% |
54 Properties |
| 2000 | £137,400 | 34% |
62 Properties |
| 1999 | £90,259 | -22% |
33 Properties |
| 1998 | £109,837 | 24% |
41 Properties |
| 1997 | £83,080 | 2% |
46 Properties |
| 1996 | £81,712 | -7% |
50 Properties |
| 1995 | £87,264 | - |
42 Properties |
Property Price per Property Type in Clayton-le-dale With Ramsgreave
Here you can find historic sold price data in order to help with your property search.
The average Property Paid Price for specific property types in the last three years are:
| Property Type | Average Sold Price | Sold Properties |
|---|---|---|
| Semi Detached House | £295,892.00 | 35 Semi Detached Houses |
| Detached House | £429,939.00 | 34 Detached Houses |
| Terraced House | £194,897.00 | 37 Terraced Houses |
| Flat | £152,500.00 | 1 Flat |

