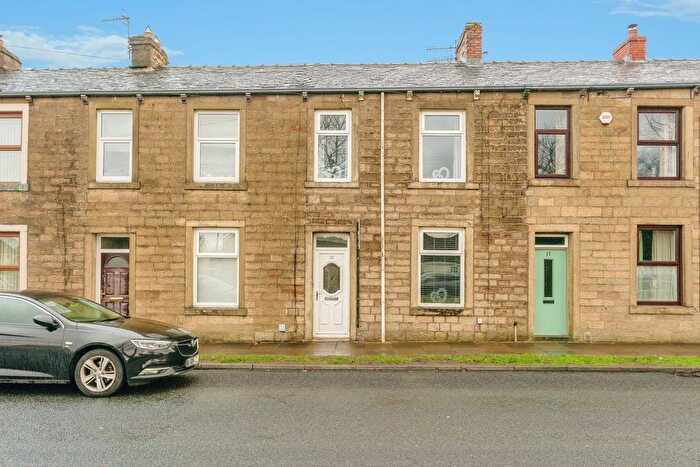
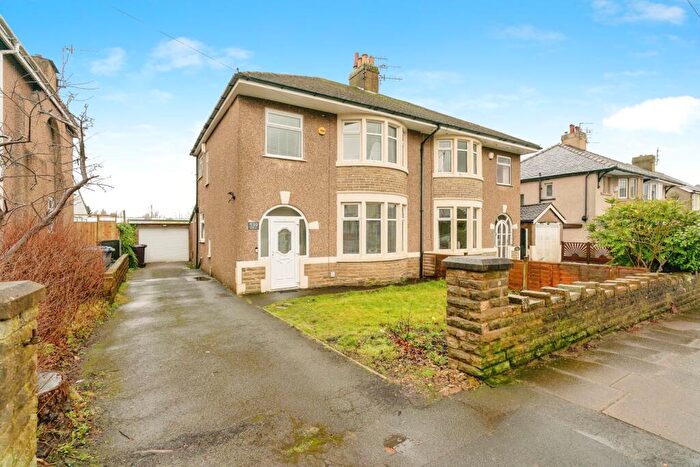
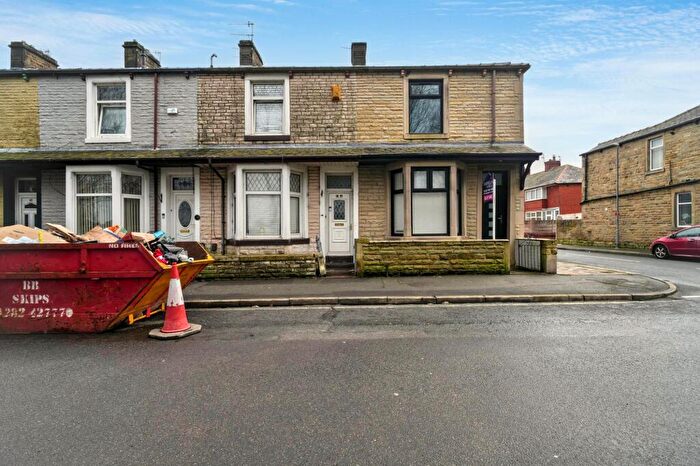
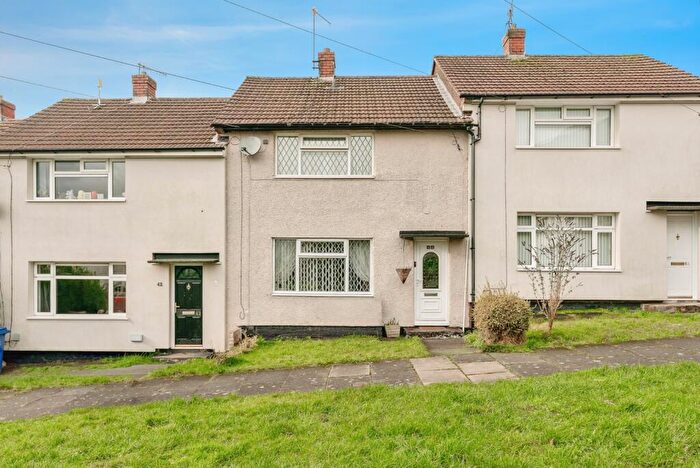
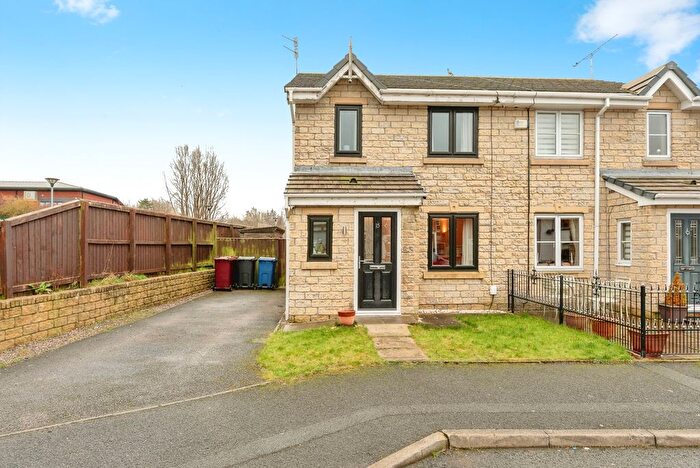
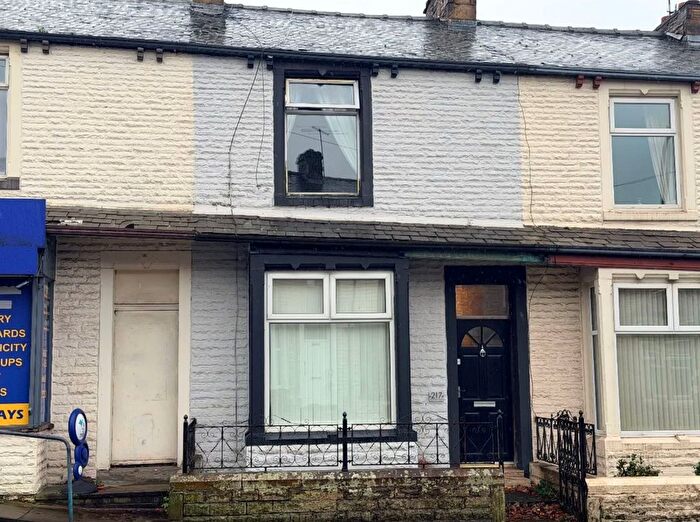
Houses for sale & to rent in Brunshaw, Burnley
House Prices in Brunshaw
Properties in Brunshaw have an average house price of £130,804.00 and had 286 Property Transactions within the last 3 years¹.
Brunshaw is an area in Burnley, Lancashire with 3,043 households², where the most expensive property was sold for £676,500.00.
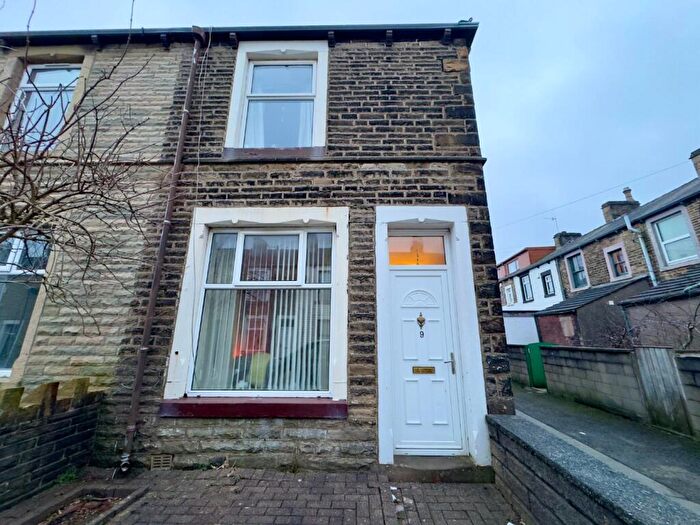
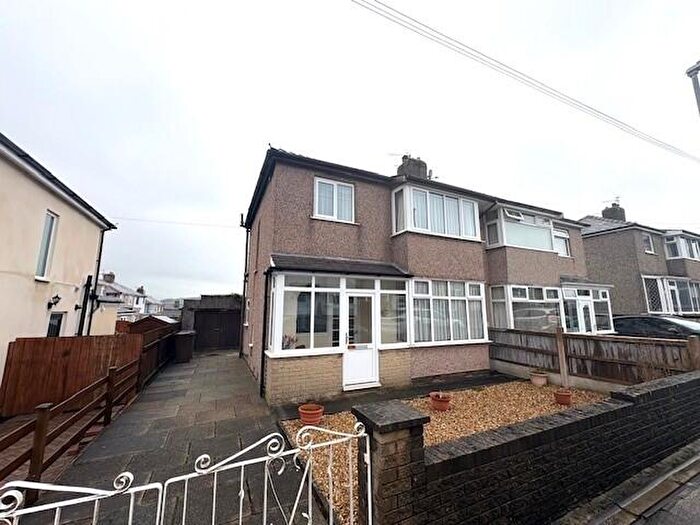
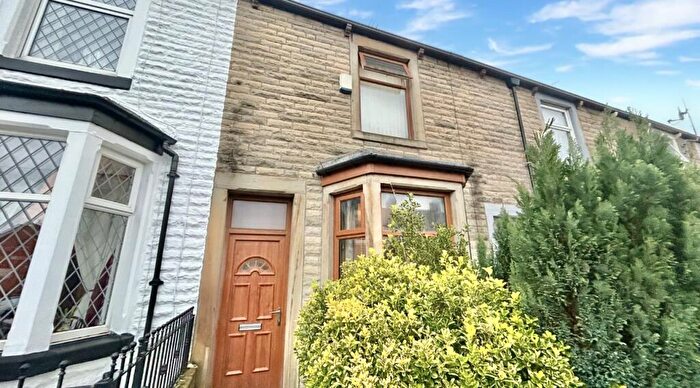
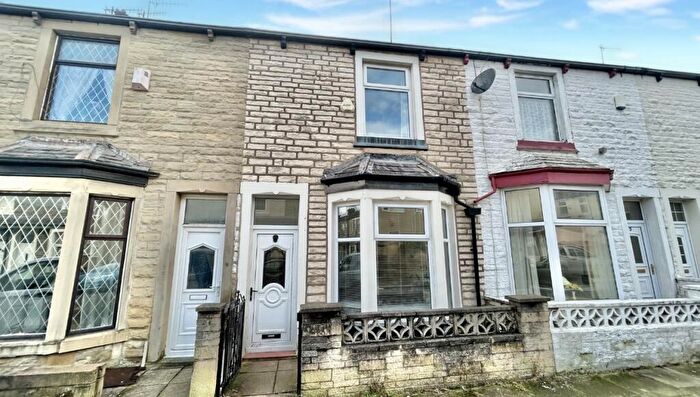
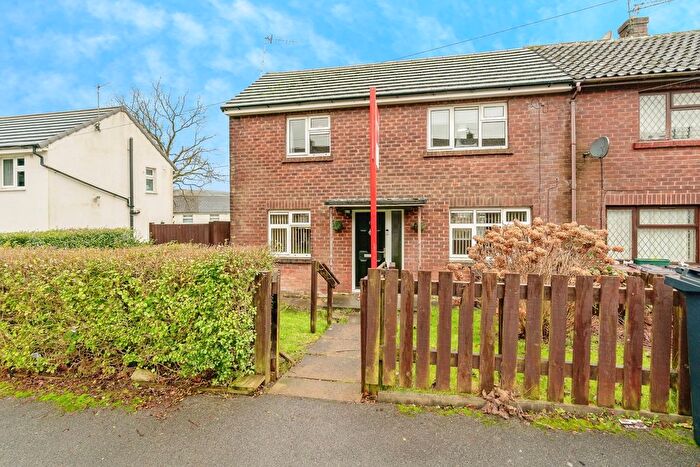
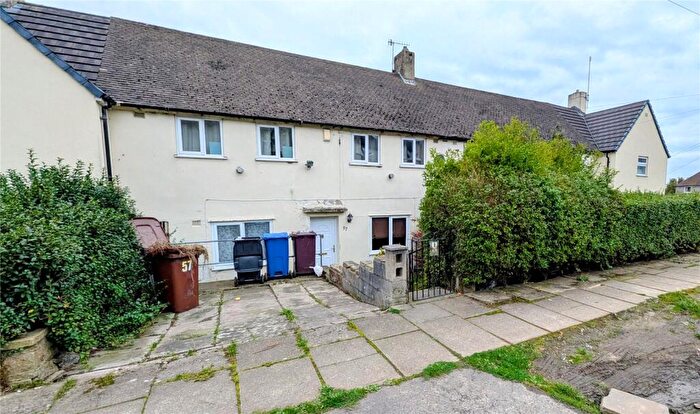
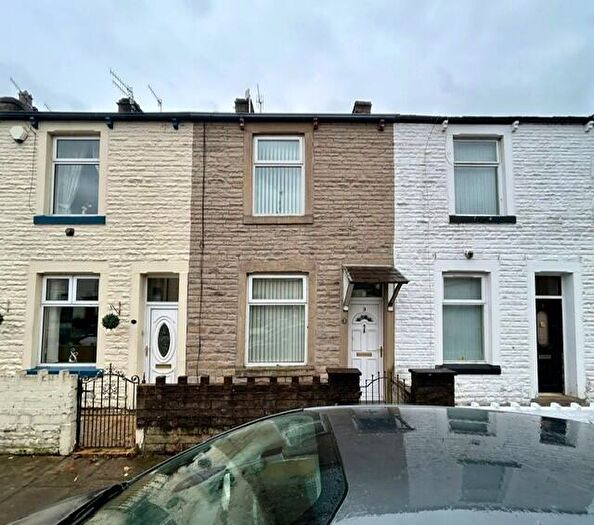
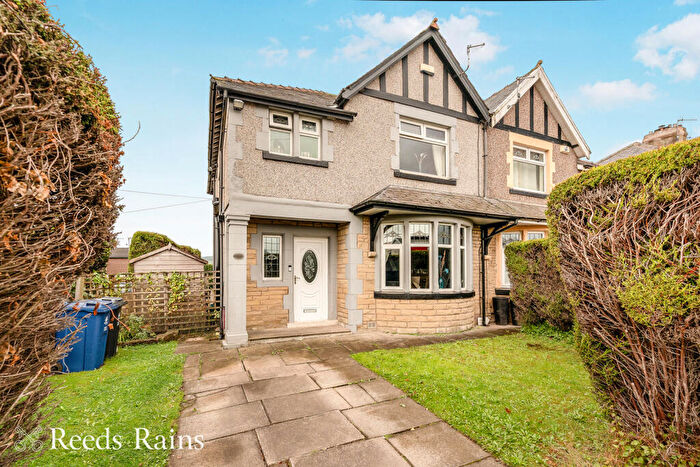
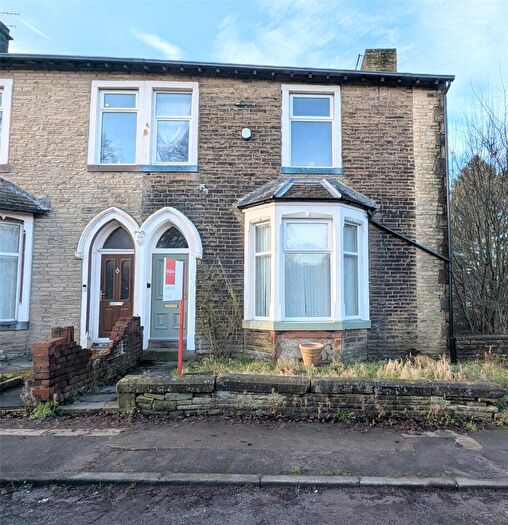
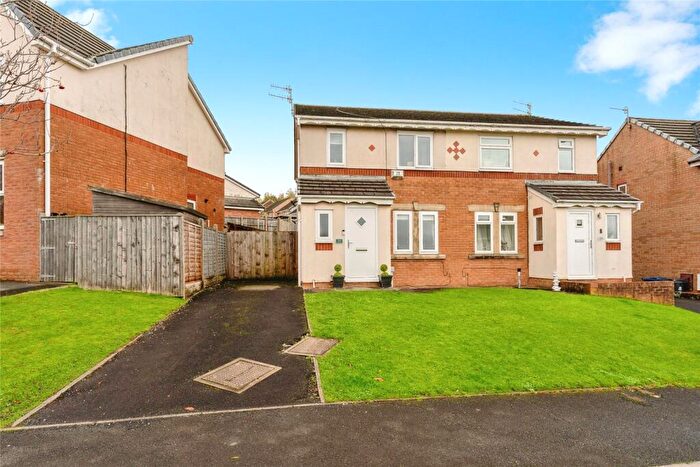
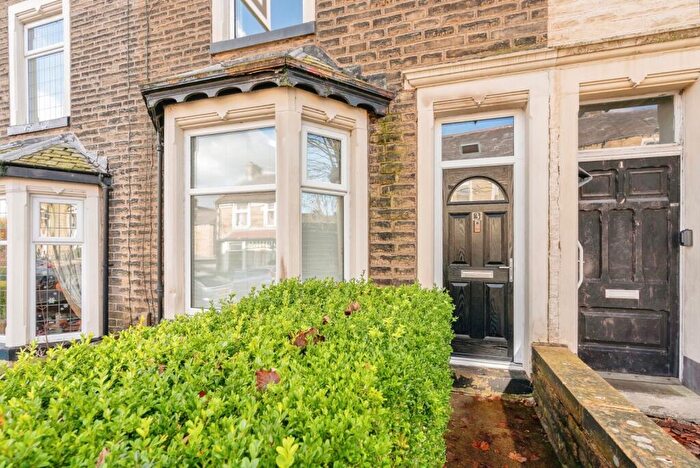
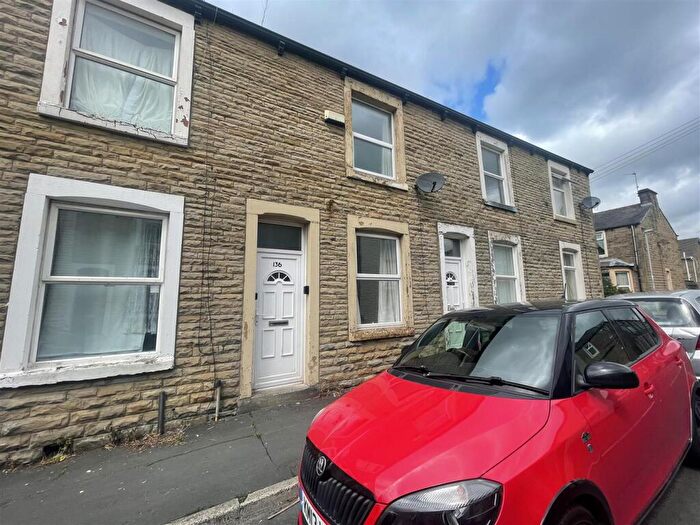
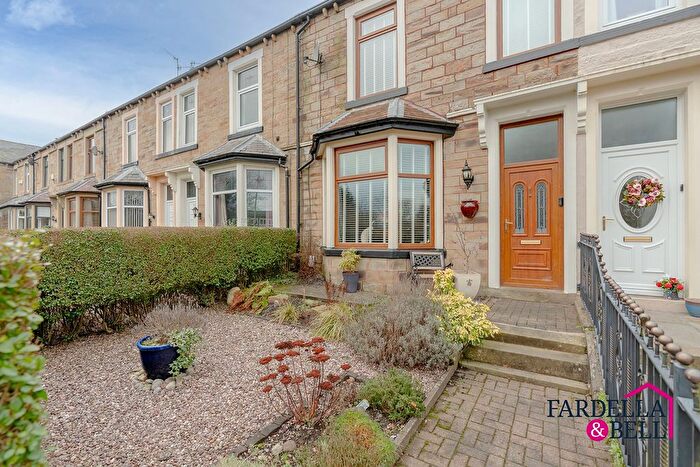
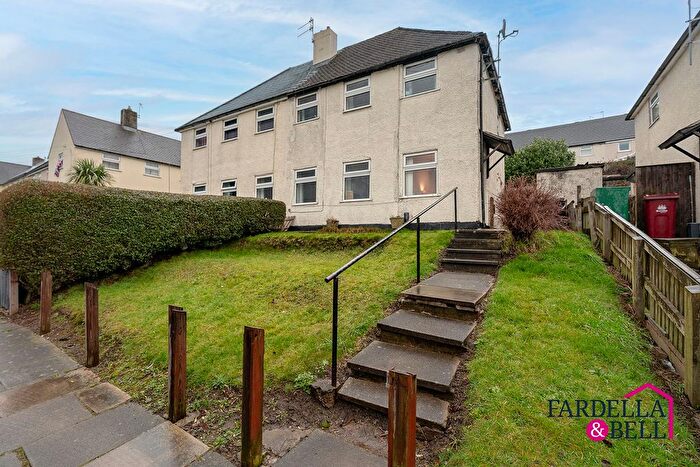
Properties for sale in Brunshaw
Previously listed properties in Brunshaw
Roads and Postcodes in Brunshaw
Navigate through our locations to find the location of your next house in Brunshaw, Burnley for sale or to rent.
| Streets | Postcodes |
|---|---|
| Applecross Drive | BB10 4JP BB10 4JR |
| Athens View | BB10 4LR |
| Athletic Street | BB10 4LP |
| Barley Grove | BB10 4QP |
| Barnes Court | BB10 4PJ |
| Belmont Grove | BB10 4NR |
| Bowland Avenue | BB10 4NG |
| Brandwood Grove | BB10 4QW |
| Brockenhurst Street | BB10 4ES BB10 4ET |
| Bronte Avenue | BB10 3HY |
| Brownhill Avenue | BB10 4QD BB10 4QH BB10 4QJ BB10 4QQ |
| Browsholme Avenue | BB10 4QN BB10 4QL |
| Brunshaw Avenue | BB10 4LD BB10 4LQ BB10 4LT BB10 4NJ BB10 4NQ BB10 4NP |
| Brunshaw Road | BB10 3HU BB10 3HX BB10 3JB BB10 4BY BB10 4DB BB10 4DG BB10 4DL BB10 4DN BB10 4HP BB10 4QR BB10 4DW |
| Carholme Avenue | BB10 4PT BB10 4QA |
| Chatburn Avenue | BB10 4NX |
| Chelburn Grove | BB10 4QE |
| Chiltern Avenue | BB10 4NE |
| Chipping Grove | BB10 4PA |
| Coleshill Avenue | BB10 4LH BB10 4PF |
| Culshaw Street | BB10 4LL BB10 4LN BB10 4PE |
| Darnley Street | BB10 4PG |
| Deerpark Road | BB10 4SD |
| Deerstone Avenue | BB10 4QF BB10 4QG |
| Downham Grove | BB10 4LG |
| Edgworth Grove | BB10 4PY |
| Elliott Street | BB10 4LY |
| Extwistle Square | BB10 3HZ |
| Gisburn Grove | BB10 4NW |
| Grindleton Grove | BB10 4NT |
| Haven Street | BB10 4DQ |
| Hurstwood Avenue | BB10 4JZ |
| Irene Street | BB10 4DJ |
| Lebanon Street | BB10 4DF |
| Longworth Avenue | BB10 4PU |
| Lyndhurst Road | BB10 4DE BB10 4DH BB10 4DR |
| Mary Towneley Fold | BB10 4LU BB10 4LZ |
| Mitella Street | BB10 4DS BB10 4EN BB10 4LW |
| Mitton Grove | BB10 4NY |
| Mizpah Street | BB10 4DD |
| Morse Street | BB10 4LJ BB10 4LS BB10 4PB |
| Olympia Street | BB10 4ER BB10 4EW |
| Otterburn Grove | BB10 4PX |
| Paythorne Avenue | BB10 4NU |
| Pleasington Grove | BB10 4NF |
| Rennie Street | BB10 4PH |
| Ribchester Avenue | BB10 4PD |
| Ridge Avenue | BB10 3JD BB10 3JF BB10 3LD |
| Ridge Court | BB10 3LN |
| Ridge Row | BB10 3JE |
| Rimington Avenue | BB10 4JY BB10 4NN |
| Roughlee Grove | BB10 4LE |
| Sheddon Grove | BB10 4NH |
| Sherwood Court | BB10 4LX |
| Slaidburn Avenue | BB10 4NS BB10 4NZ |
| Springwood Road | BB10 4HR |
| Stoneyhurst Avenue | BB10 4NL |
| Stroyan Street | BB10 4DP |
| Thieveley View | BB10 4AR |
| Turton Grove | BB10 4PZ |
| Waddington Avenue | BB10 4LA BB10 4LB |
| Walsden Grove | BB10 4QB |
| Wycoller Avenue | BB10 4LF |
| BB11 3DF |
Transport near Brunshaw
-
Burnley Central Station
-
Burnley Manchester Road Station
-
Burnley Barracks Station
-
Rose Grove Station
-
Brierfield Station
- FAQ
- Price Paid By Year
- Property Type Price
Frequently asked questions about Brunshaw
What is the average price for a property for sale in Brunshaw?
The average price for a property for sale in Brunshaw is £130,804. This amount is 3% lower than the average price in Burnley. There are 584 property listings for sale in Brunshaw.
What streets have the most expensive properties for sale in Brunshaw?
The streets with the most expensive properties for sale in Brunshaw are Applecross Drive at an average of £379,375, Springwood Road at an average of £309,660 and Deerpark Road at an average of £272,000.
What streets have the most affordable properties for sale in Brunshaw?
The streets with the most affordable properties for sale in Brunshaw are Lebanon Street at an average of £62,083, Chatburn Avenue at an average of £65,500 and Deerstone Avenue at an average of £70,625.
Which train stations are available in or near Brunshaw?
Some of the train stations available in or near Brunshaw are Burnley Central, Burnley Manchester Road and Burnley Barracks.
Property Price Paid in Brunshaw by Year
The average sold property price by year was:
| Year | Average Sold Price | Price Change |
Sold Properties
|
|---|---|---|---|
| 2025 | £129,377 | 2% |
70 Properties |
| 2024 | £126,157 | -8% |
105 Properties |
| 2023 | £136,100 | 14% |
111 Properties |
| 2022 | £117,689 | 2% |
117 Properties |
| 2021 | £115,403 | 10% |
161 Properties |
| 2020 | £104,115 | 7% |
64 Properties |
| 2019 | £96,394 | -2% |
93 Properties |
| 2018 | £97,953 | 11% |
86 Properties |
| 2017 | £86,849 | -7% |
134 Properties |
| 2016 | £93,075 | 8% |
71 Properties |
| 2015 | £85,250 | -5% |
72 Properties |
| 2014 | £89,255 | 4% |
72 Properties |
| 2013 | £85,692 | 5% |
72 Properties |
| 2012 | £81,224 | 15% |
41 Properties |
| 2011 | £69,183 | -36% |
61 Properties |
| 2010 | £93,792 | 10% |
45 Properties |
| 2009 | £84,611 | -6% |
60 Properties |
| 2008 | £90,052 | -11% |
67 Properties |
| 2007 | £99,908 | 7% |
147 Properties |
| 2006 | £92,693 | 17% |
198 Properties |
| 2005 | £76,978 | 3% |
179 Properties |
| 2004 | £75,044 | 10% |
161 Properties |
| 2003 | £67,594 | 18% |
200 Properties |
| 2002 | £55,670 | 25% |
173 Properties |
| 2001 | £41,833 | 9% |
102 Properties |
| 2000 | £38,037 | 9% |
109 Properties |
| 1999 | £34,746 | -16% |
116 Properties |
| 1998 | £40,406 | 10% |
90 Properties |
| 1997 | £36,510 | 11% |
76 Properties |
| 1996 | £32,498 | -18% |
68 Properties |
| 1995 | £38,440 | - |
82 Properties |
Property Price per Property Type in Brunshaw
Here you can find historic sold price data in order to help with your property search.
The average Property Paid Price for specific property types in the last three years are:
| Property Type | Average Sold Price | Sold Properties |
|---|---|---|
| Semi Detached House | £147,926.00 | 76 Semi Detached Houses |
| Detached House | £319,115.00 | 26 Detached Houses |
| Terraced House | £97,121.00 | 180 Terraced Houses |
| Flat | £97,237.00 | 4 Flats |

