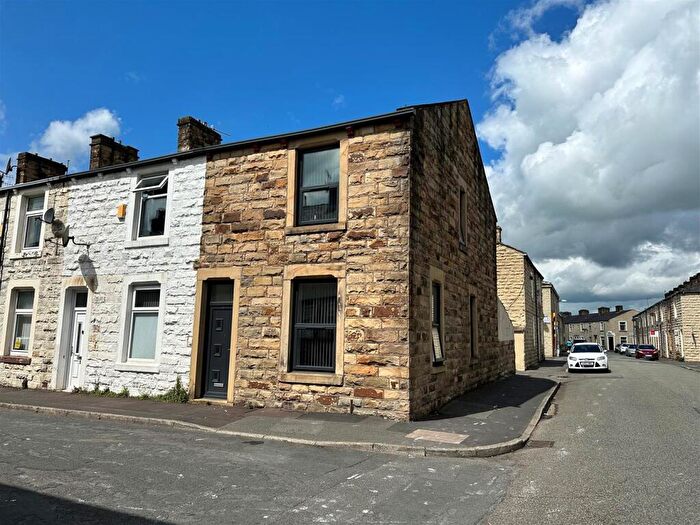
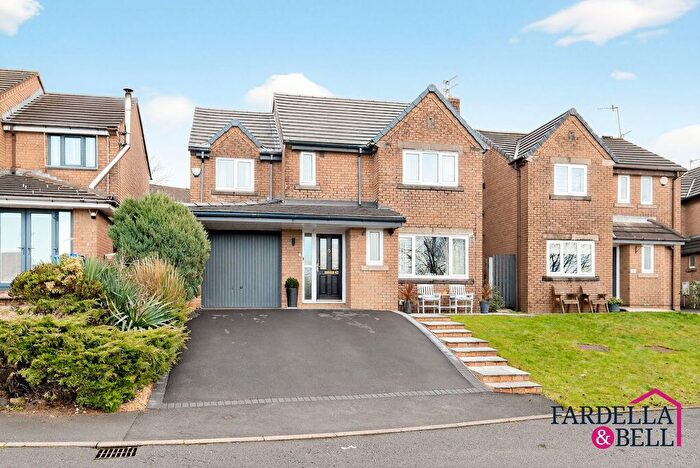
Houses for sale & to rent in Lanehead, Burnley
House Prices in Lanehead
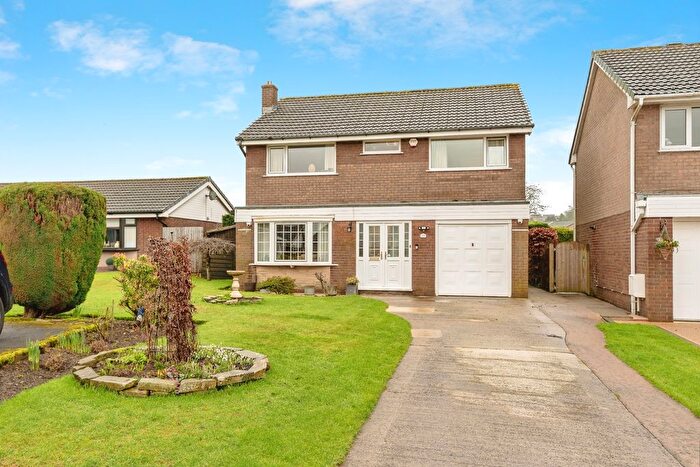
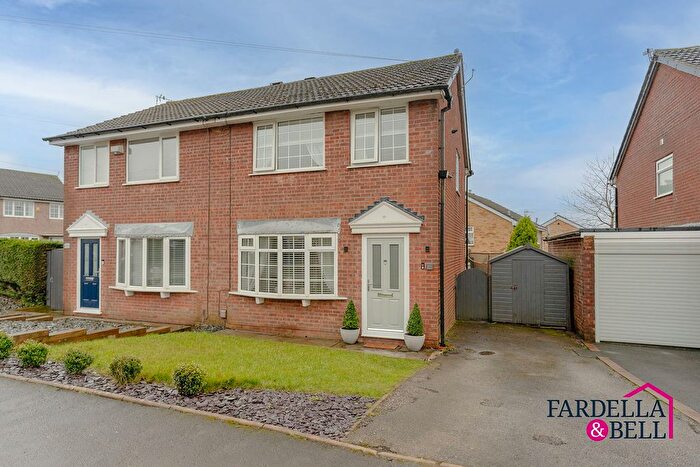
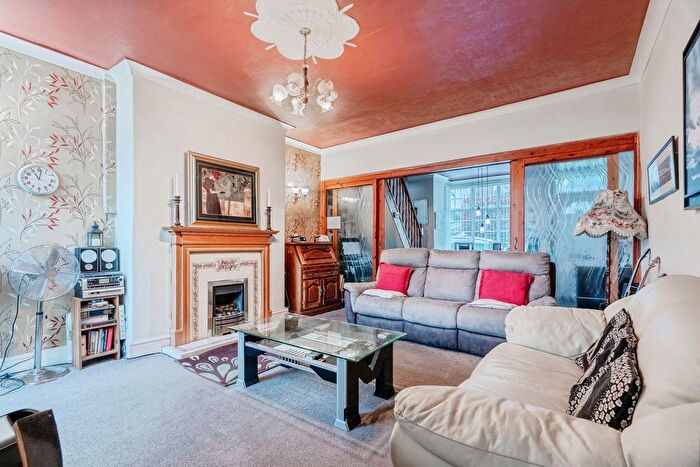
Properties in Lanehead have an average house price of £139,006.00 and had 248 Property Transactions within the last 3 years¹.
Lanehead is an area in Burnley, Lancashire with 2,399 households², where the most expensive property was sold for £440,000.00.
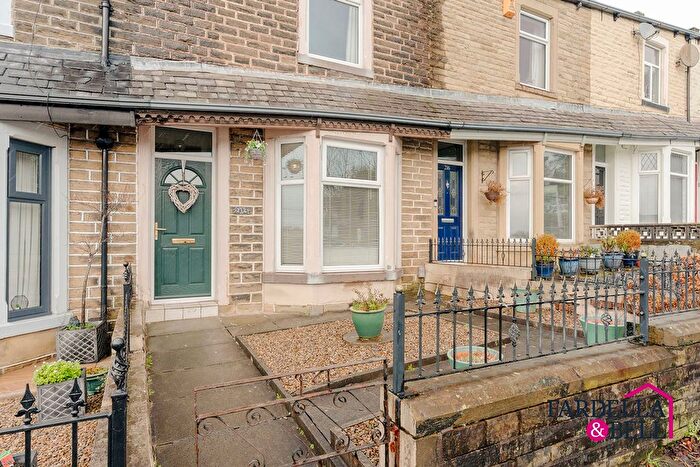
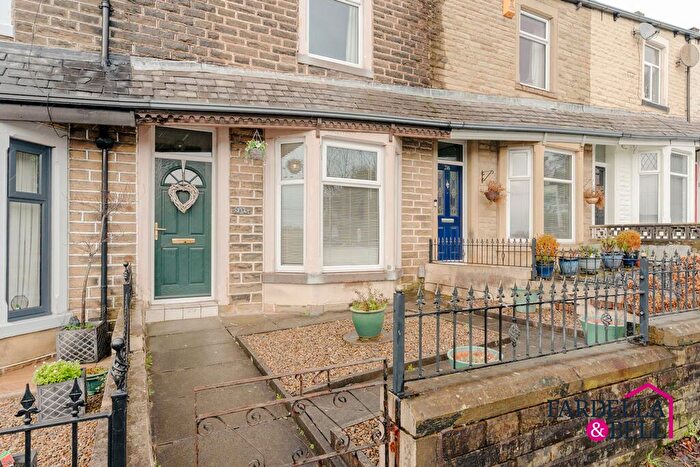
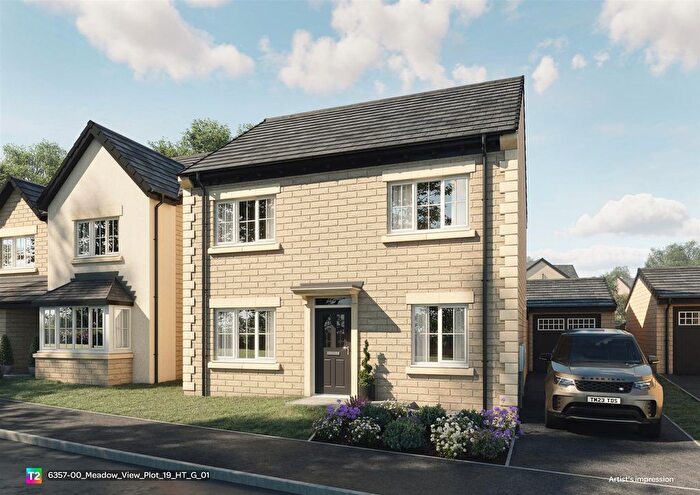
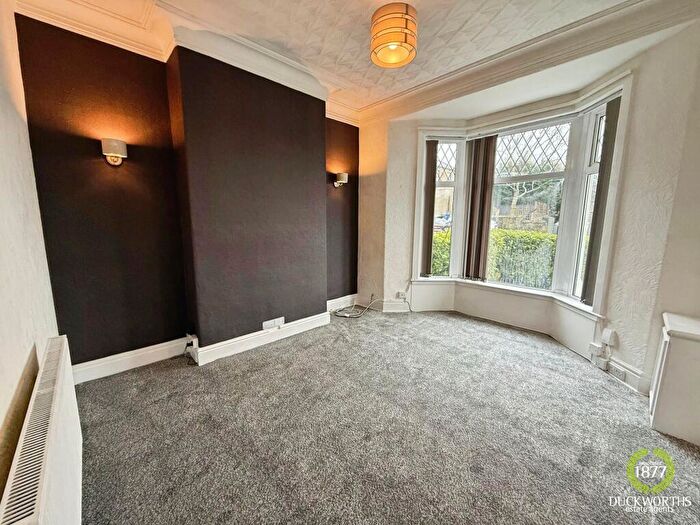
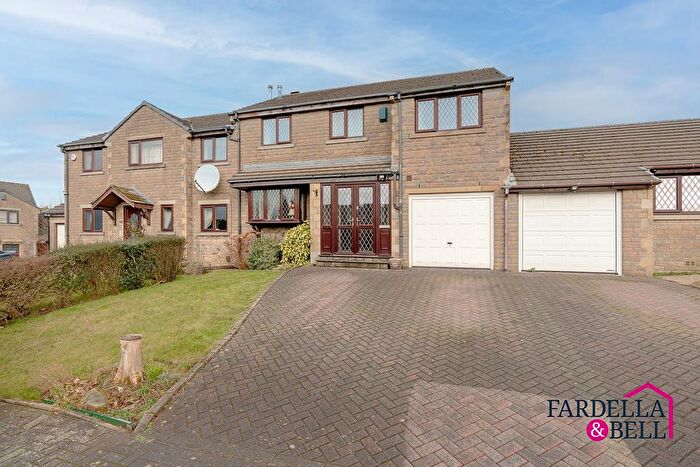
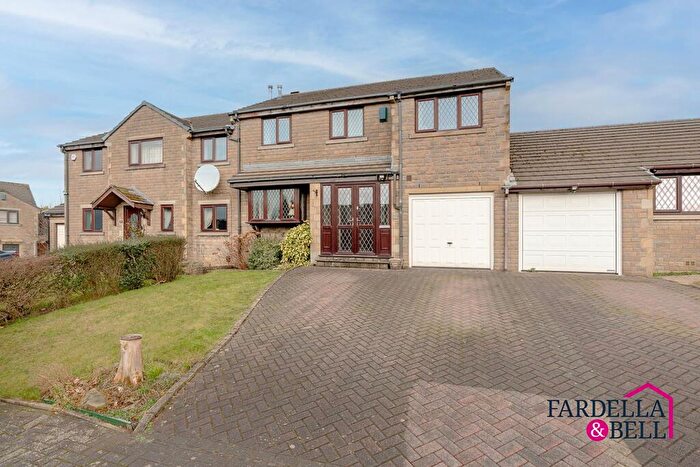
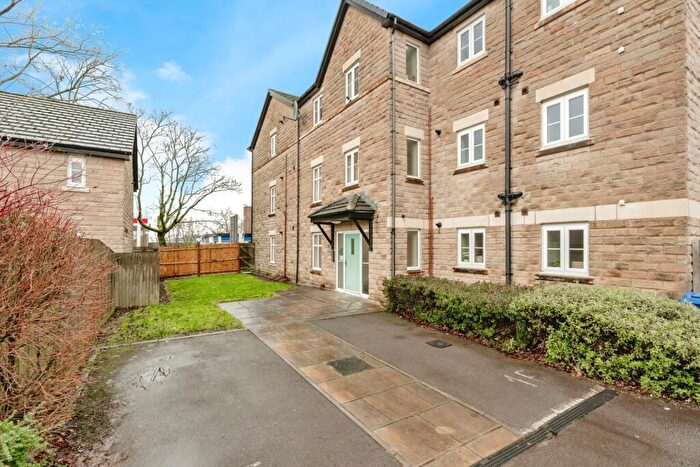
Properties for sale in Lanehead
Roads and Postcodes in Lanehead
Navigate through our locations to find the location of your next house in Lanehead, Burnley for sale or to rent.
| Streets | Postcodes |
|---|---|
| Abinger Street | BB10 3EA BB10 3EE BB10 3ED BB10 3FH |
| Amersham Grove | BB10 2RP |
| Antley Court | BB10 3EJ |
| Aylesbury Walk | BB10 2RQ |
| Bancroft Road | BB10 2RZ BB10 2TP BB10 2TQ |
| Basnett Street | BB10 3EQ BB10 3ES BB10 3ET |
| Beckenham Court | BB10 2RJ |
| Borrowdale Close | BB10 2QN |
| Brent Street | BB10 2QE |
| Briercliffe Road | BB10 1TX BB10 1TY BB10 1UR BB10 2DH BB10 2DQ BB10 2NL BB10 2NZ |
| Brighton Road | BB10 2BP |
| Carlyle Street | BB10 2BN |
| Casterton Avenue | BB10 2PB BB10 2PF BB10 2PW |
| Chessington Green | BB10 2RL |
| Chingford Bank | BB10 2RN |
| Chislehurst Grove | BB10 2RR |
| Claret Close | BB10 3FN |
| Cleaver Street | BB10 3DN |
| Colne Road | BB10 2LB |
| Conway Grove | BB10 2QA |
| Cromer Avenue | BB10 3HA |
| Cromer Grove | BB10 3HB |
| Deepdale Drive | BB10 2SD |
| Delph Square | BB10 2DF |
| Eastern Avenue | BB10 2AU BB10 2NN BB10 2AP BB10 2AR BB10 2AS BB10 2AT |
| Eldwick Street | BB10 3DU BB10 3DZ |
| Elim View | BB10 2DG |
| Ennismore Street | BB10 3DL BB10 3EU |
| Fairfield Drive | BB10 2PU |
| Fell View | BB10 2SF |
| Ferndale Street | BB10 3EP |
| Fleetwood Road | BB10 3HD |
| Harrogate Crescent | BB10 2NX |
| Haydock Street | BB10 3HN |
| Highfield Avenue | BB10 2PR BB10 2PS |
| Hodder Street | BB10 2QD |
| Honister Road | BB10 2PX |
| Humber Square | BB10 2QQ |
| Islington Close | BB10 2SN |
| Jib Hill Cottages | BB10 2DB |
| Kibble Crescent | BB10 2BW |
| Kingsbury Place | BB10 2RH |
| Kingsdale Avenue | BB10 2PY |
| Leamington Avenue | BB10 3EY BB10 3HH |
| Lytham Road | BB10 2NY |
| Marsden Court | BB10 2SS |
| Marsden Road | BB10 2BJ BB10 2BL BB10 2BT BB10 2DE BB10 2QP BB10 2QW BB10 2BZ |
| Matlock Grove | BB10 3HJ |
| Melville Street | BB10 3DY BB10 3EL BB10 3EN BB10 3EW BB10 3DX |
| Millbank Crescent | BB10 2BF |
| Minehead Avenue | BB10 2NP |
| Netherwood Road | BB10 2AH BB10 2AN BB10 2EJ |
| Newground Court | BB10 2BS |
| Oakwood Close | BB10 2DY |
| Orpington Square | BB10 2RF |
| Primrose Street | BB10 3HL |
| Queen Victoria Road | BB10 3DW |
| Ramsey Grove | BB10 2NR |
| Reedley Drive | BB10 2QR |
| Ribble Avenue | BB10 2QB BB10 2QF |
| Rochester Drive | BB10 2BH |
| Salus Street | BB10 3EH BB10 3EZ BB10 3HW |
| Sandford Court | BB10 2BG |
| Sedburgh Street | BB10 2QG |
| Shannon Square | BB10 2QH |
| Silverdale Close | BB10 2PT |
| St Georges Square | BB10 3FG |
| Sunningdale Gardens | BB10 2RW |
| Swanage Road | BB10 3EB |
| Thames Avenue | BB10 2PZ |
| Thornber Court | BB10 3AW |
| Thursby Road | BB10 3EG BB10 3EX |
| Torquay Avenue | BB10 2NW |
| Underley Street | BB10 2BX |
| West Street | BB10 3ER |
| Widow Hill Road | BB10 2BQ |
| Wilton Street | BB10 3HR |
| Yewlands Drive | BB10 2QJ |
| BB10 2DD BB10 2SB |
Transport near Lanehead
-
Brierfield Station
-
Burnley Central Station
-
Burnley Barracks Station
-
Nelson Station
-
Burnley Manchester Road Station
-
Rose Grove Station
- FAQ
- Price Paid By Year
- Property Type Price
Frequently asked questions about Lanehead
What is the average price for a property for sale in Lanehead?
The average price for a property for sale in Lanehead is £139,006. This amount is 3% higher than the average price in Burnley. There are 1,031 property listings for sale in Lanehead.
What streets have the most expensive properties for sale in Lanehead?
The streets with the most expensive properties for sale in Lanehead are Deepdale Drive at an average of £302,500, Rochester Drive at an average of £296,000 and Fairfield Drive at an average of £284,437.
What streets have the most affordable properties for sale in Lanehead?
The streets with the most affordable properties for sale in Lanehead are Haydock Street at an average of £54,725, Eldwick Street at an average of £58,874 and Cleaver Street at an average of £68,535.
Which train stations are available in or near Lanehead?
Some of the train stations available in or near Lanehead are Brierfield, Burnley Central and Burnley Barracks.
Property Price Paid in Lanehead by Year
The average sold property price by year was:
| Year | Average Sold Price | Price Change |
Sold Properties
|
|---|---|---|---|
| 2025 | £140,569 | 1% |
79 Properties |
| 2024 | £138,486 | 0,3% |
74 Properties |
| 2023 | £138,111 | 8% |
95 Properties |
| 2022 | £126,537 | 1% |
115 Properties |
| 2021 | £125,343 | 13% |
121 Properties |
| 2020 | £109,261 | 5% |
75 Properties |
| 2019 | £103,450 | -9% |
90 Properties |
| 2018 | £112,381 | 9% |
89 Properties |
| 2017 | £101,718 | 4% |
95 Properties |
| 2016 | £97,330 | 2% |
92 Properties |
| 2015 | £95,314 | -14% |
99 Properties |
| 2014 | £108,887 | 15% |
130 Properties |
| 2013 | £92,278 | 4% |
64 Properties |
| 2012 | £88,780 | 2% |
50 Properties |
| 2011 | £87,370 | -18% |
48 Properties |
| 2010 | £103,510 | 13% |
56 Properties |
| 2009 | £90,329 | -25% |
42 Properties |
| 2008 | £112,642 | 7% |
51 Properties |
| 2007 | £105,196 | 7% |
150 Properties |
| 2006 | £97,338 | 15% |
186 Properties |
| 2005 | £82,619 | 1% |
163 Properties |
| 2004 | £81,619 | 21% |
134 Properties |
| 2003 | £64,755 | 22% |
137 Properties |
| 2002 | £50,764 | 14% |
134 Properties |
| 2001 | £43,626 | -12% |
109 Properties |
| 2000 | £49,005 | 10% |
97 Properties |
| 1999 | £43,894 | -10% |
92 Properties |
| 1998 | £48,079 | -7% |
107 Properties |
| 1997 | £51,285 | 21% |
90 Properties |
| 1996 | £40,392 | 2% |
49 Properties |
| 1995 | £39,640 | - |
81 Properties |
Property Price per Property Type in Lanehead
Here you can find historic sold price data in order to help with your property search.
The average Property Paid Price for specific property types in the last three years are:
| Property Type | Average Sold Price | Sold Properties |
|---|---|---|
| Semi Detached House | £157,400.00 | 75 Semi Detached Houses |
| Detached House | £255,396.00 | 39 Detached Houses |
| Terraced House | £92,347.00 | 130 Terraced Houses |
| Flat | £175,737.00 | 4 Flats |

