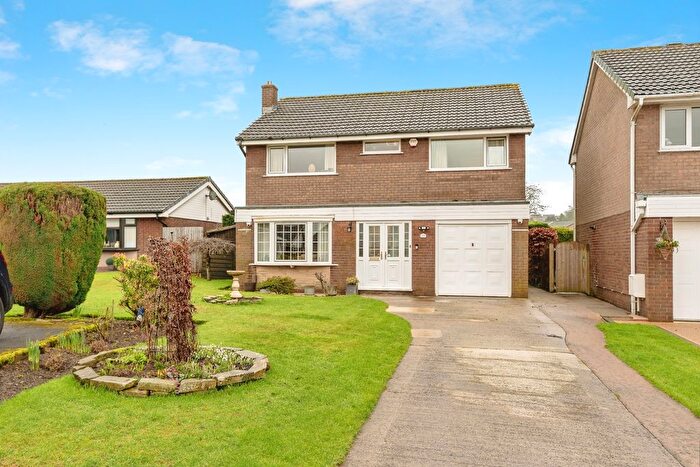
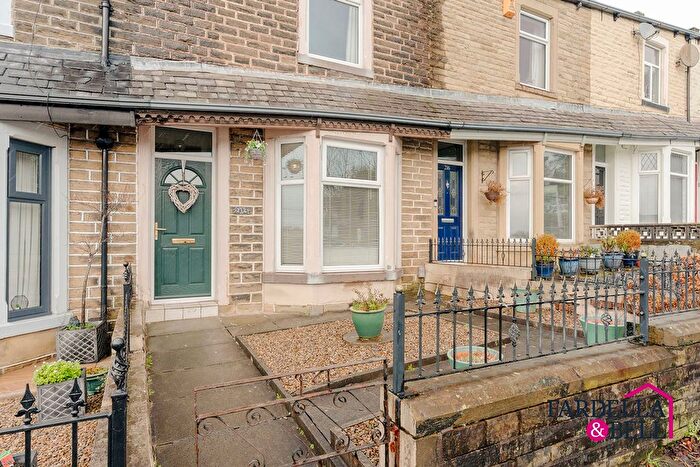
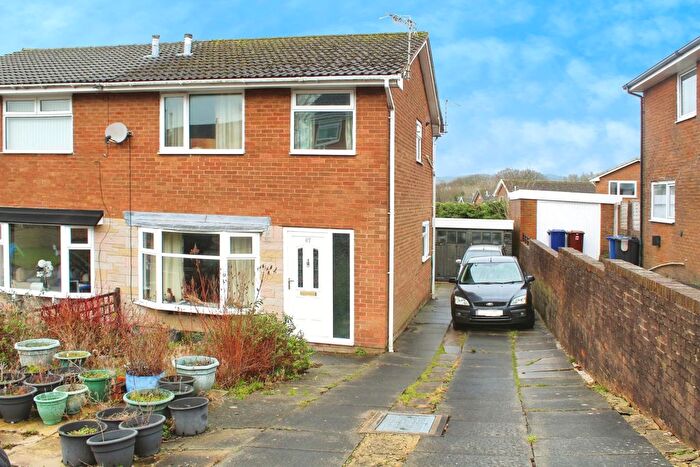
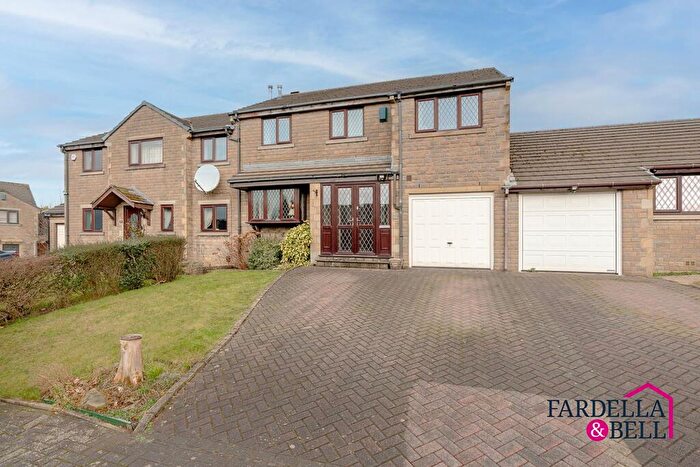
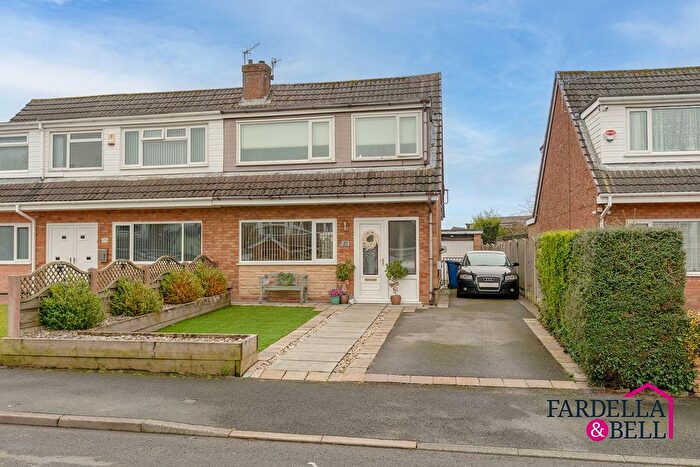
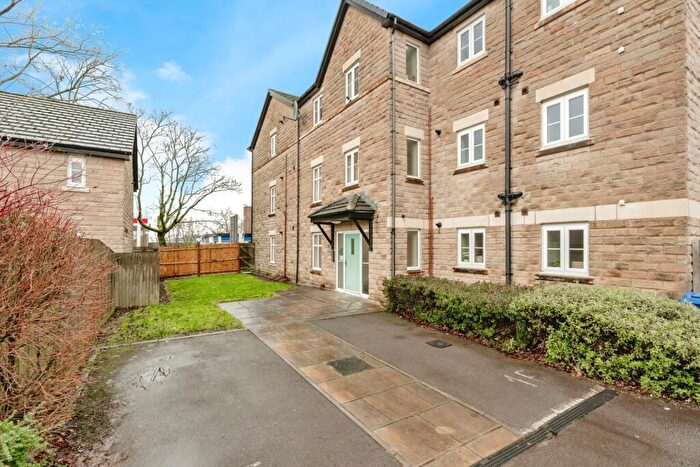
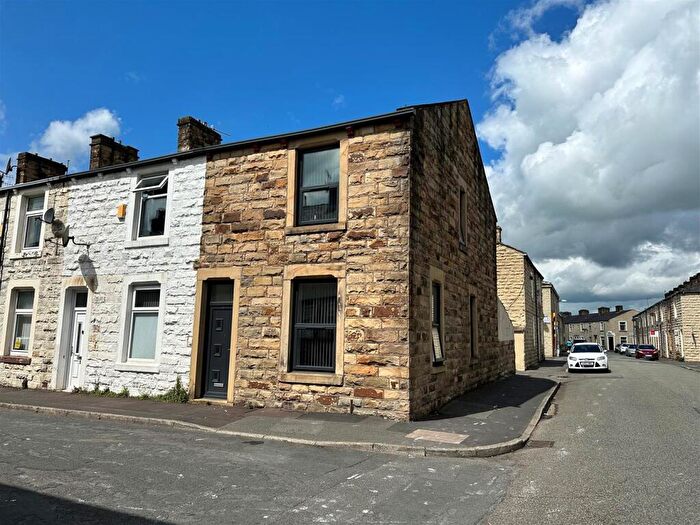
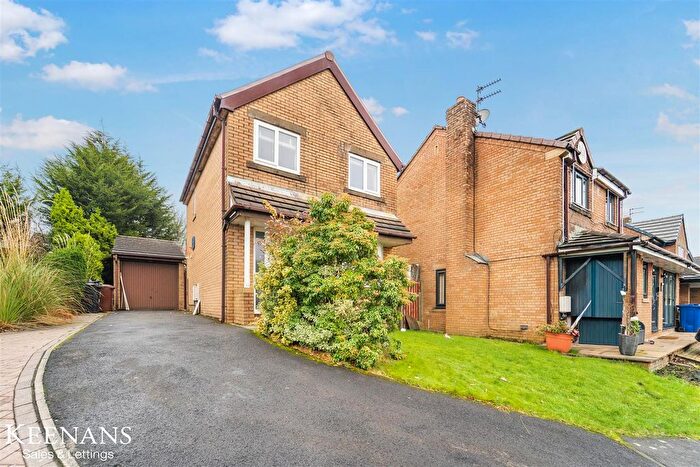
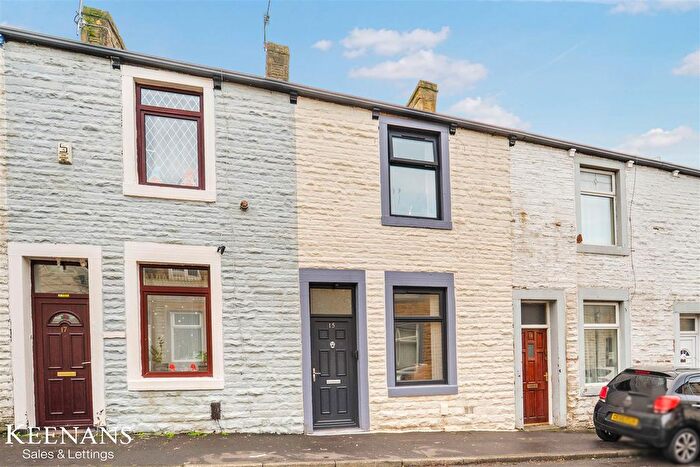
Houses for sale & to rent in Queensgate, Burnley
House Prices in Queensgate
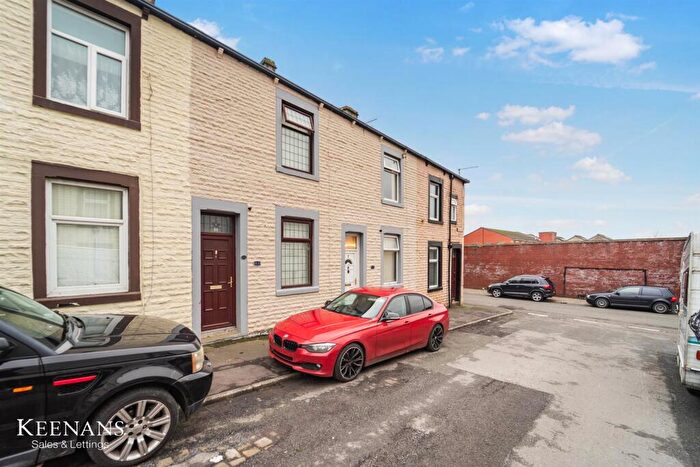
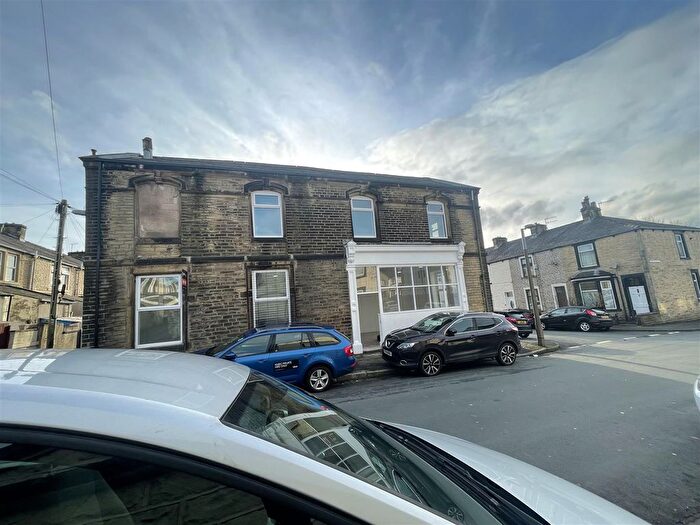
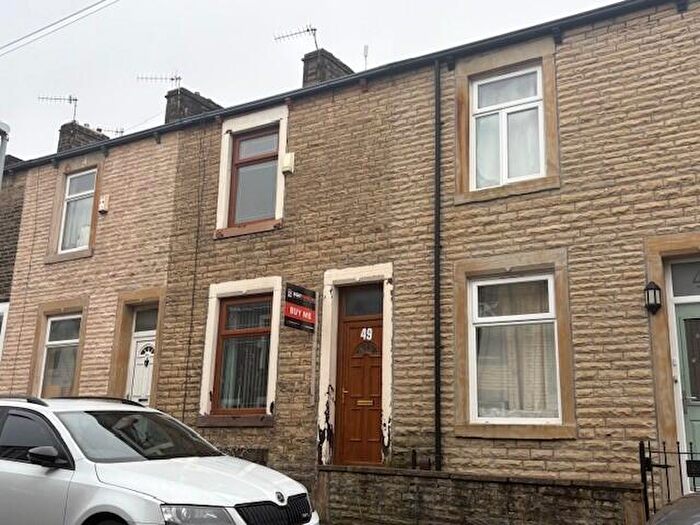
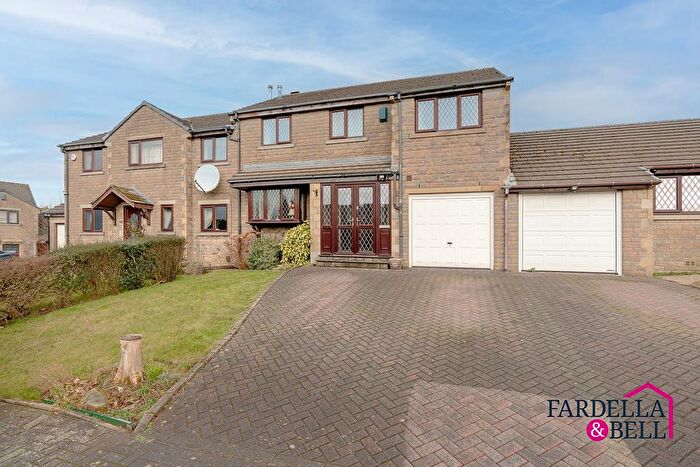
Properties in Queensgate have an average house price of £96,660.00 and had 318 Property Transactions within the last 3 years¹.
Queensgate is an area in Burnley, Lancashire with 2,405 households², where the most expensive property was sold for £450,000.00.
Properties for sale in Queensgate
Roads and Postcodes in Queensgate
Navigate through our locations to find the location of your next house in Queensgate, Burnley for sale or to rent.
| Streets | Postcodes |
|---|---|
| Ada Street | BB10 1RS |
| Barbon Street | BB10 1TS |
| Barden Lane | BB10 1HY BB10 1JA BB10 1JD BB10 1JF BB12 0DY BB12 0DQ BB12 0DX |
| Barden View | BB10 2AY |
| Bentham Avenue | BB10 1XZ |
| Blacker Street | BB10 2AF |
| Boundary Street | BB10 1UA |
| Bracewell Street | BB10 1SS BB10 1TB BB10 1UN |
| Brennand Street | BB10 1SQ BB10 1SU |
| Briercliffe Road | BB10 1TU BB10 1TZ BB10 1UX BB10 1XB BB10 1US BB10 1XQ |
| Briercliffe Shopping Centre | BB10 1WB |
| Bright Street | BB10 1RR BB10 1RX BB10 1JG |
| Bulcock Street | BB10 1UB BB10 1UH |
| Cardinal Street | BB10 1RU BB10 1RY |
| Casterton Avenue | BB10 2PA BB10 2PD BB10 2PE BB10 2PH BB10 2PQ |
| Colne Road | BB10 1DY BB10 1DZ BB10 1ED BB10 1EF BB10 1EJ BB10 1EL BB10 1EW BB10 1TP BB10 1TW BB10 1XU BB10 1EA BB10 1EH BB10 1EZ BB10 1HH |
| Darwin Street | BB10 1HX |
| Derwent Avenue | BB10 1HZ |
| Disraeli Street | BB10 1HR |
| Ebor Street | BB10 1ER |
| Edmund Street | BB10 1XG |
| Fifth Avenue | BB10 1YA |
| Ford Street | BB10 1RJ |
| Fraser Street | BB10 1UL BB10 1UP BB10 1XJ |
| Furness Street | BB10 1TE |
| Garswood Close | BB12 0EE |
| Godiva Street | BB10 1JE |
| Grasmere Street | BB10 1HP |
| Green Street | BB10 1SZ BB10 1UZ |
| Hallows Street | BB10 2AG |
| Haslam Court | BB10 1JR |
| Haulgh Street | BB10 1EG |
| Hawes Terrace | BB10 1UF |
| Healdwood Close | BB12 0EG |
| Heap Street | BB10 1RL |
| Highfield Avenue | BB10 1YB |
| Hind Street | BB10 1EQ |
| Holmby Street | BB10 1SF |
| Ivan Street | BB10 1ES |
| Ivy Street | BB10 1TA BB10 1TD |
| Keswick Road | BB10 1HW |
| Killington Street | BB10 1TT |
| Kyan Street | BB10 1HJ BB10 1HL |
| Latham Street | BB10 1XF |
| Laurier Road | BB10 1XY |
| Lindale Crescent | BB10 1EX |
| Lower Manor Lane | BB12 0EB BB12 0EF |
| Lower Mead Drive | BB12 0ED |
| Mansergh Street | BB10 1TR |
| Marina View | BB12 0DT |
| Mark Street | BB10 1SY |
| Martin Street | BB10 1SH |
| Murray Street | BB10 1SB |
| Newman Street | BB10 1RW |
| Paulhan Street | BB10 1ET |
| Peart Street | BB10 1EP |
| Pembroke Street | BB10 1SN |
| Prairie Crescent | BB10 1EU |
| Pratt Street | BB10 1RZ BB10 1SG |
| Queens Road | BB10 1XX |
| Randall Street | BB10 1SR |
| Rawson Street | BB10 1SJ |
| Redvers Street | BB10 1RT |
| Renshaw Street | BB10 1SX |
| Rushworth Street | BB10 1XD |
| Ruskin Street | BB10 1HT |
| Rydal Street | BB10 1HS |
| Rylands Street | BB10 1RG |
| Settle Terrace | BB10 1UE |
| Shap Grove | BB10 1EY |
| Sharp Street | BB10 1SL BB10 1SP |
| Shuttleworth Street | BB10 1EN |
| St Andrews Street | BB10 1RH |
| St Cuthbert Street | BB10 1UD |
| Steer Street | BB10 1TF |
| Thirlmere Avenue | BB10 1HU |
| Towneley Street | BB10 1UJ |
| Walpole Street | BB10 1SW |
| Waterbarn Street | BB10 1RN BB10 1RP BB10 1SD |
| Windermere Avenue | BB10 2AA BB10 2AB BB10 2AE BB10 2FU |
| Wynotham Street | BB10 1UQ |
Transport near Queensgate
-
Burnley Central Station
-
Brierfield Station
-
Burnley Barracks Station
-
Burnley Manchester Road Station
-
Nelson Station
-
Rose Grove Station
- FAQ
- Price Paid By Year
- Property Type Price
Frequently asked questions about Queensgate
What is the average price for a property for sale in Queensgate?
The average price for a property for sale in Queensgate is £96,660. This amount is 28% lower than the average price in Burnley. There are 974 property listings for sale in Queensgate.
What streets have the most expensive properties for sale in Queensgate?
The streets with the most expensive properties for sale in Queensgate are Highfield Avenue at an average of £233,500, Laurier Road at an average of £223,666 and Fifth Avenue at an average of £200,000.
What streets have the most affordable properties for sale in Queensgate?
The streets with the most affordable properties for sale in Queensgate are Rylands Street at an average of £42,498, Heap Street at an average of £46,305 and Ford Street at an average of £46,374.
Which train stations are available in or near Queensgate?
Some of the train stations available in or near Queensgate are Burnley Central, Brierfield and Burnley Barracks.
Property Price Paid in Queensgate by Year
The average sold property price by year was:
| Year | Average Sold Price | Price Change |
Sold Properties
|
|---|---|---|---|
| 2025 | £109,526 | 14% |
93 Properties |
| 2024 | £94,501 | 6% |
102 Properties |
| 2023 | £88,723 | 2% |
123 Properties |
| 2022 | £86,913 | 18% |
152 Properties |
| 2021 | £71,662 | -0,2% |
137 Properties |
| 2020 | £71,790 | 10% |
146 Properties |
| 2019 | £64,841 | 4% |
115 Properties |
| 2018 | £62,150 | -2% |
144 Properties |
| 2017 | £63,216 | 7% |
140 Properties |
| 2016 | £59,000 | 15% |
162 Properties |
| 2015 | £50,198 | -13% |
127 Properties |
| 2014 | £56,649 | 11% |
139 Properties |
| 2013 | £50,448 | -16% |
68 Properties |
| 2012 | £58,674 | 3% |
69 Properties |
| 2011 | £57,014 | -26% |
68 Properties |
| 2010 | £72,097 | 8% |
65 Properties |
| 2009 | £66,532 | -24% |
69 Properties |
| 2008 | £82,553 | 13% |
99 Properties |
| 2007 | £71,462 | 8% |
276 Properties |
| 2006 | £66,096 | 12% |
299 Properties |
| 2005 | £58,442 | 31% |
273 Properties |
| 2004 | £40,244 | 20% |
301 Properties |
| 2003 | £32,325 | 18% |
258 Properties |
| 2002 | £26,481 | -9% |
211 Properties |
| 2001 | £28,796 | -7% |
208 Properties |
| 2000 | £30,852 | -4% |
154 Properties |
| 1999 | £32,111 | 5% |
118 Properties |
| 1998 | £30,387 | -5% |
129 Properties |
| 1997 | £31,879 | 3% |
111 Properties |
| 1996 | £30,974 | 8% |
93 Properties |
| 1995 | £28,608 | - |
131 Properties |
Property Price per Property Type in Queensgate
Here you can find historic sold price data in order to help with your property search.
The average Property Paid Price for specific property types in the last three years are:
| Property Type | Average Sold Price | Sold Properties |
|---|---|---|
| Semi Detached House | £167,400.00 | 54 Semi Detached Houses |
| Detached House | £238,635.00 | 14 Detached Houses |
| Terraced House | £73,498.00 | 249 Terraced Houses |
| Flat | £56,500.00 | 1 Flat |

