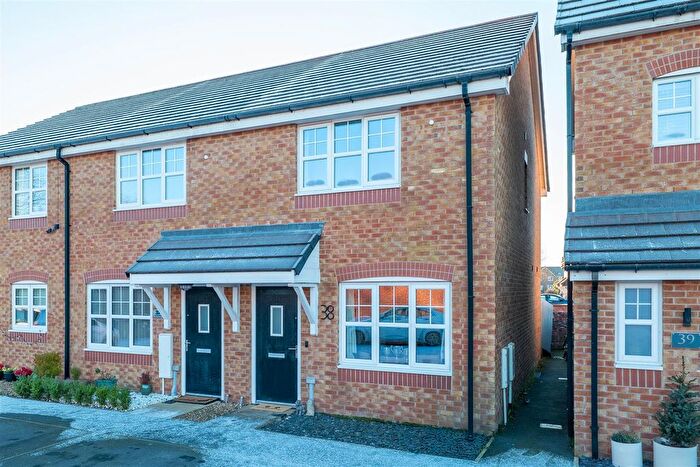
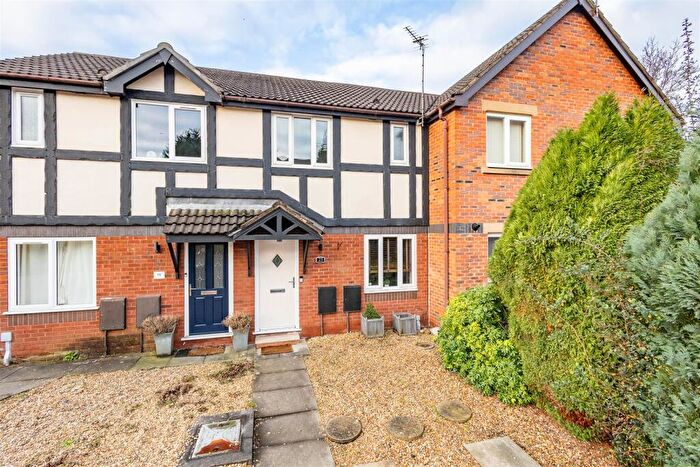
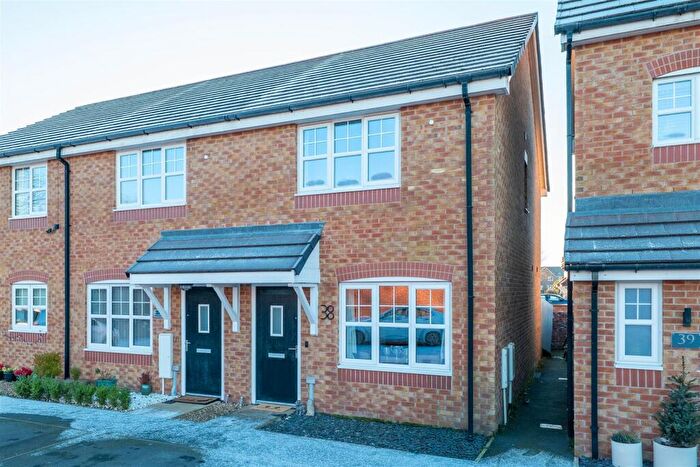
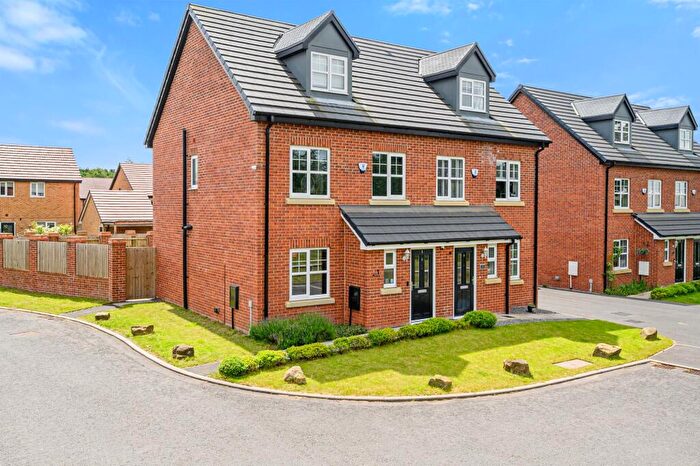
Houses for sale & to rent in Farington East, Leyland
House Prices in Farington East
Properties in Farington East have an average house price of £197,690.00 and had 234 Property Transactions within the last 3 years¹.
Farington East is an area in Leyland, Lancashire with 1,192 households², where the most expensive property was sold for £825,000.00.
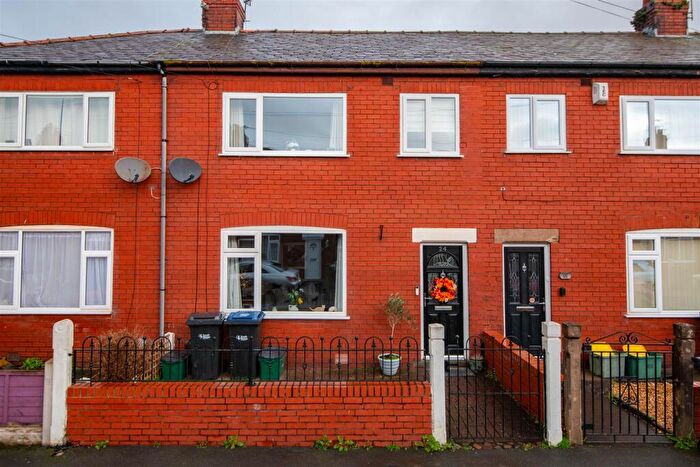
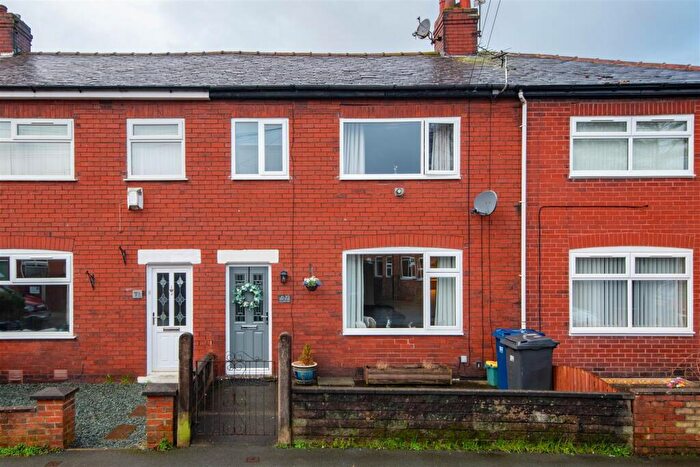
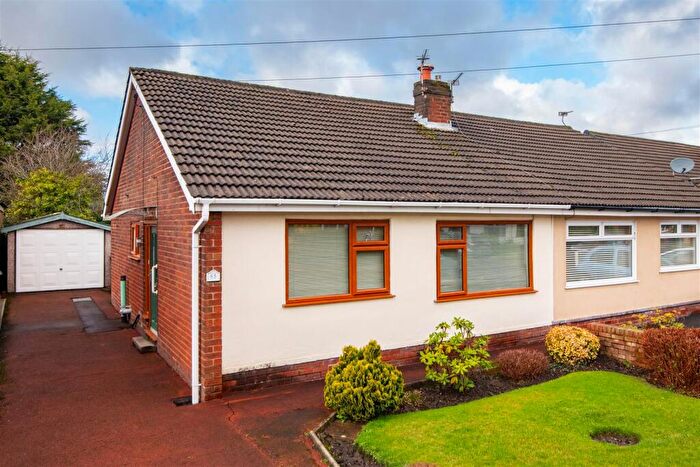
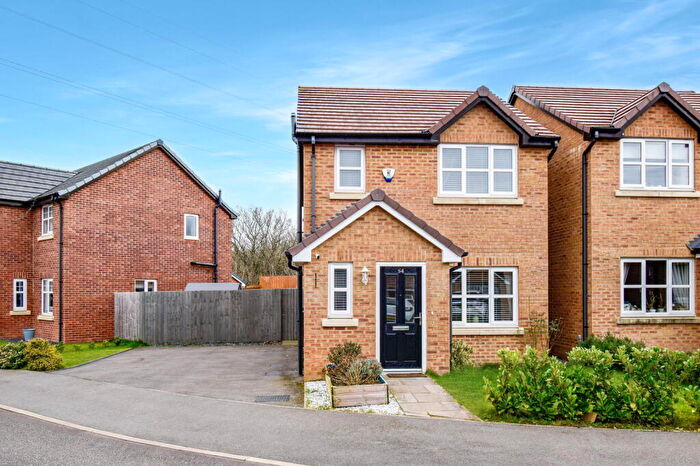
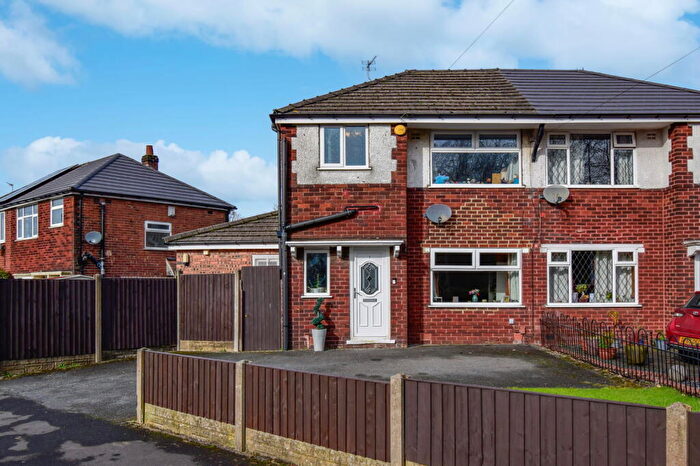
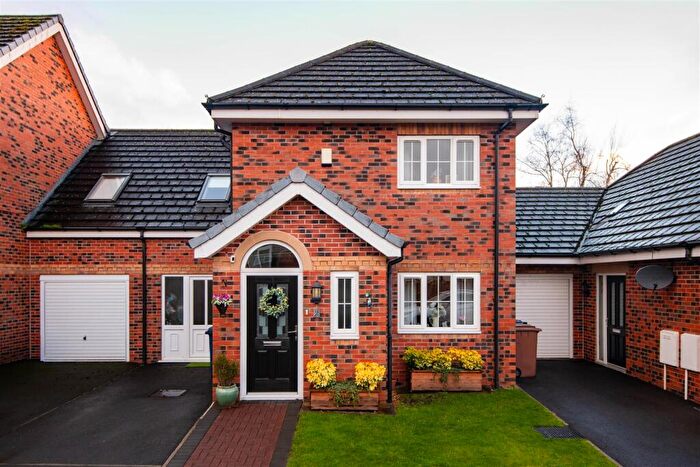
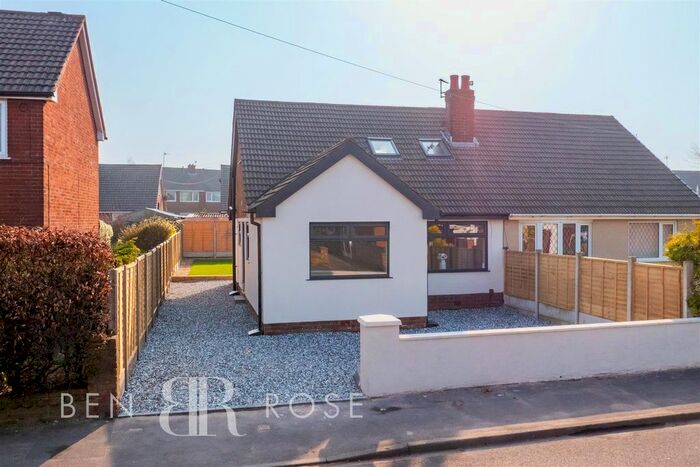
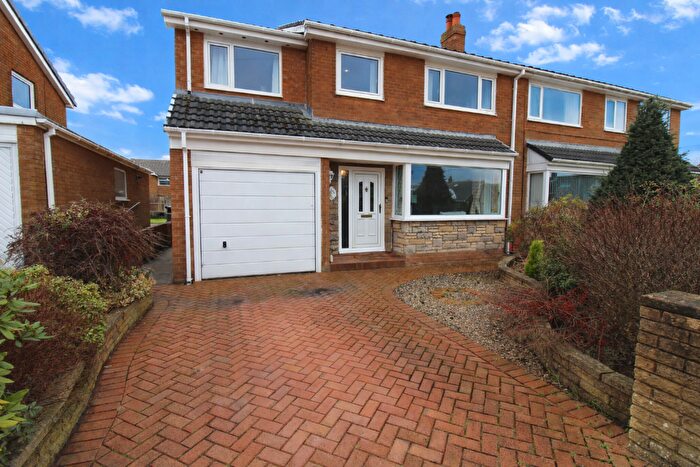
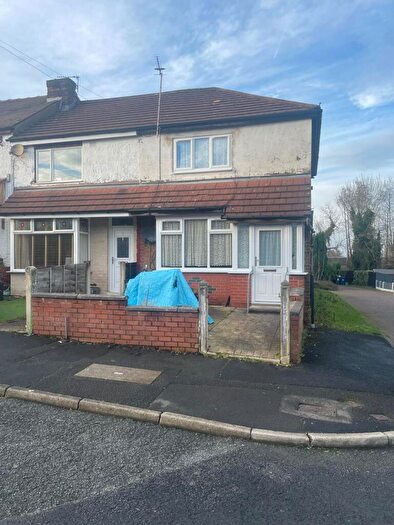
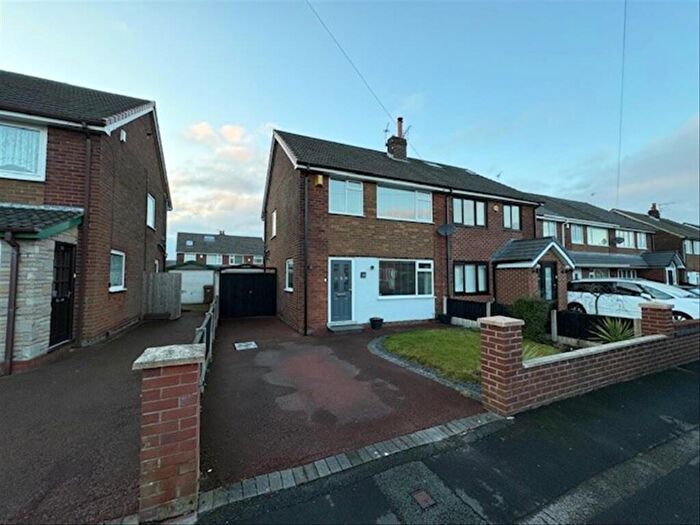
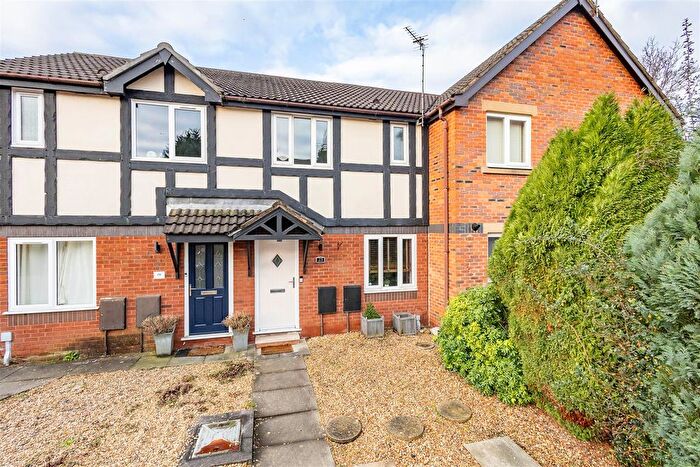
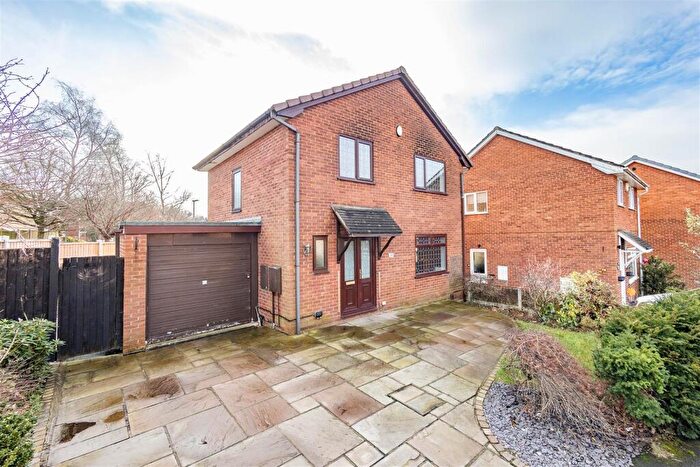
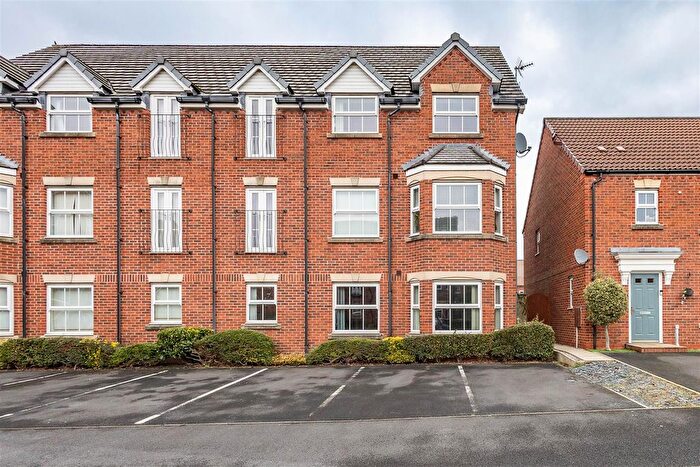
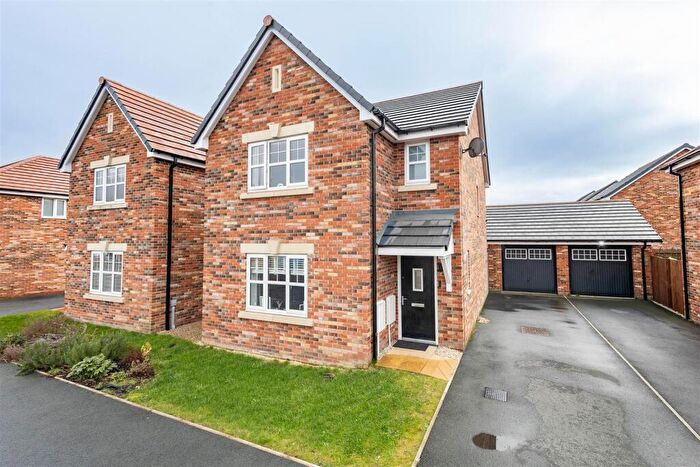
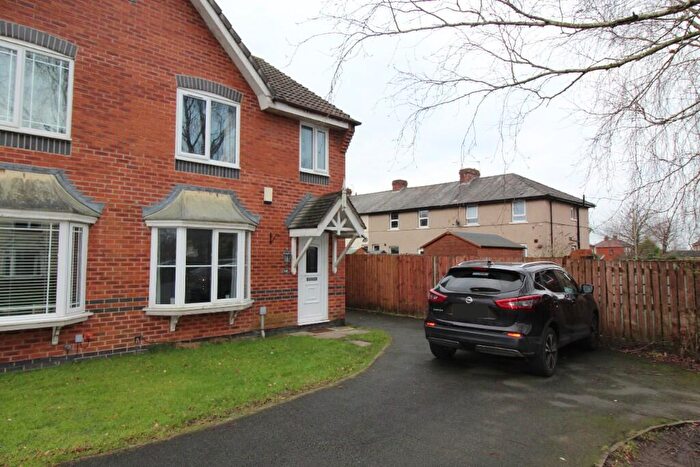
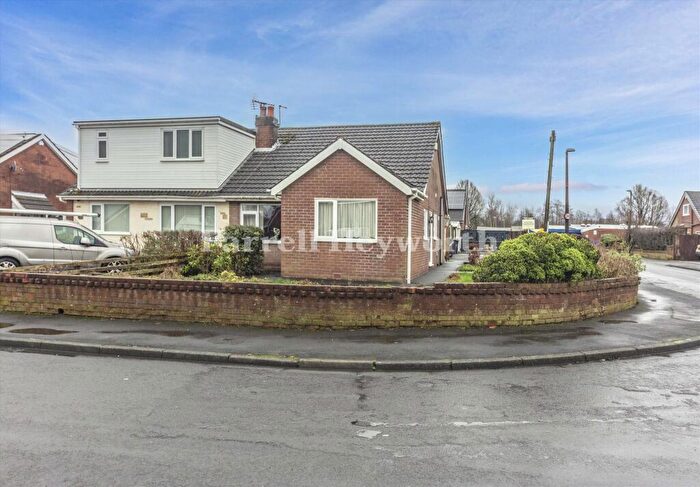
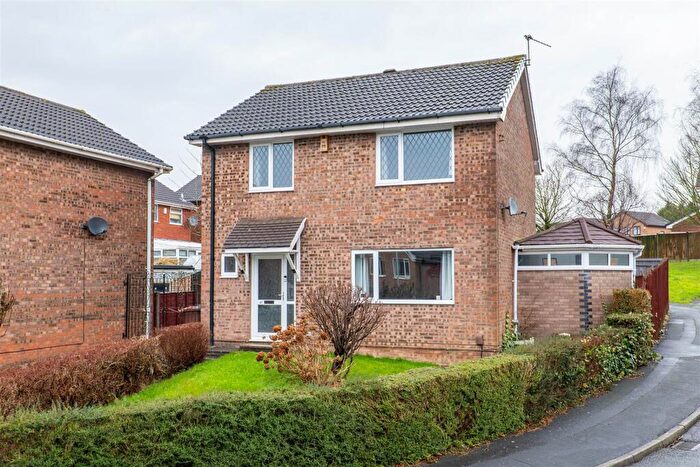
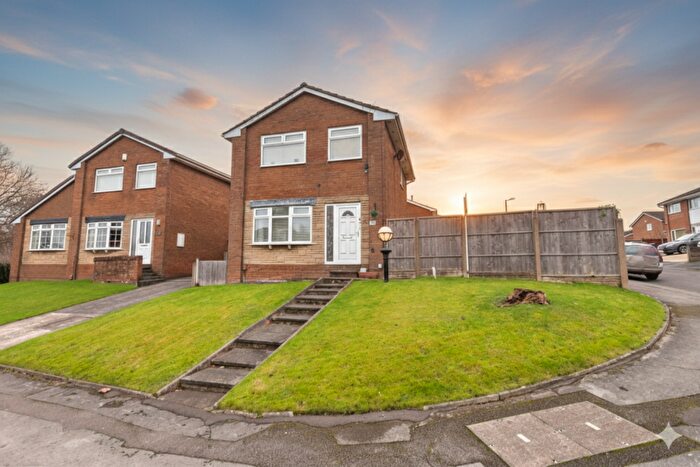
Properties for sale in Farington East
Roads and Postcodes in Farington East
Navigate through our locations to find the location of your next house in Farington East, Leyland for sale or to rent.
| Streets | Postcodes |
|---|---|
| Alvis Close | PR25 3DL |
| Assembly Avenue | PR25 3NX PR25 3NY PR25 3PA |
| Atlantean Drive | PR25 3NW |
| Bashall Grove | PR25 4JU |
| Boardman Close | PR25 3BZ PR25 3DB PR25 3GR |
| Bristol Avenue | PR25 4GD PR25 4QP PR25 4QZ PR25 4YR |
| Centurion Court | PR25 3UQ |
| Centurion Industrial Estate | PR25 4GU |
| Centurion Way | PR25 3BF |
| Clifton Parade | PR25 4YU |
| Coventry Close | PR25 3EG |
| Crown Street | PR25 4QH |
| Easedale Close | PR25 3XH |
| East Street | PR25 4QD |
| Farington Court | PR25 4QX |
| Farington Lodge Gardens | PR25 4AB |
| Foden Close | PR25 3EF |
| Foundry Close | PR25 3RA |
| Fowler Avenue | PR26 6RL |
| Fowler Lane | PR25 3RJ |
| Gloucester Avenue | PR25 4QQ |
| Grasmere Avenue | PR25 3XF |
| Hayeswater Road | PR25 3XG |
| Highfield Avenue | PR25 4GP |
| Kew Gardens | PR25 4QN |
| Kieshaw Drive | PR25 4AE |
| Knowsley Avenue | PR25 4GS |
| Lancashire Enterprise Business Park | PR26 6TX |
| Lever House Lane | PR25 4XL PR25 4XN PR25 4XP |
| Library Close | PR25 3EU |
| Llama Close | PR25 3NT |
| Lydiate Lane | PR25 4UB |
| Mill Street | PR25 4GJ PR25 4QJ |
| Rose Street | PR25 4GH |
| School Street | PR25 4QB |
| Spring Croft | PR25 4QY |
| St Annes Road | PR25 4XQ PR25 4XR PR25 4XS |
| St Christines Avenue | PR25 4YS |
| St Clements Avenue | PR25 4QU |
| St Judes Avenue | PR25 4YT |
| St Margarets Road | PR25 4XT |
| Stanifield Close | PR25 4GL |
| Stanifield Lane | PR25 4GA PR25 4QA PR25 4QL PR25 4QR PR25 4QT PR25 4QF PR25 4QG PR25 4UA PR25 4UD |
| Stanley Avenue | PR25 4QS |
| Stanley Road | PR25 4RH |
| Stevenson Avenue | PR25 4GQ |
| Swift Drive | PR25 3DG |
| Terrier Grove | PR25 3NU |
| The Square | PR25 4GB |
| Triumph Road | PR25 3DZ |
| Ullswater Close | PR25 3XL |
| Victory Drive | PR25 3DD |
| Woodside | PR25 4GT |
| Woodville Street | PR25 4GE PR25 4QE |
| PR25 3DJ |
Transport near Farington East
- FAQ
- Price Paid By Year
- Property Type Price
Frequently asked questions about Farington East
What is the average price for a property for sale in Farington East?
The average price for a property for sale in Farington East is £197,690. This amount is 12% lower than the average price in Leyland. There are 689 property listings for sale in Farington East.
What streets have the most expensive properties for sale in Farington East?
The streets with the most expensive properties for sale in Farington East are Farington Lodge Gardens at an average of £825,000, Woodside at an average of £300,000 and Victory Drive at an average of £277,500.
What streets have the most affordable properties for sale in Farington East?
The streets with the most affordable properties for sale in Farington East are Mill Street at an average of £114,555, East Street at an average of £118,875 and Woodville Street at an average of £133,700.
Which train stations are available in or near Farington East?
Some of the train stations available in or near Farington East are Leyland, Lostock Hall and Bamber Bridge.
Property Price Paid in Farington East by Year
The average sold property price by year was:
| Year | Average Sold Price | Price Change |
Sold Properties
|
|---|---|---|---|
| 2025 | £208,495 | 10% |
81 Properties |
| 2024 | £187,769 | -4% |
74 Properties |
| 2023 | £195,905 | -6% |
79 Properties |
| 2022 | £207,035 | 8% |
160 Properties |
| 2021 | £190,714 | 6% |
155 Properties |
| 2020 | £179,220 | 10% |
147 Properties |
| 2019 | £161,163 | 3% |
131 Properties |
| 2018 | £156,578 | -2% |
152 Properties |
| 2017 | £158,952 | -2% |
113 Properties |
| 2016 | £162,125 | -5% |
117 Properties |
| 2015 | £170,930 | 13% |
102 Properties |
| 2014 | £147,873 | 13% |
84 Properties |
| 2013 | £127,955 | 3% |
59 Properties |
| 2012 | £124,113 | 9% |
46 Properties |
| 2011 | £112,707 | -6% |
32 Properties |
| 2010 | £119,560 | -3% |
38 Properties |
| 2009 | £122,581 | -0,2% |
30 Properties |
| 2008 | £122,860 | -6% |
27 Properties |
| 2007 | £130,024 | 8% |
80 Properties |
| 2006 | £119,706 | -1% |
83 Properties |
| 2005 | £121,249 | 11% |
51 Properties |
| 2004 | £107,755 | 23% |
73 Properties |
| 2003 | £83,236 | 24% |
80 Properties |
| 2002 | £63,470 | 12% |
92 Properties |
| 2001 | £55,582 | 12% |
62 Properties |
| 2000 | £49,147 | -5% |
71 Properties |
| 1999 | £51,407 | 10% |
62 Properties |
| 1998 | £46,075 | 10% |
52 Properties |
| 1997 | £41,586 | -6% |
60 Properties |
| 1996 | £44,039 | 5% |
61 Properties |
| 1995 | £41,929 | - |
54 Properties |
Property Price per Property Type in Farington East
Here you can find historic sold price data in order to help with your property search.
The average Property Paid Price for specific property types in the last three years are:
| Property Type | Average Sold Price | Sold Properties |
|---|---|---|
| Semi Detached House | £193,185.00 | 128 Semi Detached Houses |
| Detached House | £286,498.00 | 43 Detached Houses |
| Terraced House | £146,229.00 | 63 Terraced Houses |

