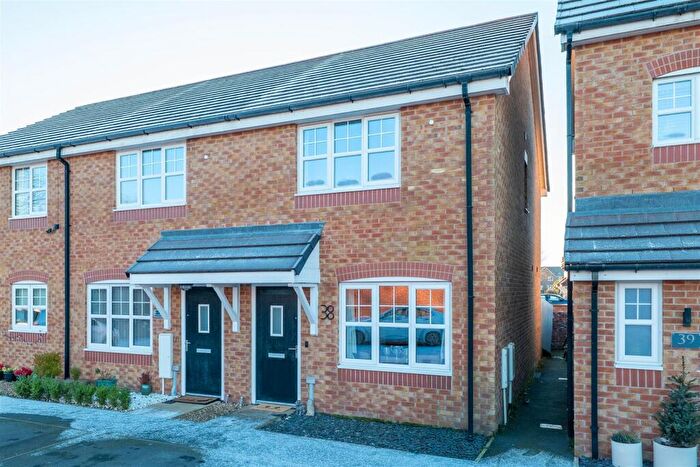
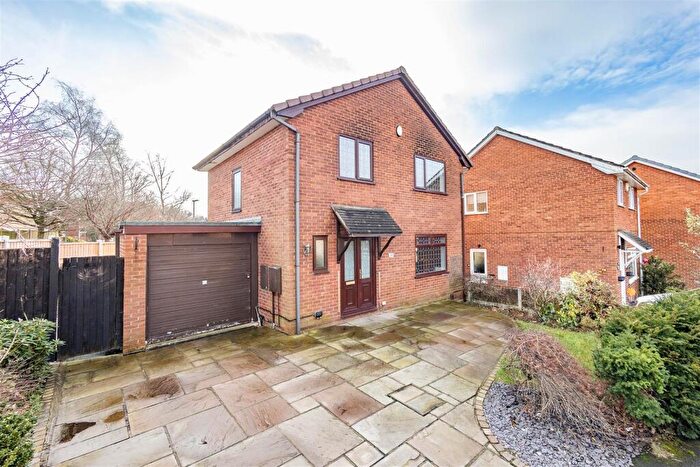
Houses for sale & to rent in Leyland St. Ambrose, Leyland
House Prices in Leyland St. Ambrose
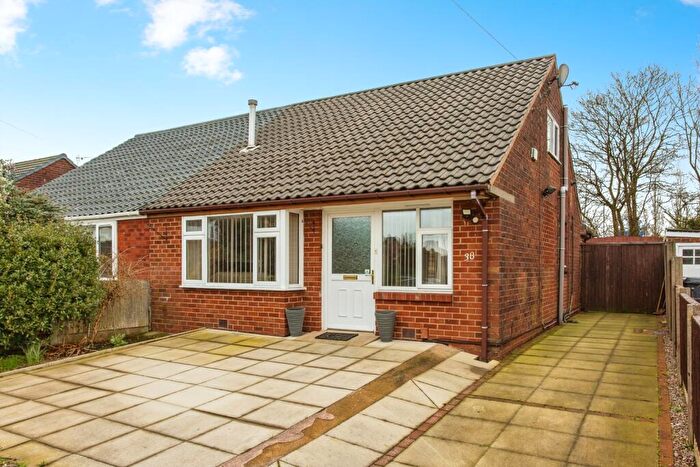
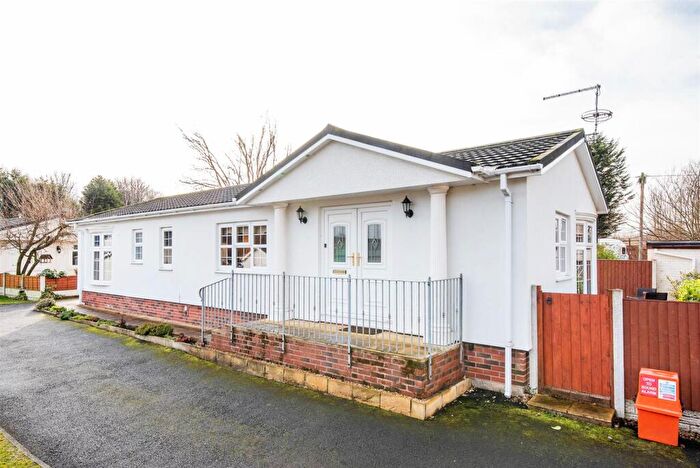
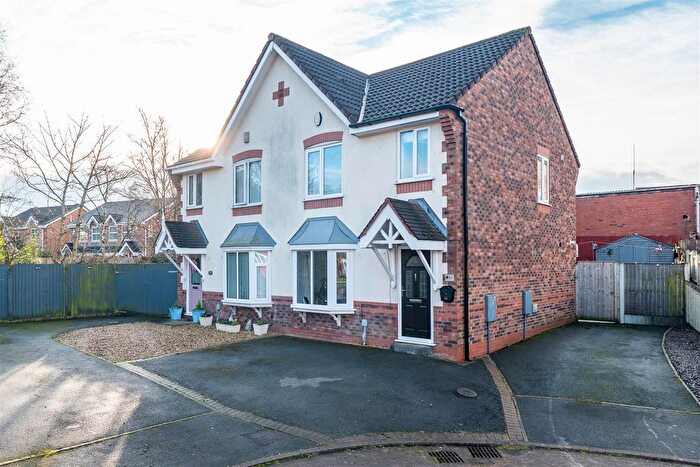
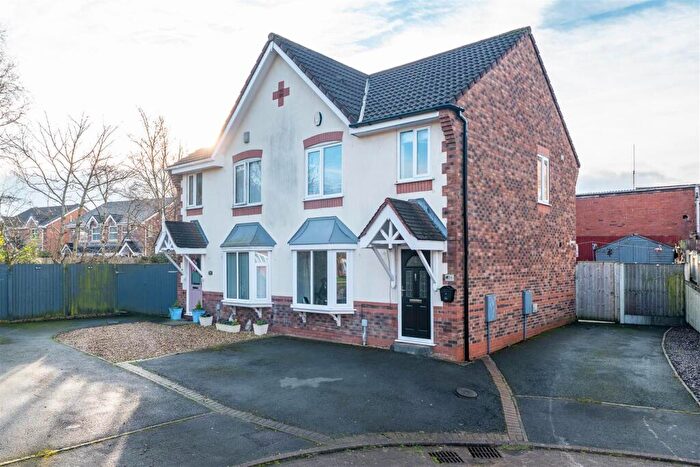
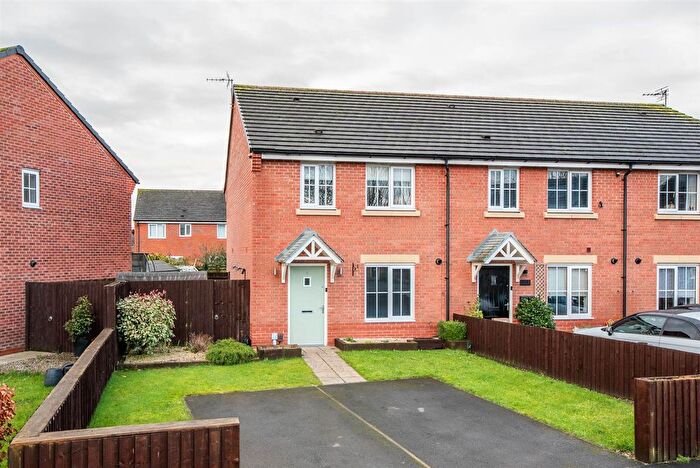
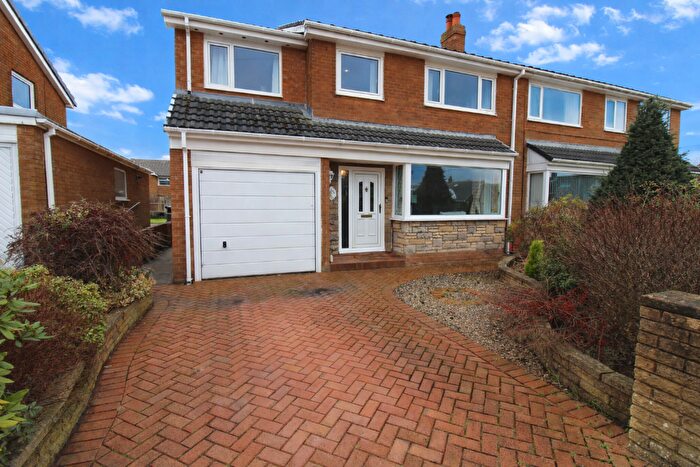
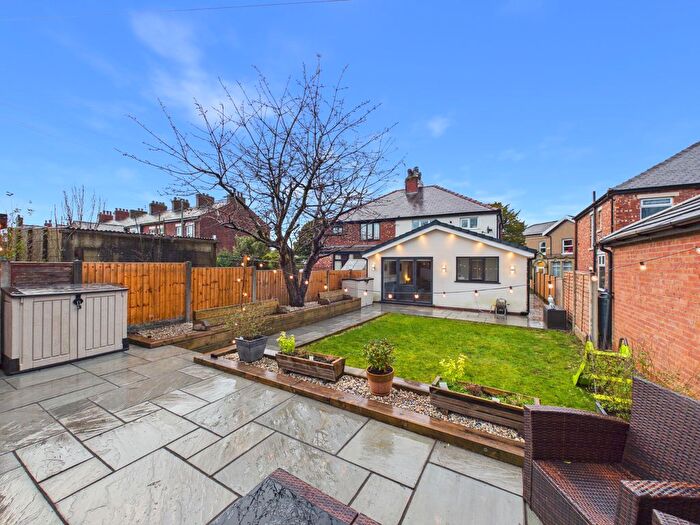
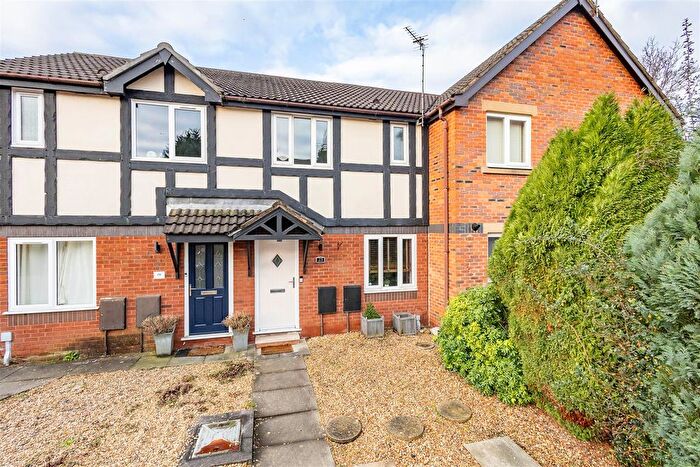
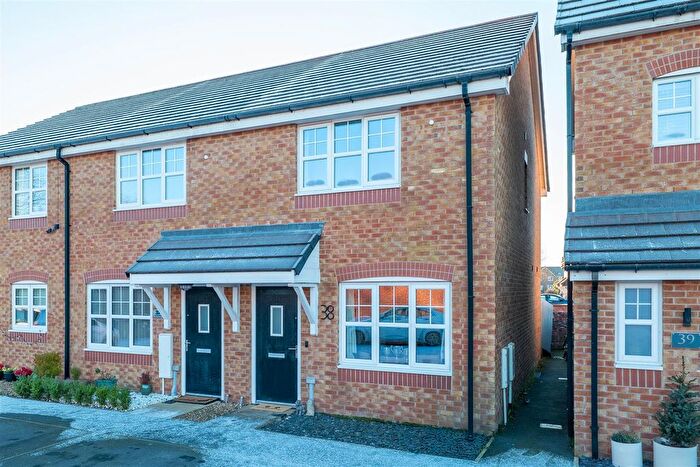
Properties in Leyland St. Ambrose have an average house price of £184,084.00 and had 141 Property Transactions within the last 3 years¹.
Leyland St. Ambrose is an area in Leyland, Lancashire with 1,354 households², where the most expensive property was sold for £950,000.00.
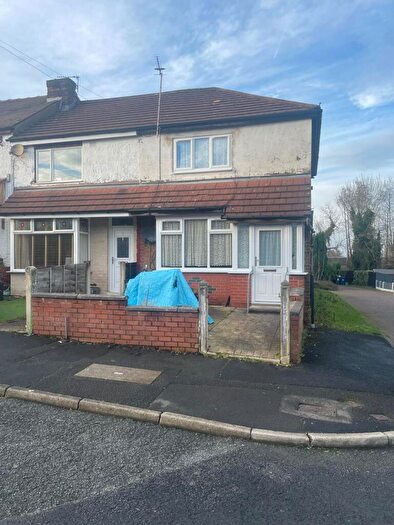
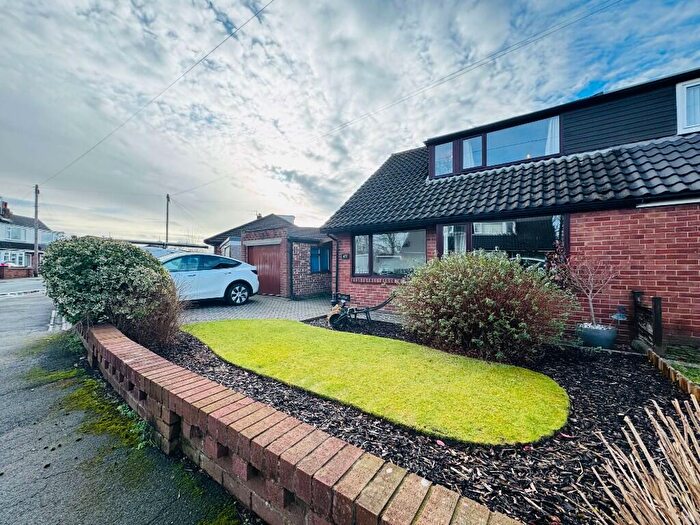
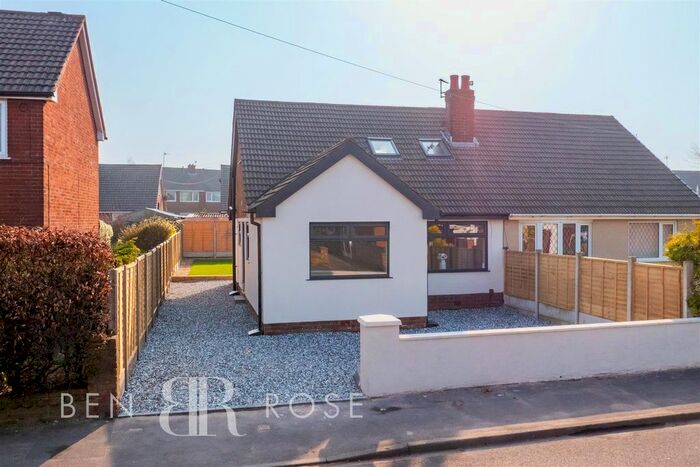
Properties for sale in Leyland St. Ambrose
Roads and Postcodes in Leyland St. Ambrose
Navigate through our locations to find the location of your next house in Leyland St. Ambrose, Leyland for sale or to rent.
| Streets | Postcodes |
|---|---|
| Albert Road | PR25 4YJ |
| Ambrose Street | PR25 5UW |
| Arundel Way | PR25 4YQ |
| Balmoral Avenue | PR25 4HX |
| Beaumaris Road | PR25 4ZQ |
| Belvedere Road | PR25 4SU |
| Bent Lane | PR25 4HP PR25 4HQ PR25 4HR PR25 4HS PR25 4YD PR25 4ZD |
| Boundary Street | PR25 4ST |
| Bow Lane | PR25 4YA PR25 4YB |
| Church Street | PR25 4XE |
| Clarence Street | PR25 4SX PR25 4SY |
| Convent Close | PR25 4PW |
| Conway Avenue | PR25 4HU |
| Cross Street | PR25 4PA |
| Dawson Lane | PR25 5DB |
| Denbigh Close | PR25 4YY |
| Derby Street | PR25 4NU |
| Edinburgh Close | PR25 4UT |
| George Street | PR25 4NX PR25 4NY |
| Glamis Road | PR25 4YP PR25 4ZJ |
| Harlech Drive | PR25 4YX |
| Heald House Road | PR25 4JA |
| Hill Road | PR25 4YL |
| Ingleborough Way | PR25 4ZR PR25 4ZS |
| Lynton Avenue | PR25 4HY |
| Marshalls Brow | PR25 4XD |
| Melton Place | PR25 4XU |
| Moss Lane | PR25 4SH PR25 4XA |
| Murray Street | PR25 4ZB |
| Preston Road | PR25 4NT |
| Priory Close | PR25 4XZ |
| Railway Street | PR25 4XB |
| Russell Avenue | PR25 4ZH |
| Ryden Avenue | PR25 4YN PR25 4ZL |
| Sandringham Avenue | PR25 4YH |
| St Ambrose Terrace | PR25 4XH |
| St Catherines Close | PR25 4ZY |
| St Davids Road | PR25 4UX PR25 4UY PR25 4XX PR25 4XY |
| Stirling Close | PR25 4UU |
| The Chase | PR25 4SW |
| The Cloisters | PR25 4SZ |
| Whernside Way | PR25 4ZN |
| Wigan Road | PR25 5DA PR25 5UD |
| Wrights Fold | PR25 4HT |
| Young Avenue | PR25 4YE PR25 4ZE |
Transport near Leyland St. Ambrose
-
Leyland Station
-
Buckshaw Parkway Station
-
Lostock Hall Station
-
Bamber Bridge Station
-
Euxton Balshaw Lane Station
- FAQ
- Price Paid By Year
- Property Type Price
Frequently asked questions about Leyland St. Ambrose
What is the average price for a property for sale in Leyland St. Ambrose?
The average price for a property for sale in Leyland St. Ambrose is £184,084. This amount is 18% lower than the average price in Leyland. There are 977 property listings for sale in Leyland St. Ambrose.
What streets have the most expensive properties for sale in Leyland St. Ambrose?
The streets with the most expensive properties for sale in Leyland St. Ambrose are The Cloisters at an average of £371,500, Heald House Road at an average of £355,000 and The Chase at an average of £350,000.
What streets have the most affordable properties for sale in Leyland St. Ambrose?
The streets with the most affordable properties for sale in Leyland St. Ambrose are Preston Road at an average of £80,000, Boundary Street at an average of £102,741 and Church Street at an average of £103,750.
Which train stations are available in or near Leyland St. Ambrose?
Some of the train stations available in or near Leyland St. Ambrose are Leyland, Buckshaw Parkway and Lostock Hall.
Property Price Paid in Leyland St. Ambrose by Year
The average sold property price by year was:
| Year | Average Sold Price | Price Change |
Sold Properties
|
|---|---|---|---|
| 2025 | £193,007 | 11% |
47 Properties |
| 2024 | £171,788 | -10% |
52 Properties |
| 2023 | £189,320 | 7% |
42 Properties |
| 2022 | £175,315 | 6% |
58 Properties |
| 2021 | £164,867 | 13% |
80 Properties |
| 2020 | £142,747 | 4% |
49 Properties |
| 2019 | £136,377 | -1% |
45 Properties |
| 2018 | £138,054 | 0,3% |
60 Properties |
| 2017 | £137,635 | -7% |
58 Properties |
| 2016 | £147,237 | 9% |
43 Properties |
| 2015 | £133,509 | 11% |
40 Properties |
| 2014 | £118,989 | -13% |
46 Properties |
| 2013 | £134,123 | 13% |
38 Properties |
| 2012 | £116,452 | -5% |
44 Properties |
| 2011 | £121,893 | -6% |
28 Properties |
| 2010 | £129,341 | 1% |
33 Properties |
| 2009 | £128,165 | 1% |
32 Properties |
| 2008 | £127,044 | -5% |
41 Properties |
| 2007 | £133,152 | 10% |
78 Properties |
| 2006 | £119,812 | 7% |
95 Properties |
| 2005 | £111,114 | 8% |
71 Properties |
| 2004 | £102,514 | 17% |
54 Properties |
| 2003 | £84,918 | 18% |
70 Properties |
| 2002 | £69,418 | 20% |
87 Properties |
| 2001 | £55,877 | 7% |
77 Properties |
| 2000 | £52,089 | -1% |
78 Properties |
| 1999 | £52,724 | 17% |
55 Properties |
| 1998 | £43,651 | -3% |
69 Properties |
| 1997 | £45,048 | 2% |
84 Properties |
| 1996 | £44,282 | -2% |
71 Properties |
| 1995 | £45,248 | - |
63 Properties |
Property Price per Property Type in Leyland St. Ambrose
Here you can find historic sold price data in order to help with your property search.
The average Property Paid Price for specific property types in the last three years are:
| Property Type | Average Sold Price | Sold Properties |
|---|---|---|
| Semi Detached House | £188,829.00 | 73 Semi Detached Houses |
| Detached House | £313,194.00 | 18 Detached Houses |
| Terraced House | £132,568.00 | 48 Terraced Houses |
| Flat | £85,250.00 | 2 Flats |

