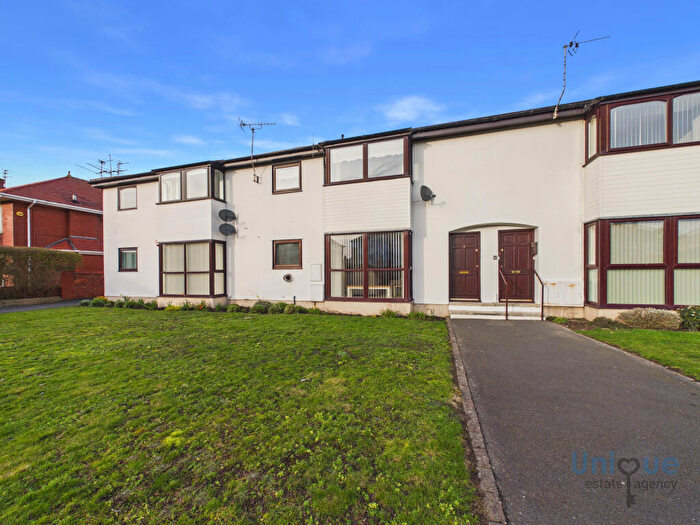
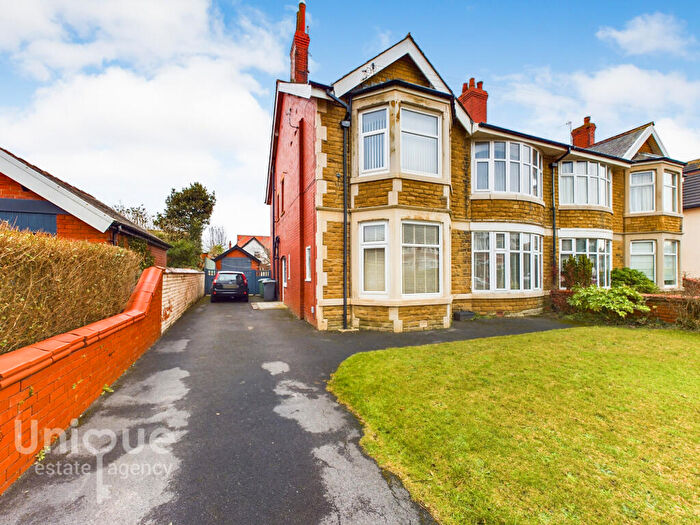
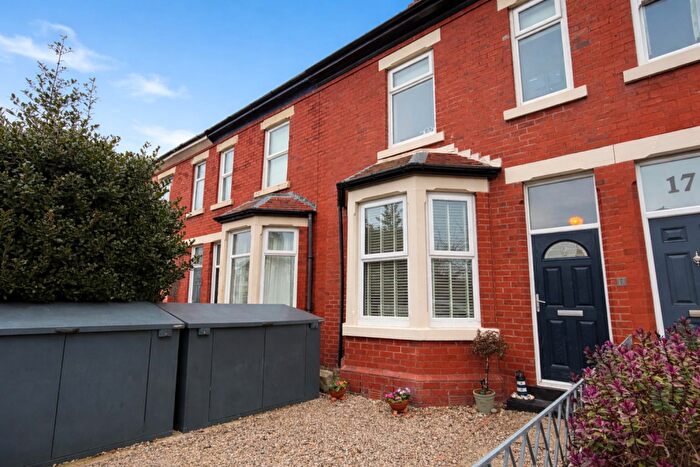
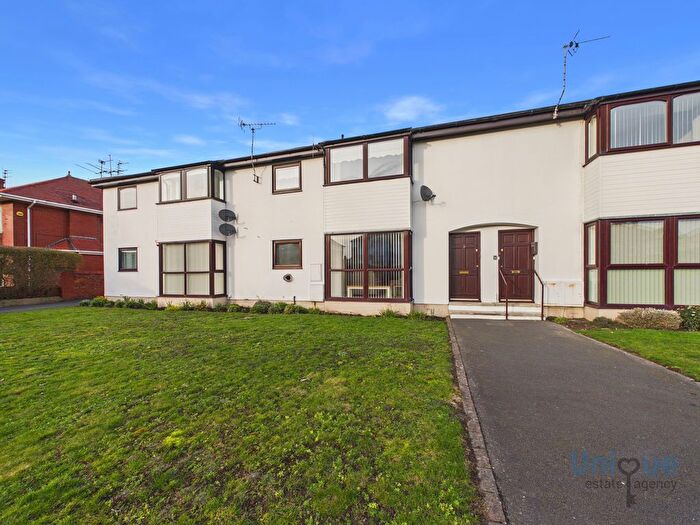
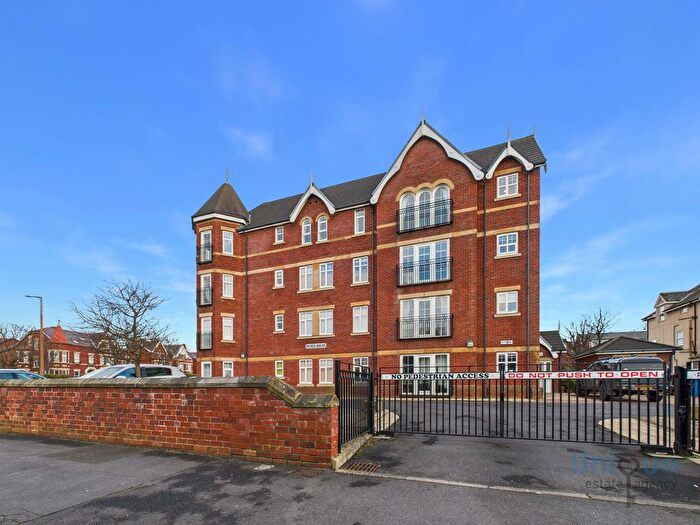
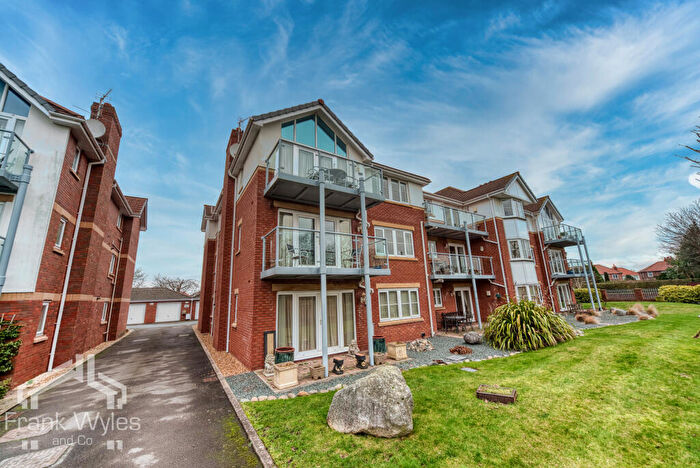
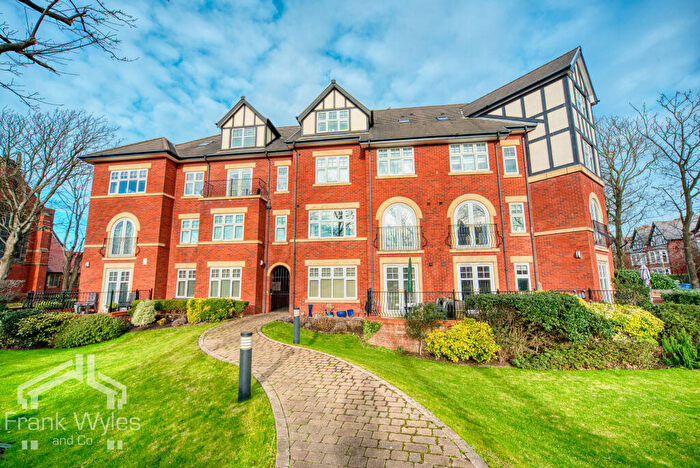
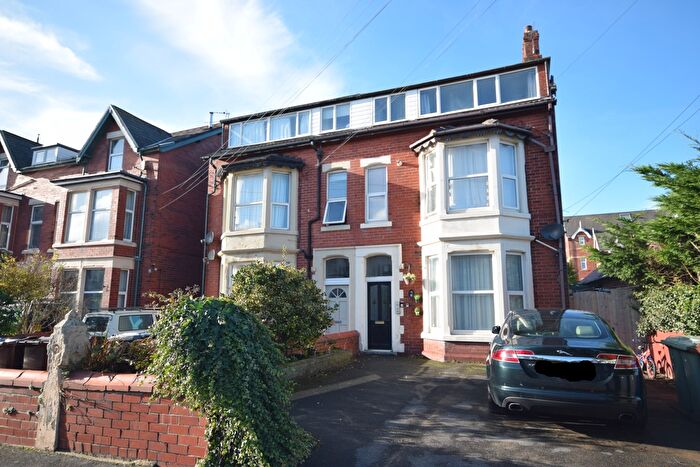
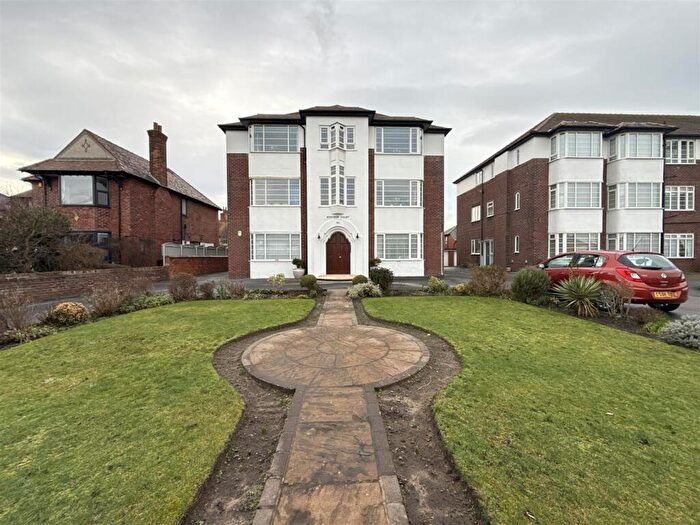
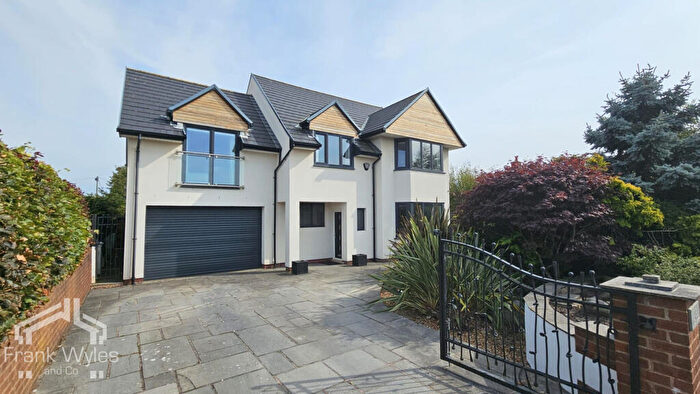
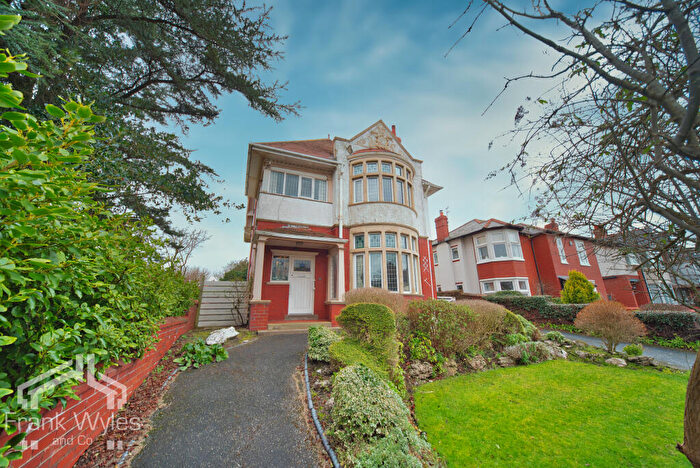
Houses for sale & to rent in Fairhaven, Lytham St Annes
House Prices in Fairhaven
Properties in Fairhaven have an average house price of £319,189.00 and had 232 Property Transactions within the last 3 years¹.
Fairhaven is an area in Lytham St Annes, Lancashire with 2,036 households², where the most expensive property was sold for £1,365,000.00.
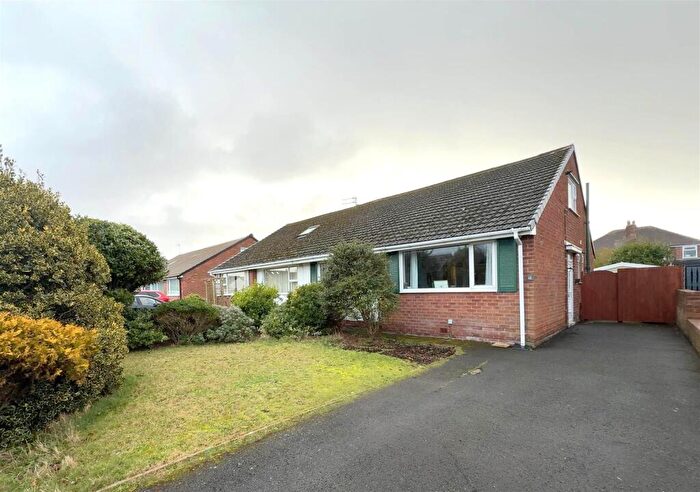
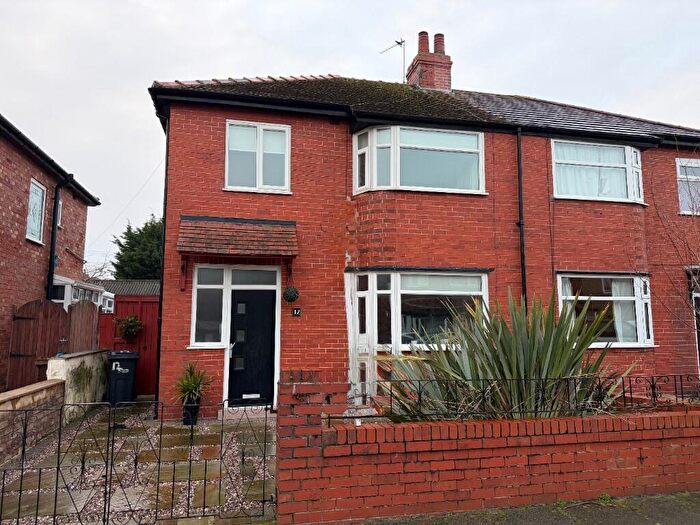
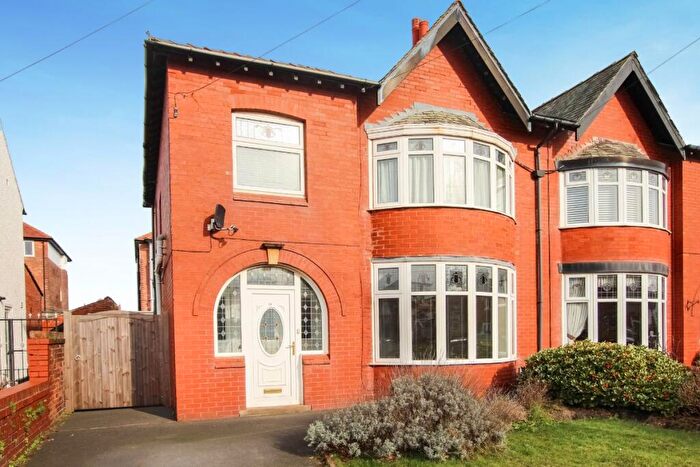
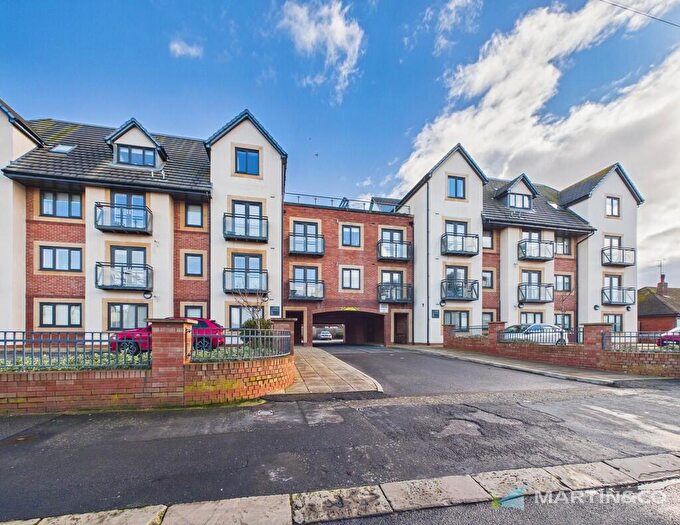
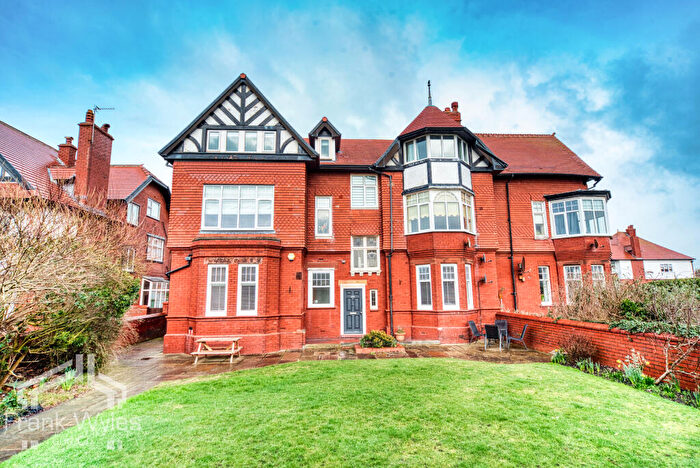
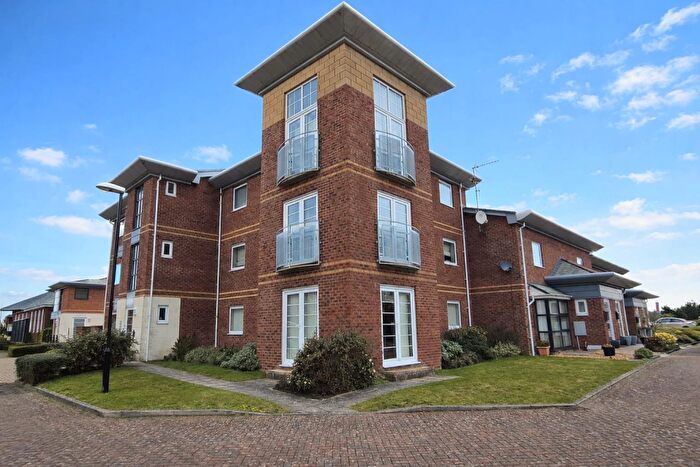
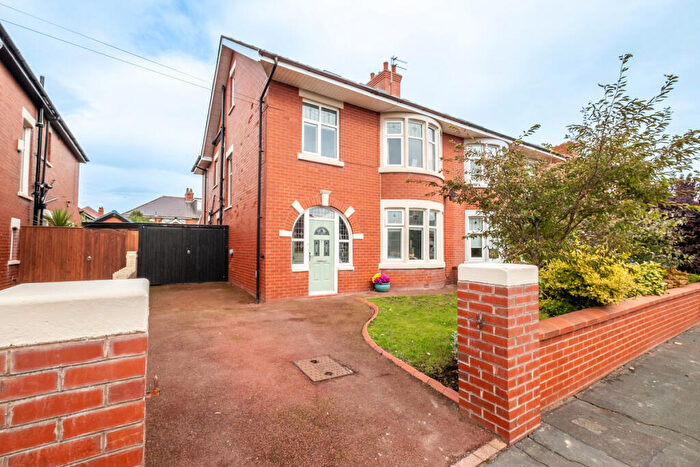
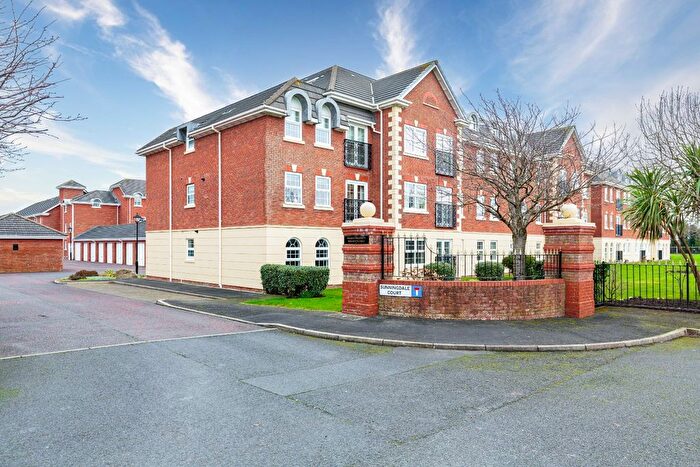
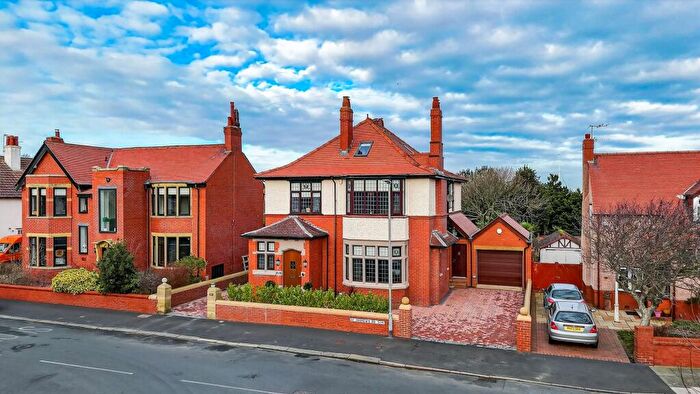
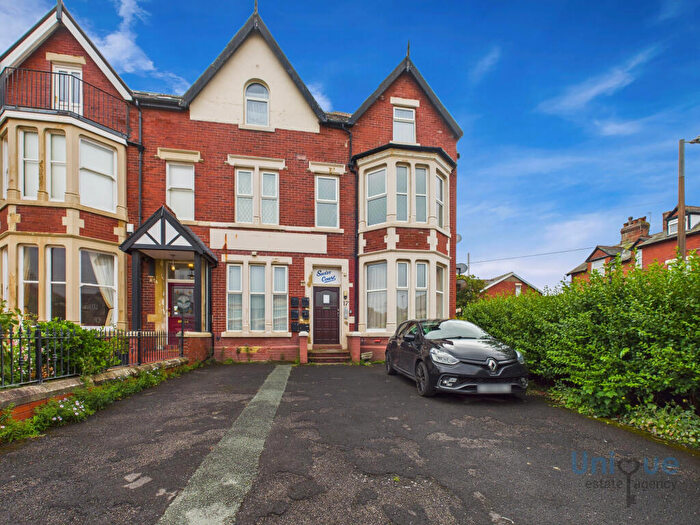
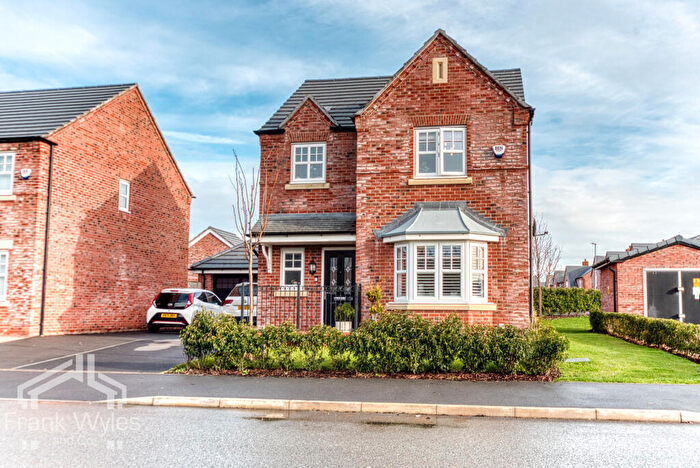
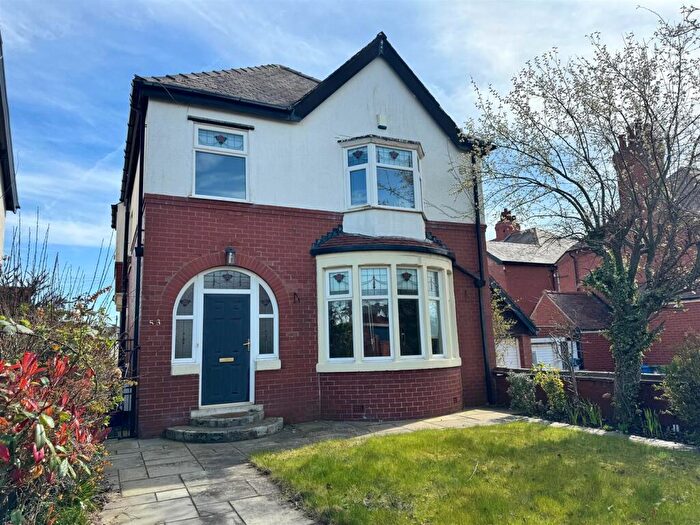
Properties for sale in Fairhaven
Roads and Postcodes in Fairhaven
Navigate through our locations to find the location of your next house in Fairhaven, Lytham St Annes for sale or to rent.
| Streets | Postcodes |
|---|---|
| Alexandria Drive | FY8 1JD FY8 1JF FY8 1NL |
| Arundel Road | FY8 1AF FY8 1BL FY8 1BN |
| Bailey Avenue | FY8 1FG FY8 1FE FY8 1FH FY8 1FL |
| Balmoral Road | FY8 1ER |
| Beach Avenue | FY8 1BA |
| Cartmell Road | FY8 1DE FY8 1DF |
| Channing Road | FY8 1BJ |
| Clifton Drive | FY8 1AT FY8 1BY FY8 1BZ FY8 1DU FY8 1DX FY8 1AS |
| Clifton Drive South | FY8 1EY FY8 1HG FY8 1HQ FY8 1HW FY8 1HX FY8 1ES FY8 1FJ FY8 1HU FY8 1HY FY8 1NH FY8 1DT |
| Coronation Road | FY8 1BH |
| Croyde Road | FY8 1EX |
| Cyprus Avenue | FY8 1DY FY8 1DZ |
| Denford Avenue | FY8 1DJ FY8 1EJ |
| Derbe Road | FY8 1NJ |
| Eddington Road | FY8 1BS |
| Elizabeth Court | FY8 1FD |
| Evesham Road | FY8 1HE |
| Fairhaven Road | FY8 1FQ FY8 1NN |
| Finsbury Avenue | FY8 1BP |
| Hungerford Road | FY8 1EP |
| Inner Promenade | FY8 1AZ FY8 1BB FY8 1DW FY8 1EA FY8 1EQ |
| King Edward Avenue | FY8 1DP FY8 1FB FY8 1FF FY8 1DR |
| Kingsway | FY8 1AB FY8 1AD FY8 1AW FY8 1AQ FY8 1AR |
| Kintbury Road | FY8 1DQ |
| Lake Road | FY8 1BE |
| Lake Road North | FY8 1AG |
| Lancaster Avenue | FY8 1DL |
| Laverton Road | FY8 1EN FY8 1EW |
| Lightburne Avenue | FY8 1JE |
| Marine Drive | FY8 1AU |
| Miletas Place | FY8 1BQ |
| Myra Road | FY8 1EB |
| Newbury Road | FY8 1DG FY8 1DH |
| Osborne Road | FY8 1HS FY8 1HT |
| Pershore Road | FY8 1HA FY8 1PB |
| Pollux Gate | FY8 1BG |
| Princes Road | FY8 1AE |
| Queen Mary Avenue | FY8 1HF |
| Queens Road | FY8 1HR |
| Riley Avenue | FY8 1HZ FY8 1JB FY8 1JA |
| Rosebery Avenue | FY8 1BW |
| Sandringham Road | FY8 1EZ |
| Shalbourn Road | FY8 1DN |
| South Promenade | FY8 1NU FY8 1NG FY8 1NP FY8 1WA FY8 1WB |
| St Andrews Road South | FY8 1EU FY8 1YB FY8 1YA |
| St Pauls Avenue | FY8 1ED |
| St Pauls Walk | FY8 1BX |
| The Boulevard | FY8 1EL FY8 1EH |
| Windsor Road | FY8 1ET |
| Woodlands Road | FY8 1DA FY8 1YJ |
| York Road | FY8 1HP |
| FY8 1BD |
Transport near Fairhaven
- FAQ
- Price Paid By Year
- Property Type Price
Frequently asked questions about Fairhaven
What is the average price for a property for sale in Fairhaven?
The average price for a property for sale in Fairhaven is £319,189. This amount is 18% higher than the average price in Lytham St Annes. There are 1,079 property listings for sale in Fairhaven.
What streets have the most expensive properties for sale in Fairhaven?
The streets with the most expensive properties for sale in Fairhaven are Beach Avenue at an average of £760,000, Inner Promenade at an average of £714,825 and Croyde Road at an average of £621,000.
What streets have the most affordable properties for sale in Fairhaven?
The streets with the most affordable properties for sale in Fairhaven are Woodlands Road at an average of £108,750, Bailey Avenue at an average of £156,556 and Fairhaven Road at an average of £169,375.
Which train stations are available in or near Fairhaven?
Some of the train stations available in or near Fairhaven are Ansdell and Fairhaven, St.Annes-On-The-Sea and Lytham.
Property Price Paid in Fairhaven by Year
The average sold property price by year was:
| Year | Average Sold Price | Price Change |
Sold Properties
|
|---|---|---|---|
| 2025 | £318,380 | 0,4% |
65 Properties |
| 2024 | £316,973 | -2% |
94 Properties |
| 2023 | £322,763 | -5% |
73 Properties |
| 2022 | £339,294 | 15% |
104 Properties |
| 2021 | £289,846 | -1% |
118 Properties |
| 2020 | £291,326 | 14% |
84 Properties |
| 2019 | £249,774 | -5% |
109 Properties |
| 2018 | £261,492 | 1% |
101 Properties |
| 2017 | £257,574 | 3% |
100 Properties |
| 2016 | £250,525 | 3% |
87 Properties |
| 2015 | £242,229 | 3% |
86 Properties |
| 2014 | £235,095 | -16% |
89 Properties |
| 2013 | £271,913 | 21% |
91 Properties |
| 2012 | £213,473 | -1% |
82 Properties |
| 2011 | £214,637 | -16% |
73 Properties |
| 2010 | £248,920 | 14% |
62 Properties |
| 2009 | £214,109 | -23% |
91 Properties |
| 2008 | £262,486 | 10% |
85 Properties |
| 2007 | £236,427 | -7% |
163 Properties |
| 2006 | £253,573 | 3% |
142 Properties |
| 2005 | £245,325 | 9% |
85 Properties |
| 2004 | £222,208 | 20% |
131 Properties |
| 2003 | £177,596 | 12% |
131 Properties |
| 2002 | £156,968 | 19% |
131 Properties |
| 2001 | £127,667 | 8% |
118 Properties |
| 2000 | £117,146 | 11% |
109 Properties |
| 1999 | £104,656 | 11% |
142 Properties |
| 1998 | £93,518 | -14% |
101 Properties |
| 1997 | £106,169 | 23% |
117 Properties |
| 1996 | £82,038 | -2% |
93 Properties |
| 1995 | £83,909 | - |
58 Properties |
Property Price per Property Type in Fairhaven
Here you can find historic sold price data in order to help with your property search.
The average Property Paid Price for specific property types in the last three years are:
| Property Type | Average Sold Price | Sold Properties |
|---|---|---|
| Semi Detached House | £369,460.00 | 53 Semi Detached Houses |
| Detached House | £562,201.00 | 54 Detached Houses |
| Terraced House | £316,495.00 | 11 Terraced Houses |
| Flat | £180,967.00 | 114 Flats |

