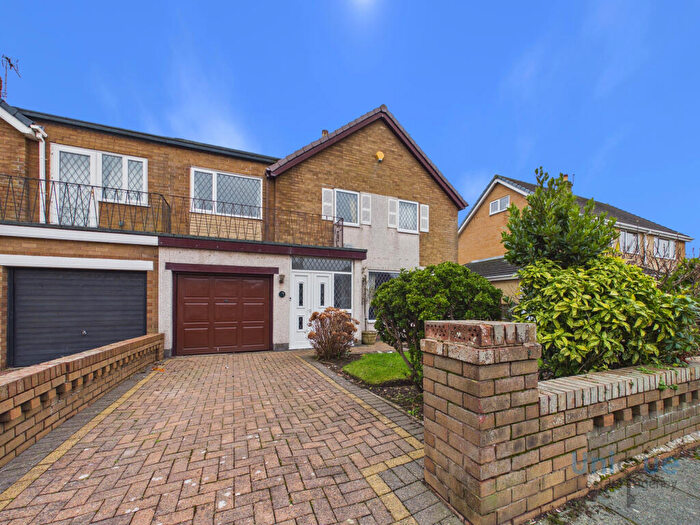
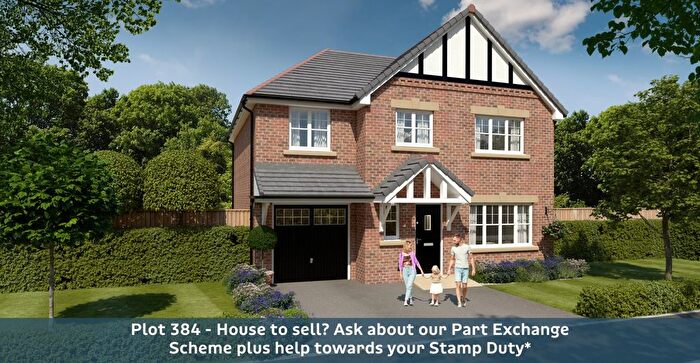
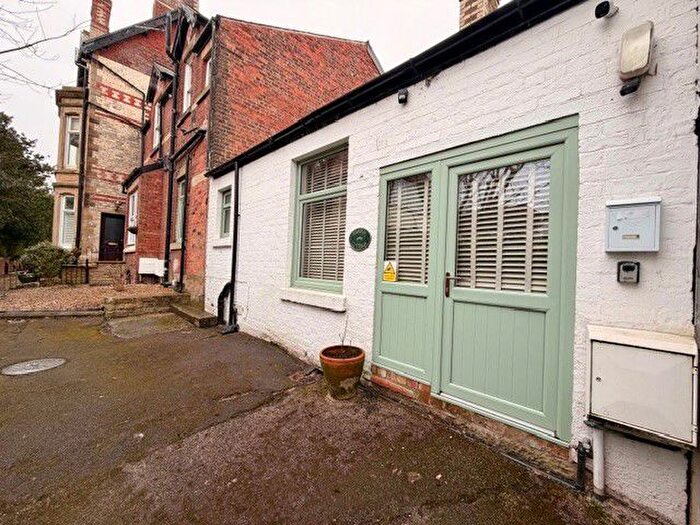
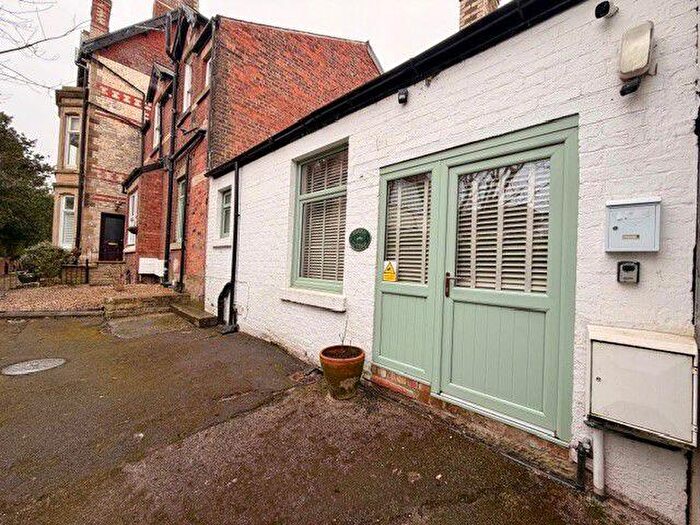
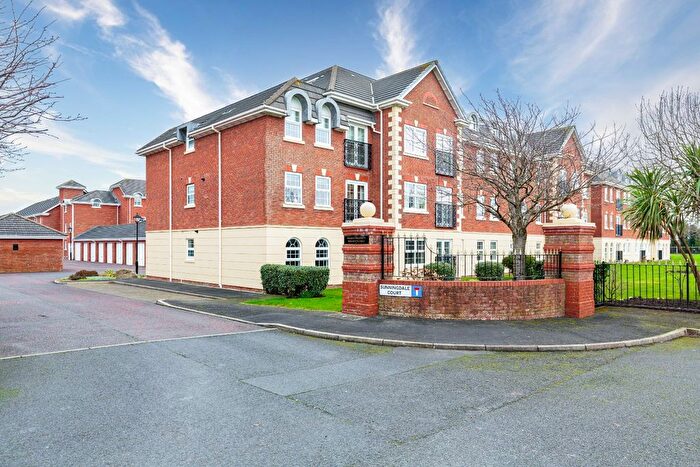
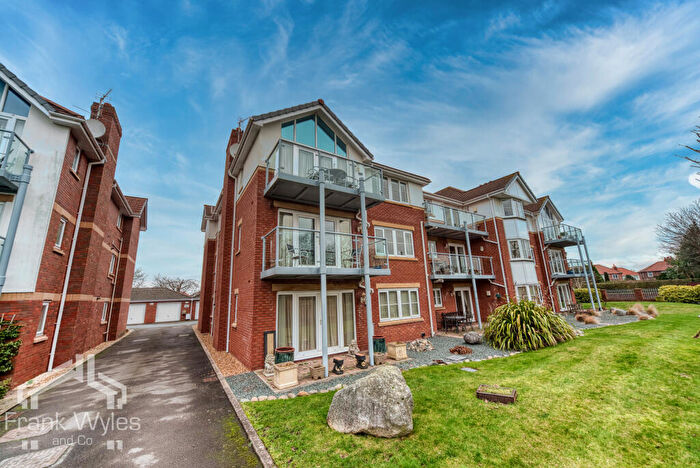
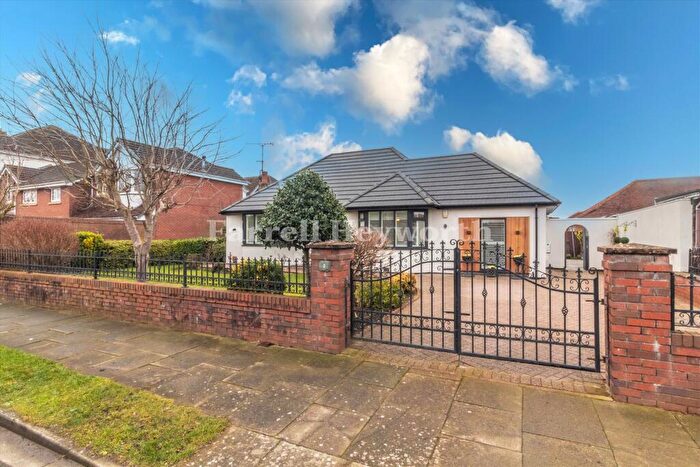
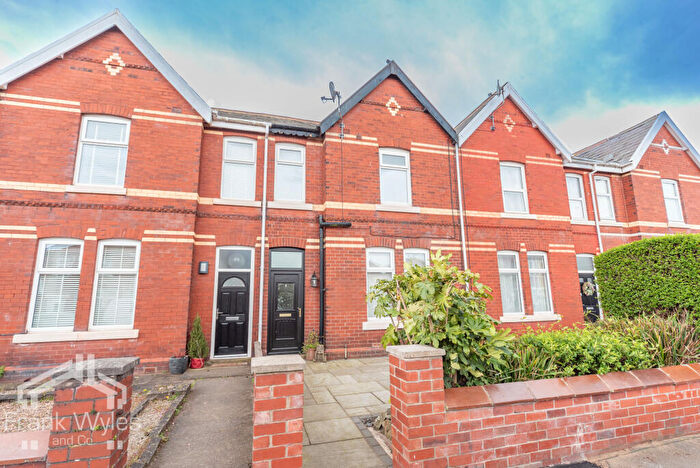
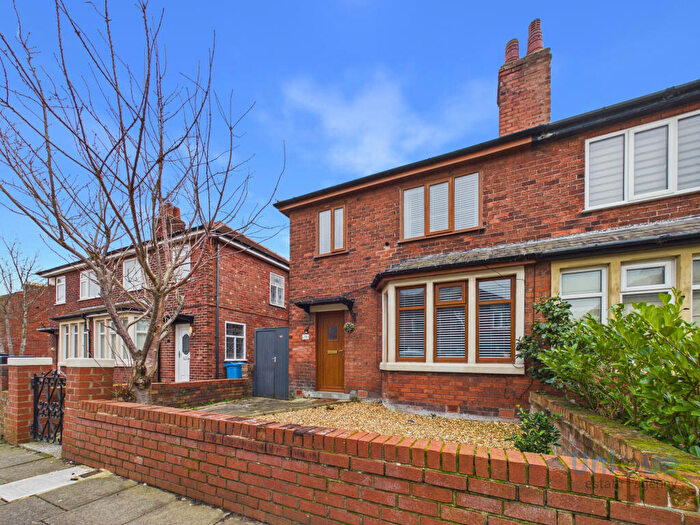
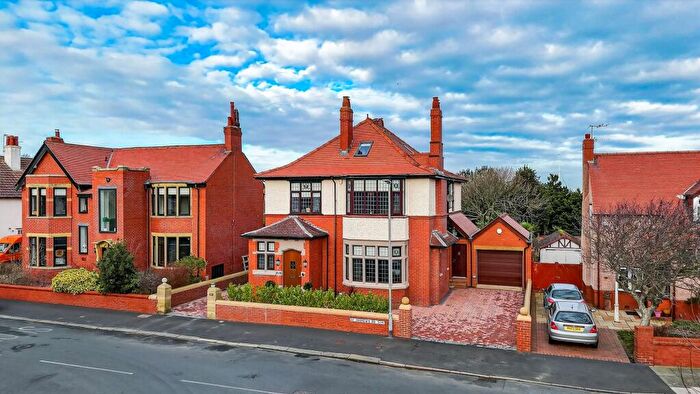
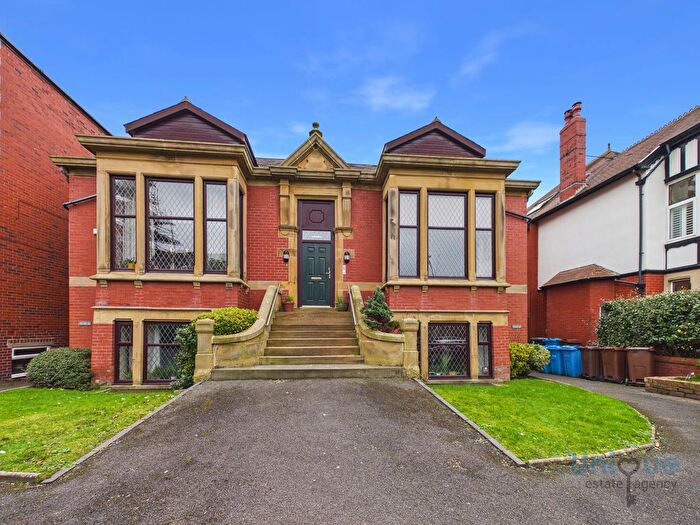
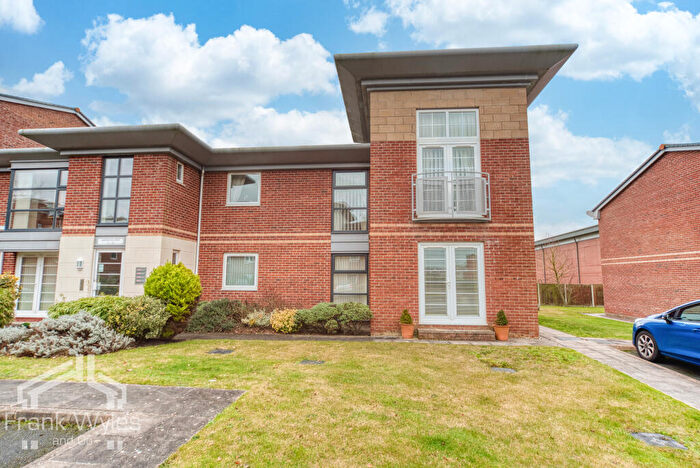
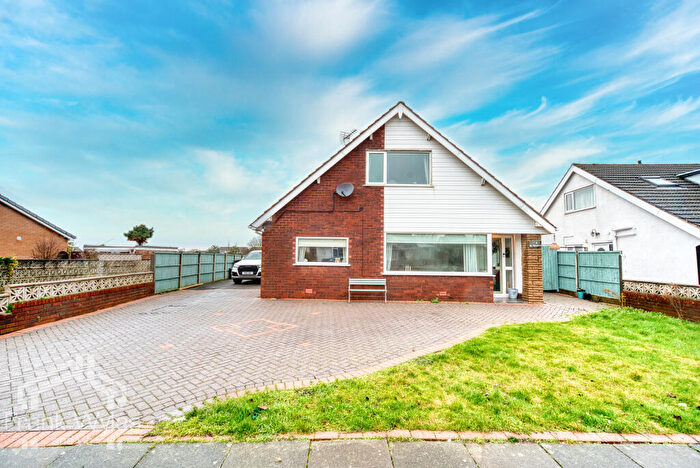
Houses for sale & to rent in Heyhouses, Lytham St Annes
House Prices in Heyhouses
Properties in Heyhouses have an average house price of £233,253.00 and had 273 Property Transactions within the last 3 years¹.
Heyhouses is an area in Lytham St Annes, Lancashire with 2,285 households², where the most expensive property was sold for £1,300,000.00.
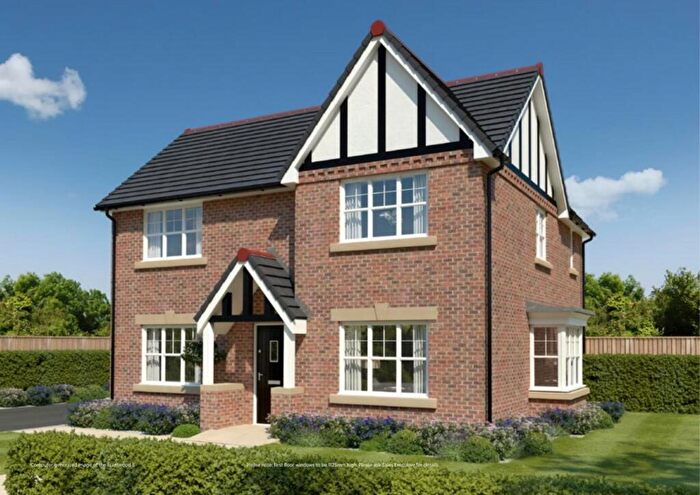
Properties for sale in Heyhouses
Roads and Postcodes in Heyhouses
Navigate through our locations to find the location of your next house in Heyhouses, Lytham St Annes for sale or to rent.
| Streets | Postcodes |
|---|---|
| Albert Road | FY8 3SH FY8 3SJ FY8 3SU |
| Alexandra Road | FY8 1YD FY8 1YE FY8 3SG |
| Banbury Road | FY8 1LA |
| Bartle Road | FY8 3JP |
| Beauclerk Road | FY8 3LH FY8 3LL |
| Berwick Road | FY8 1JS FY8 1JT |
| Bonney Lane | FY8 3UX |
| Boston Road | FY8 3PP FY8 3PR |
| Bowden Lane | FY8 3FN |
| Buckley Grove | FY8 3FP |
| Church Road | FY8 3NW FY8 3TG FY8 3TH FY8 3TJ FY8 3NJ FY8 3NL FY8 3NN |
| Curzon Road | FY8 3SQ FY8 3SX FY8 3SY FY8 3TE |
| Elmhurst Road | FY8 3JH |
| Elswick Place | FY8 3JY |
| Fairview Avenue | FY8 3TA |
| Fairways | FY8 3NB |
| Faulkner Crescent | FY8 3FJ FY8 3FL |
| Fisher Grove | FY8 3GZ |
| Grassington Road | FY8 3QE |
| Haymarket | FY8 3LW |
| Heaton Road | FY8 3JL |
| Heyhouses Lane | FY8 3RF FY8 3RN FY8 3RW FY8 3RG FY8 3RH |
| Hodder Drive | FY8 3PZ |
| Holmefield Road | FY8 1JX FY8 1JY |
| Hope Street | FY8 3SL |
| Hove Road | FY8 1SP FY8 1TP FY8 1XH FY8 1FA |
| Inskip Place | FY8 3JS |
| Kenilworth Road | FY8 1LB FY8 1LD FY8 1TZ |
| Lawrence Avenue | FY8 3LG |
| Leamington Road | FY8 1UA |
| Lima Road | FY8 3LP |
| Links Gate | FY8 3LF FY8 3LJ FY8 3LQ |
| Lowton Road | FY8 3JG |
| Main Drive | FY8 3FF FY8 3UT |
| Moorland Road | FY8 3TD |
| Nateby Close | FY8 3PW |
| Newton Road | FY8 3JW |
| North Houses Lane | FY8 4NU |
| Otley Road | FY8 3QX |
| Parkside Road | FY8 3SZ |
| Pickering Close | FY8 3QU |
| Pilling Avenue | FY8 3FG FY8 3QF FY8 3WQ FY8 3QG FY8 3QP FY8 3QR |
| Poulton Avenue | FY8 3JR |
| Preesall Close | FY8 3PN |
| Queensway | FY8 3FQ |
| Ripley Drive | FY8 3NU |
| Roseacre Place | FY8 3JX |
| Salisbury Avenue | FY8 3FS |
| Shepherd Road | FY8 3NT FY8 3SP FY8 3SR FY8 3ST FY8 3SW FY8 3TQ FY8 3JN FY8 3SS |
| Shipley Road | FY8 3QS |
| Singleton Avenue | FY8 3JT FY8 3JU |
| St Davids Road South | FY8 1TY FY8 1TQ FY8 1TS FY8 1TT FY8 1FP |
| St Patricks Road South | FY8 1JW FY8 1LG FY8 1XN FY8 1XW |
| St Thomas Road | FY8 1JN FY8 1JP FY8 1JR FY8 1JU |
| States Road | FY8 3NX |
| Stratford Road | FY8 3TF |
| Sunningdale Court | FY8 3UP |
| The Croft | FY8 3RS |
| Thirsk Avenue | FY8 3QT |
| Thornton Avenue | FY8 3RL |
| Tims Drive | FY8 3UU FY8 3UW |
| Tudor Gate | FY8 3US |
| Unsworth Way | FY8 3FH |
| Waddington Road | FY8 3QD FY8 3RA FY8 3QA FY8 3QW |
| Warwick Road | FY8 1TX FY8 1XL FY8 1XJ |
| Wentworth Mews | FY8 3UN |
| Wildings Lane | FY8 3RJ |
| Winston Avenue | FY8 3NS |
Transport near Heyhouses
-
St.Annes-On-The-Sea Station
-
Ansdell and Fairhaven Station
-
Lytham Station
-
Squires Gate Station
-
Moss Side Station
-
Blackpool Pleasure Beach Station
- FAQ
- Price Paid By Year
- Property Type Price
Frequently asked questions about Heyhouses
What is the average price for a property for sale in Heyhouses?
The average price for a property for sale in Heyhouses is £233,253. This amount is 14% lower than the average price in Lytham St Annes. There are 1,791 property listings for sale in Heyhouses.
What streets have the most expensive properties for sale in Heyhouses?
The streets with the most expensive properties for sale in Heyhouses are Wildings Lane at an average of £1,300,000, St Patricks Road South at an average of £490,215 and Salisbury Avenue at an average of £424,944.
What streets have the most affordable properties for sale in Heyhouses?
The streets with the most affordable properties for sale in Heyhouses are Shipley Road at an average of £73,400, Nateby Close at an average of £80,000 and St Davids Road South at an average of £114,000.
Which train stations are available in or near Heyhouses?
Some of the train stations available in or near Heyhouses are St.Annes-On-The-Sea, Ansdell and Fairhaven and Lytham.
Property Price Paid in Heyhouses by Year
The average sold property price by year was:
| Year | Average Sold Price | Price Change |
Sold Properties
|
|---|---|---|---|
| 2025 | £241,646 | -0,2% |
71 Properties |
| 2024 | £242,030 | 10% |
100 Properties |
| 2023 | £218,807 | 2% |
102 Properties |
| 2022 | £215,137 | 7% |
115 Properties |
| 2021 | £200,248 | -5% |
140 Properties |
| 2020 | £210,703 | -10% |
95 Properties |
| 2019 | £231,122 | 25% |
140 Properties |
| 2018 | £172,971 | -12% |
118 Properties |
| 2017 | £193,473 | -3% |
129 Properties |
| 2016 | £198,642 | 6% |
159 Properties |
| 2015 | £186,170 | 4% |
111 Properties |
| 2014 | £178,111 | 18% |
92 Properties |
| 2013 | £146,215 | -3% |
76 Properties |
| 2012 | £149,985 | 11% |
60 Properties |
| 2011 | £132,783 | -20% |
51 Properties |
| 2010 | £159,982 | 1% |
51 Properties |
| 2009 | £158,071 | -1% |
69 Properties |
| 2008 | £160,068 | -8% |
68 Properties |
| 2007 | £173,374 | 1% |
128 Properties |
| 2006 | £171,707 | 5% |
117 Properties |
| 2005 | £162,686 | 3% |
130 Properties |
| 2004 | £157,857 | 21% |
142 Properties |
| 2003 | £124,725 | 20% |
140 Properties |
| 2002 | £100,035 | 19% |
166 Properties |
| 2001 | £81,460 | 15% |
148 Properties |
| 2000 | £69,269 | 7% |
100 Properties |
| 1999 | £64,221 | 5% |
148 Properties |
| 1998 | £60,710 | 3% |
107 Properties |
| 1997 | £58,961 | 9% |
150 Properties |
| 1996 | £53,590 | 8% |
115 Properties |
| 1995 | £49,116 | - |
89 Properties |
Property Price per Property Type in Heyhouses
Here you can find historic sold price data in order to help with your property search.
The average Property Paid Price for specific property types in the last three years are:
| Property Type | Average Sold Price | Sold Properties |
|---|---|---|
| Semi Detached House | £232,567.00 | 103 Semi Detached Houses |
| Detached House | £345,020.00 | 71 Detached Houses |
| Terraced House | £180,711.00 | 47 Terraced Houses |
| Flat | £129,499.00 | 52 Flats |

