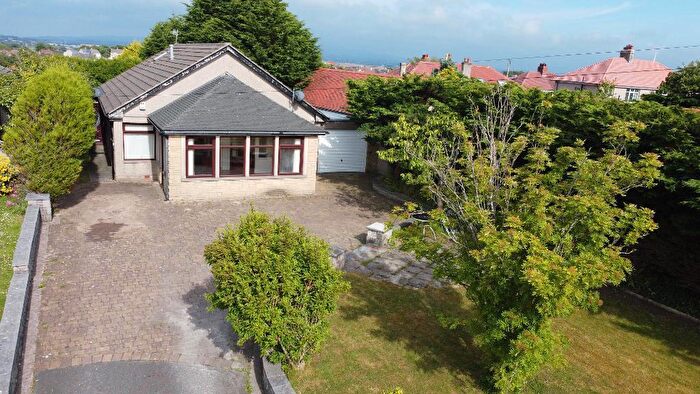
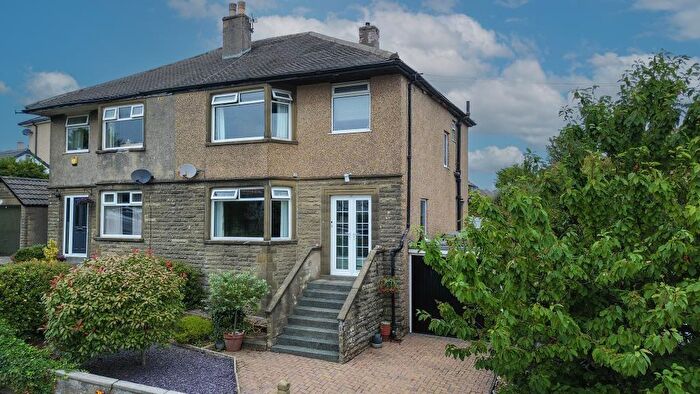
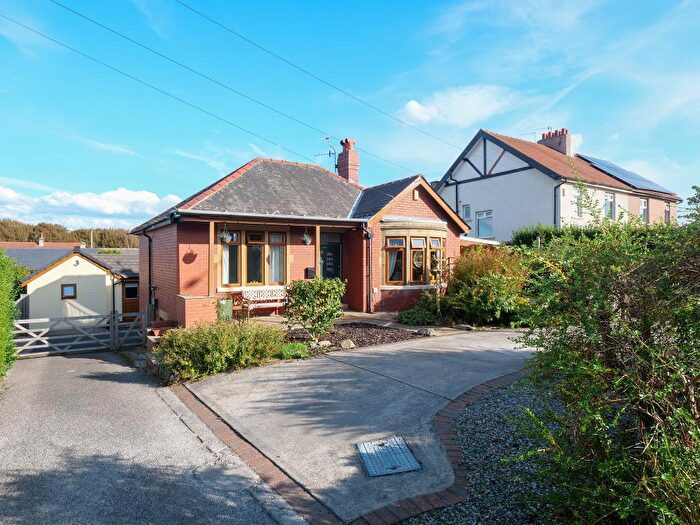
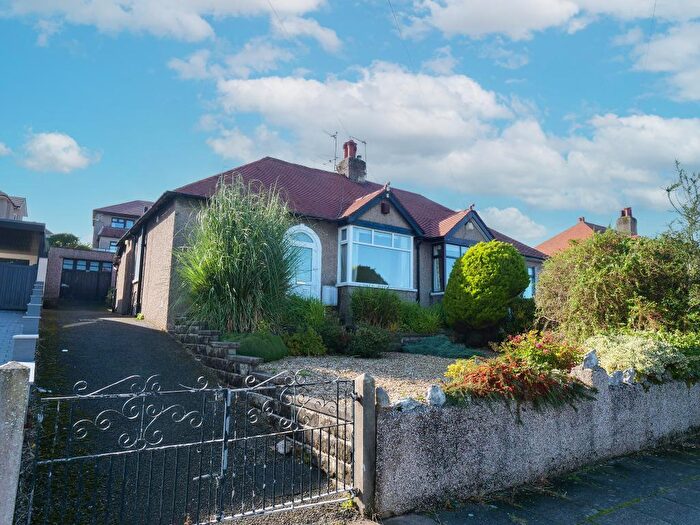
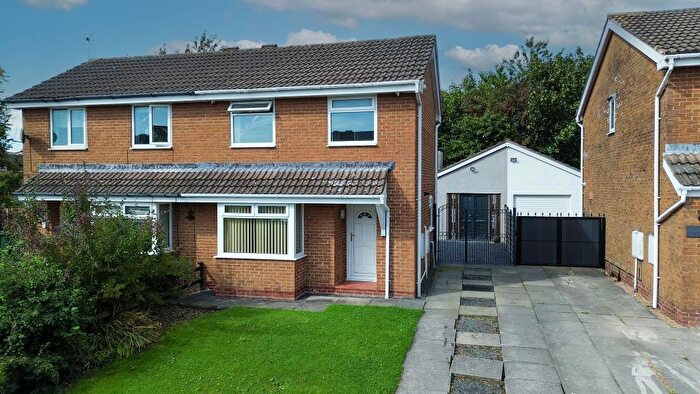
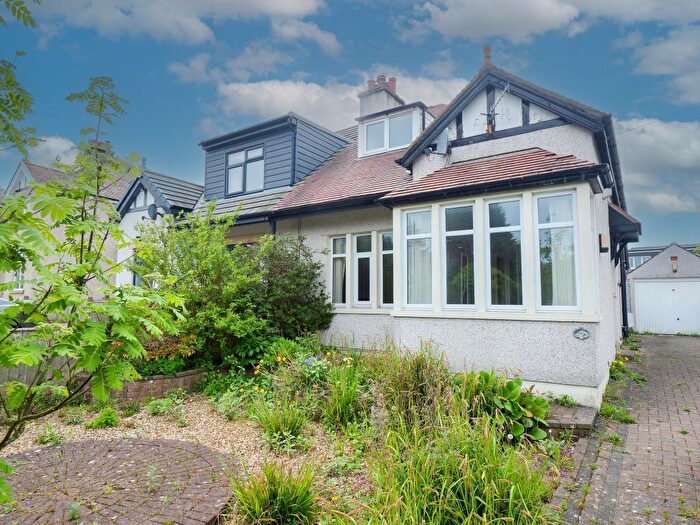
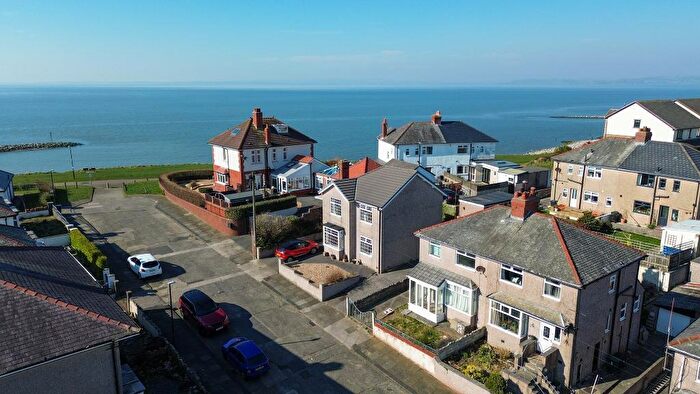
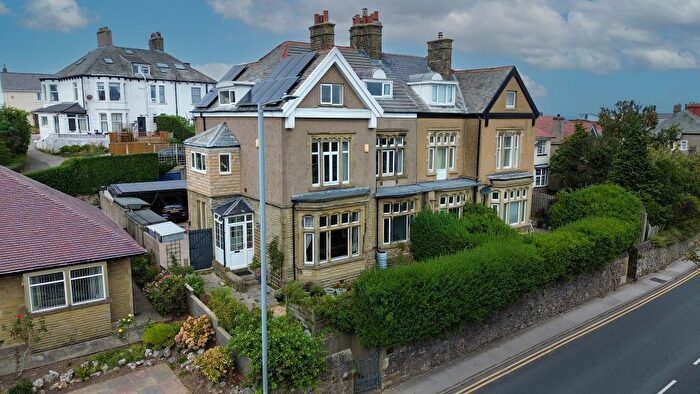
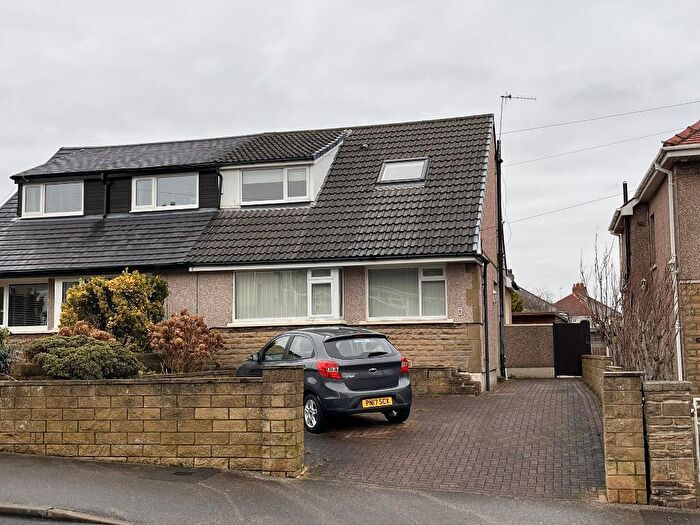
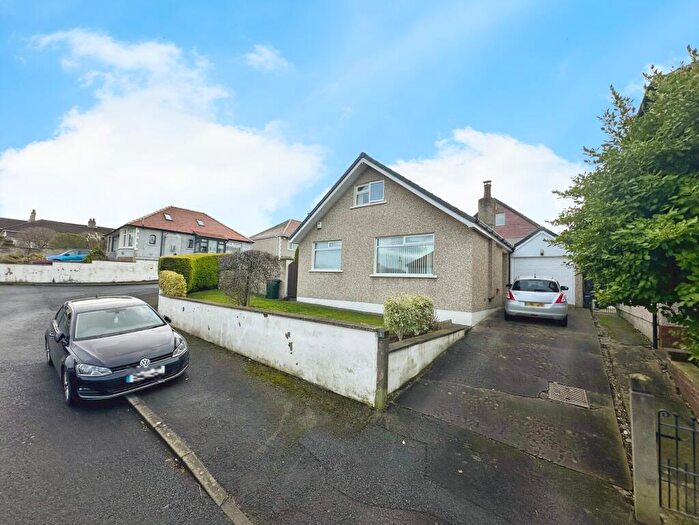
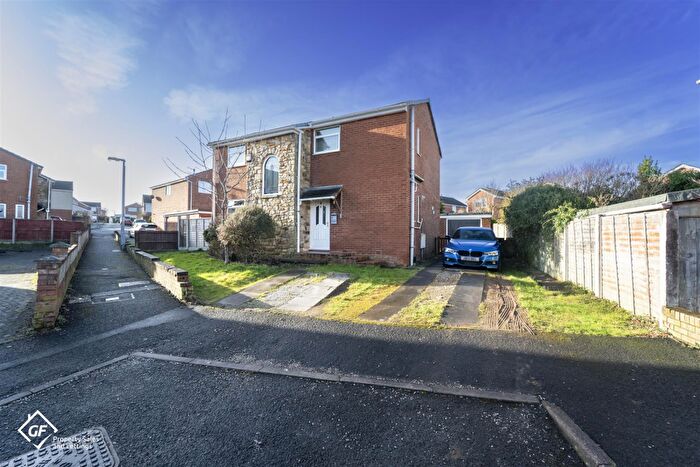
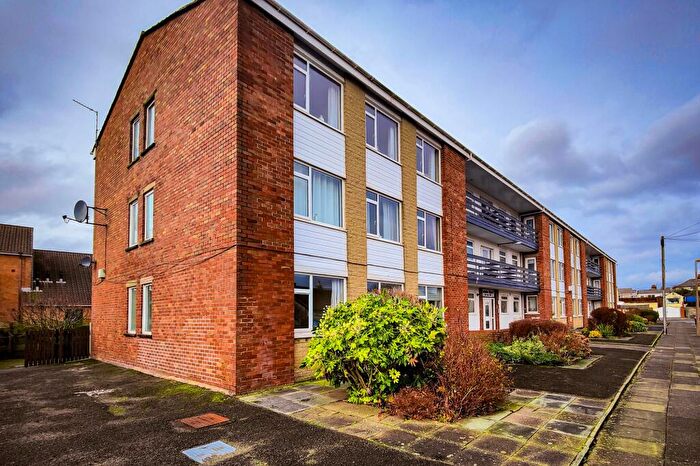
Houses for sale & to rent in Heysham Central, Morecambe
House Prices in Heysham Central
Properties in Heysham Central have an average house price of £204,361.00 and had 169 Property Transactions within the last 3 years¹.
Heysham Central is an area in Morecambe, Lancashire with 2,004 households², where the most expensive property was sold for £572,500.00.
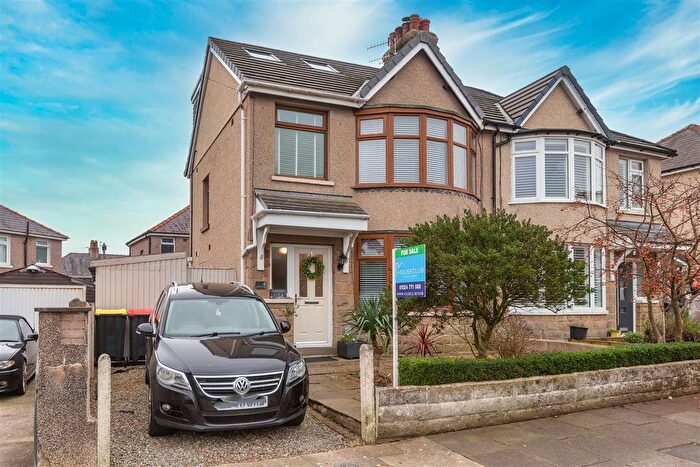
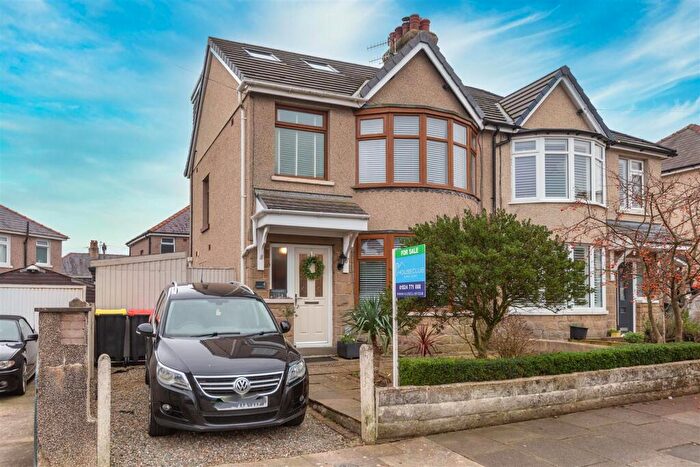
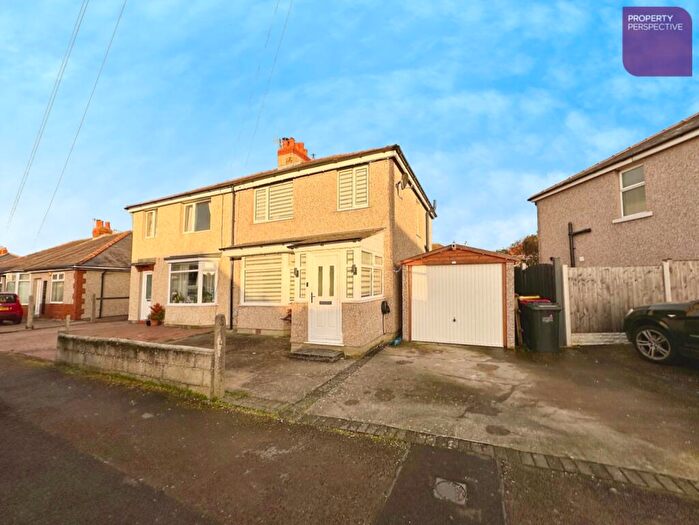
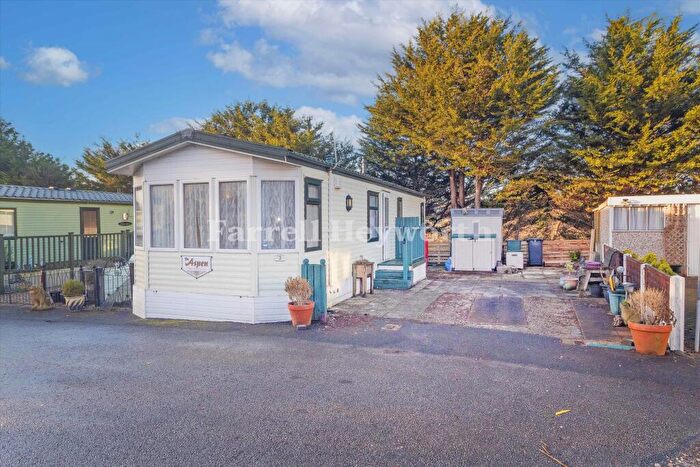
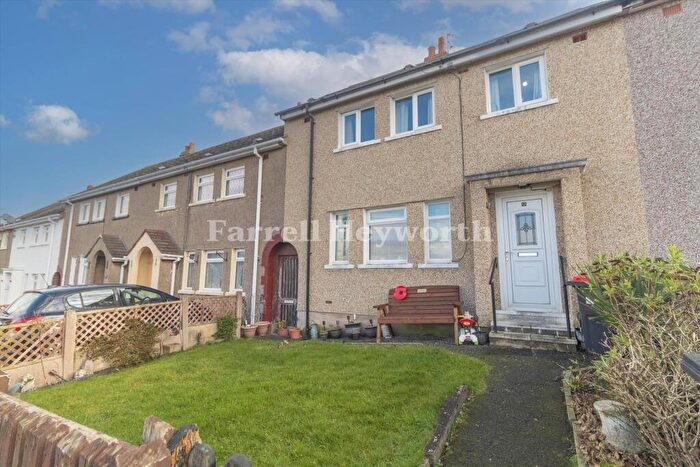
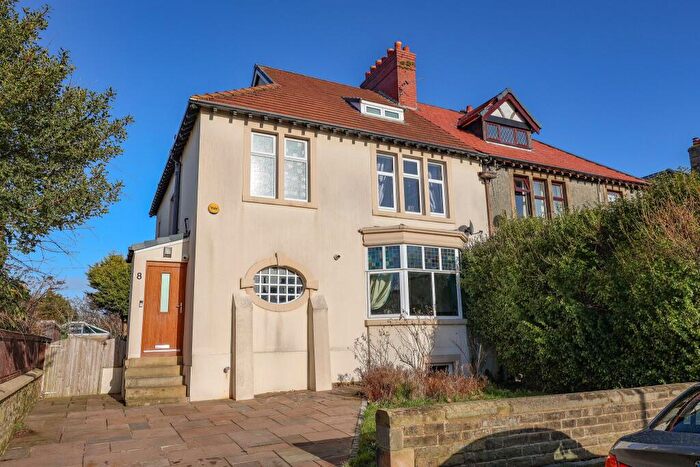
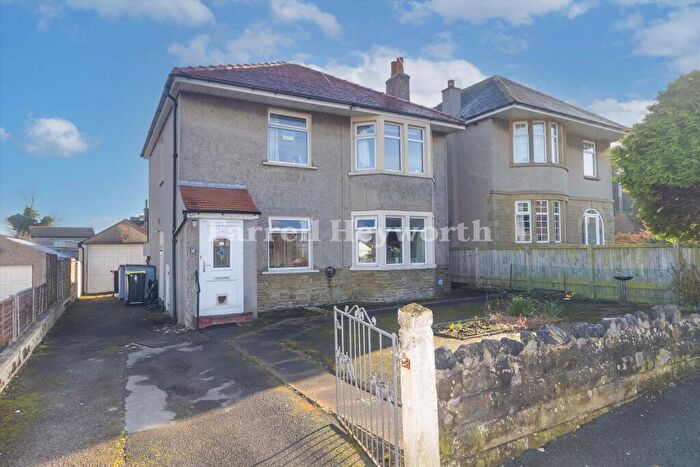
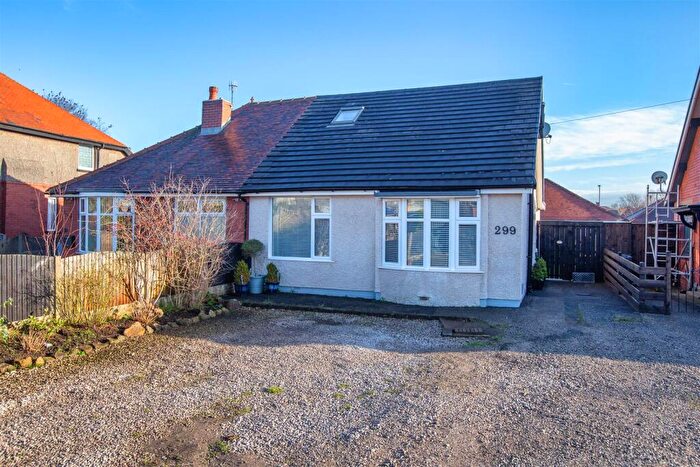
Properties for sale in Heysham Central
Roads and Postcodes in Heysham Central
Navigate through our locations to find the location of your next house in Heysham Central, Morecambe for sale or to rent.
| Streets | Postcodes |
|---|---|
| Arncliffe Road | LA3 2AT |
| Ashcroft | LA3 2AP |
| Back Knowlys Road | LA3 2NY |
| Birchtree Avenue | LA3 1NB |
| Blackberry Hall Crescent | LA3 2AQ |
| Bleasdale Grove | LA3 2EX |
| Boscombe Avenue | LA3 1LW |
| Bowland Road | LA3 2EN LA3 2EP LA3 2EW |
| Burnsall Avenue | LA3 2DT |
| Caroline Close | LA3 2NQ |
| Craiglands Avenue | LA3 1NX |
| Crofters Fold | LA3 2AH |
| Crookleigh Place | LA3 1EY |
| Crossdale Avenue | LA3 1PE |
| Dalton Road | LA3 1HB LA3 1HD |
| Deancroft Avenue | LA3 1NE |
| Draycombe Court | LA3 1NH |
| Draycombe Drive | LA3 1LN |
| Drewton Avenue | LA3 1NU |
| Fairfield Road | LA3 1ER LA3 1LP LA3 1LR LA3 1LS |
| Ferncliffe Drive | LA3 1NZ |
| Furness Road | LA3 1EZ |
| Grays Place | LA3 1JS |
| Grizedale Place | LA3 2EU |
| Grosvenor Road | LA3 1DS |
| Hale Carr Grove | LA3 2AD |
| Hale Carr Lane | LA3 2AE |
| Harrison Crescent | LA3 1PX |
| Hawksworth Grove | LA3 1LU |
| Haydock Grove | LA3 1PP |
| Heysham Avenue | LA3 2DH |
| Heysham Road | LA3 1DF LA3 1DJ LA3 1NL LA3 1NN LA3 1NP LA3 1NW LA3 1PY LA3 1PZ LA3 2AZ LA3 2BA LA3 2BJ LA3 2BP LA3 2BW LA3 2NZ |
| Kingsdale Avenue | LA3 2EA |
| Kingsway | LA3 2EB LA3 2ED LA3 2EE LA3 2AA LA3 2AB |
| Kingsway Court | LA3 2AG |
| Knowlys Avenue | LA3 2PA |
| Knowlys Crescent | LA3 2PB |
| Knowlys Drive | LA3 2PD |
| Linton Avenue | LA3 2BG |
| Littledale Avenue | LA3 2ER |
| Mallowdale Avenue | LA3 2ES |
| Meadowcroft Grove | LA3 1ND |
| Norland Drive | LA3 2DS |
| Norton Drive | LA3 1PH |
| Norton Grove | LA3 1PQ |
| Norton Place | LA3 1PJ |
| Norton Road | LA3 1HA LA3 1PF LA3 1PG |
| Oakley Road | LA3 1NR |
| Oxcliffe Avenue | LA3 1PT |
| Oxcliffe Grove | LA3 2AY |
| Oxcliffe Road | LA3 1LX LA3 1LY LA3 1PR LA3 1PS LA3 1PU |
| Parklands Grove | LA3 1NG |
| Penrith Avenue | LA3 2DJ |
| Roeburndale Crescent | LA3 2ET |
| Royds Avenue | LA3 1PA |
| Royds Grove | LA3 2AN |
| Rydal Grove | LA3 1DU |
| Rydal Road | LA3 1DT |
| Rylstone Drive | LA3 2AS LA3 2DY |
| Sandylands Promenade | LA3 1DP LA3 1DR LA3 1GW LA3 1NS |
| Seawell Avenue | LA3 1NT |
| Seawell Gardens | LA3 1NQ |
| St Johns Avenue | LA3 1EU |
| St Johns Grove | LA3 1ET |
| St Johns Road | LA3 1EX |
| Stansey Avenue | LA3 2AF |
| The Cliffs | LA3 1NY |
| Tibicar Drive East | LA3 2AR |
| Tibicar Drive West | LA3 2AU |
| Tranmere Avenue | LA3 2BB |
| Tranmere Crescent | LA3 2BD LA3 2BE |
| Twemlow Parade | LA3 1PD LA3 2AJ LA3 2AL LA3 2DL |
| Westboro Close | LA3 2AX |
| Whinnysty Lane | LA3 1PB |
| Willacy Parade | LA3 1LT |
| Woodlands Drive | LA3 1LZ |
Transport near Heysham Central
- FAQ
- Price Paid By Year
- Property Type Price
Frequently asked questions about Heysham Central
What is the average price for a property for sale in Heysham Central?
The average price for a property for sale in Heysham Central is £204,361. This amount is 8% higher than the average price in Morecambe. There are 1,346 property listings for sale in Heysham Central.
What streets have the most expensive properties for sale in Heysham Central?
The streets with the most expensive properties for sale in Heysham Central are St Johns Grove at an average of £572,500, Twemlow Parade at an average of £439,870 and Blackberry Hall Crescent at an average of £375,000.
What streets have the most affordable properties for sale in Heysham Central?
The streets with the most affordable properties for sale in Heysham Central are Draycombe Drive at an average of £95,000, Burnsall Avenue at an average of £115,000 and Dalton Road at an average of £136,000.
Which train stations are available in or near Heysham Central?
Some of the train stations available in or near Heysham Central are Morecambe, Heysham Port and Bare Lane.
Property Price Paid in Heysham Central by Year
The average sold property price by year was:
| Year | Average Sold Price | Price Change |
Sold Properties
|
|---|---|---|---|
| 2025 | £212,824 | 10% |
58 Properties |
| 2024 | £192,143 | -9% |
61 Properties |
| 2023 | £209,452 | 7% |
50 Properties |
| 2022 | £194,026 | 9% |
85 Properties |
| 2021 | £175,875 | 11% |
97 Properties |
| 2020 | £157,403 | -2% |
69 Properties |
| 2019 | £160,368 | 4% |
95 Properties |
| 2018 | £153,776 | -9% |
81 Properties |
| 2017 | £167,514 | 18% |
81 Properties |
| 2016 | £137,656 | 2% |
88 Properties |
| 2015 | £135,467 | 3% |
79 Properties |
| 2014 | £131,106 | 9% |
94 Properties |
| 2013 | £119,141 | -5% |
68 Properties |
| 2012 | £124,672 | -11% |
57 Properties |
| 2011 | £138,787 | 0,3% |
58 Properties |
| 2010 | £138,416 | 18% |
53 Properties |
| 2009 | £114,137 | -20% |
85 Properties |
| 2008 | £136,648 | -11% |
68 Properties |
| 2007 | £151,293 | 12% |
156 Properties |
| 2006 | £133,445 | 12% |
111 Properties |
| 2005 | £116,894 | 4% |
83 Properties |
| 2004 | £111,659 | 22% |
147 Properties |
| 2003 | £86,637 | 27% |
137 Properties |
| 2002 | £63,444 | 9% |
128 Properties |
| 2001 | £57,671 | 13% |
140 Properties |
| 2000 | £50,094 | 3% |
118 Properties |
| 1999 | £48,414 | -4% |
80 Properties |
| 1998 | £50,526 | 16% |
92 Properties |
| 1997 | £42,656 | -4% |
94 Properties |
| 1996 | £44,189 | -1% |
93 Properties |
| 1995 | £44,565 | - |
68 Properties |
Property Price per Property Type in Heysham Central
Here you can find historic sold price data in order to help with your property search.
The average Property Paid Price for specific property types in the last three years are:
| Property Type | Average Sold Price | Sold Properties |
|---|---|---|
| Semi Detached House | £206,506.00 | 96 Semi Detached Houses |
| Detached House | £351,893.00 | 15 Detached Houses |
| Terraced House | £196,093.00 | 32 Terraced Houses |
| Flat | £121,505.00 | 26 Flats |

