Houses for sale & to rent in Heysham North, Morecambe
House Prices in Heysham North
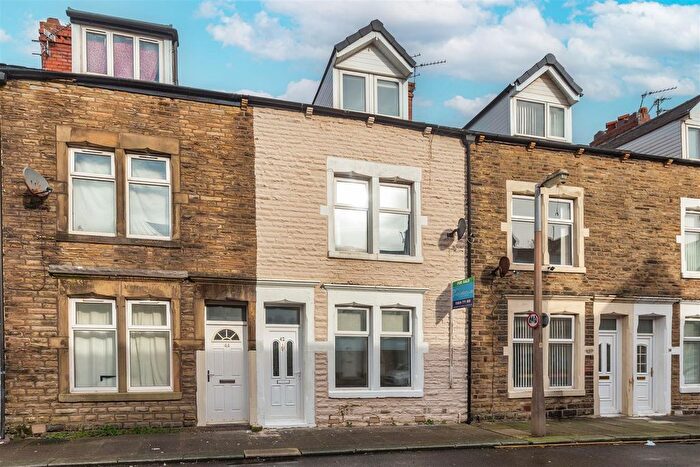
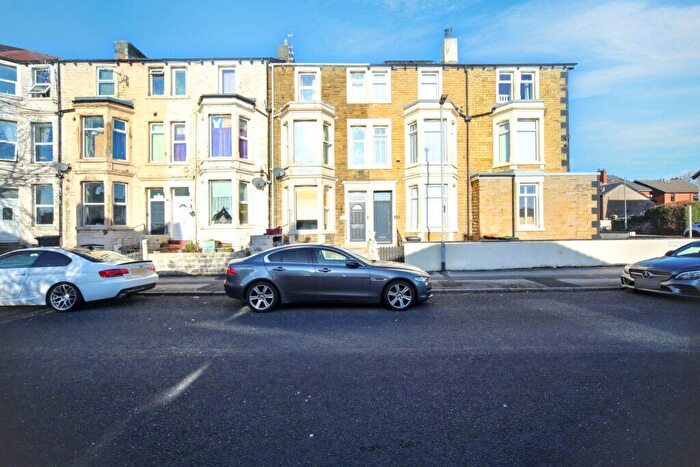
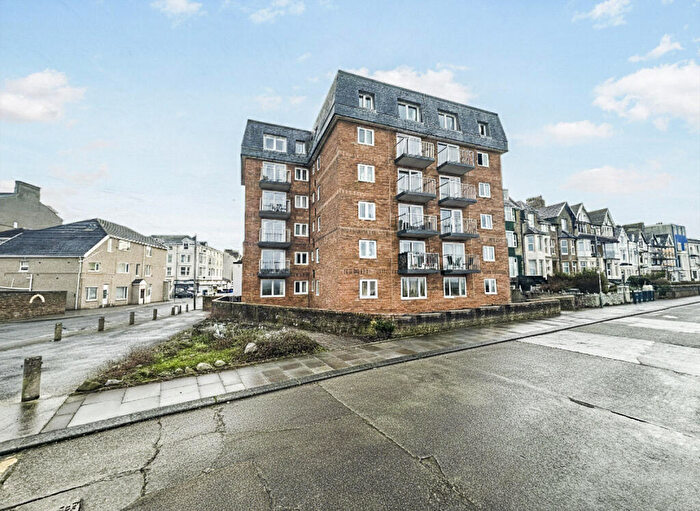
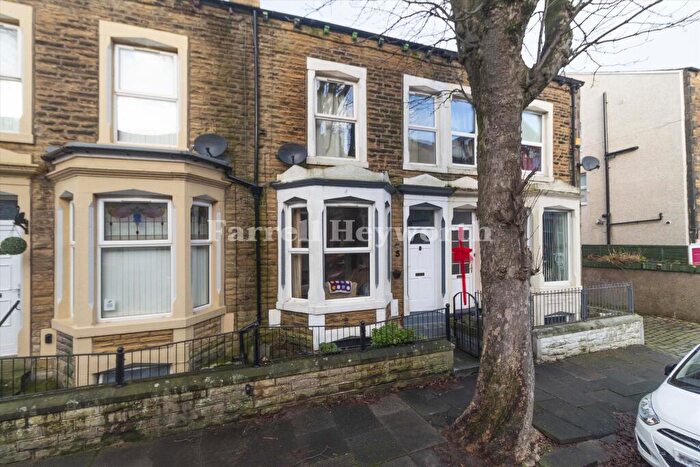
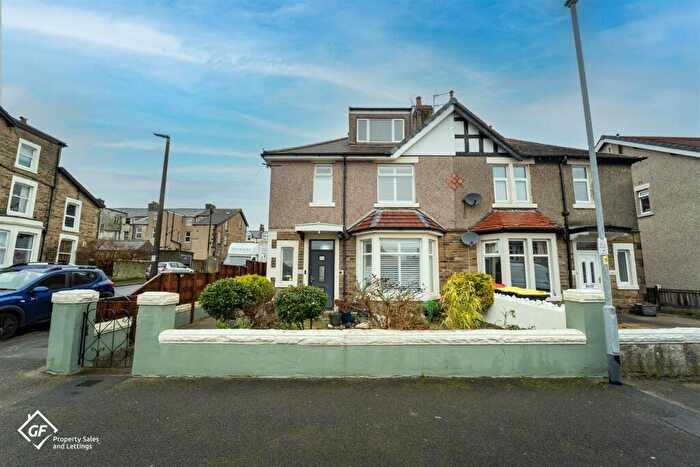
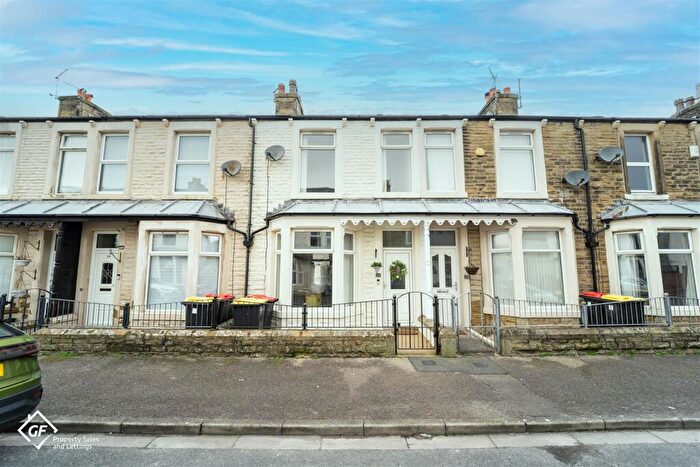
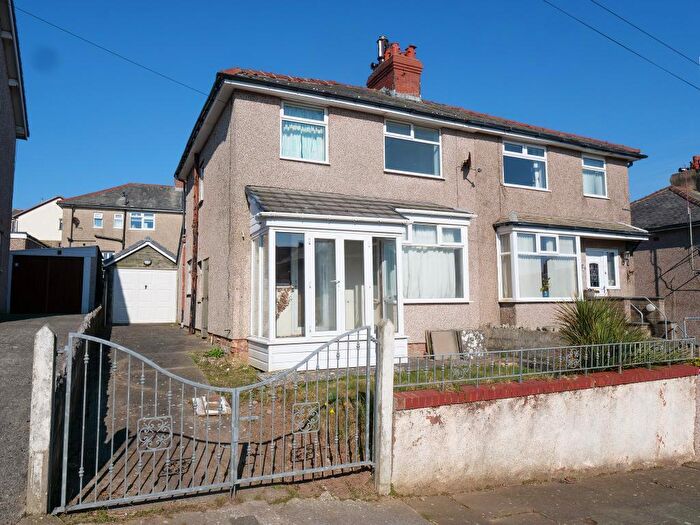
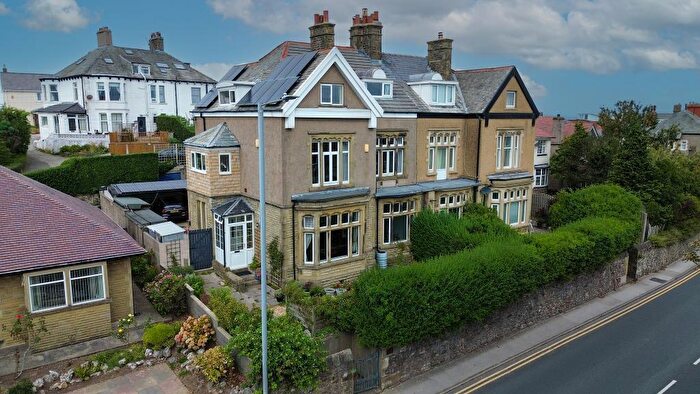
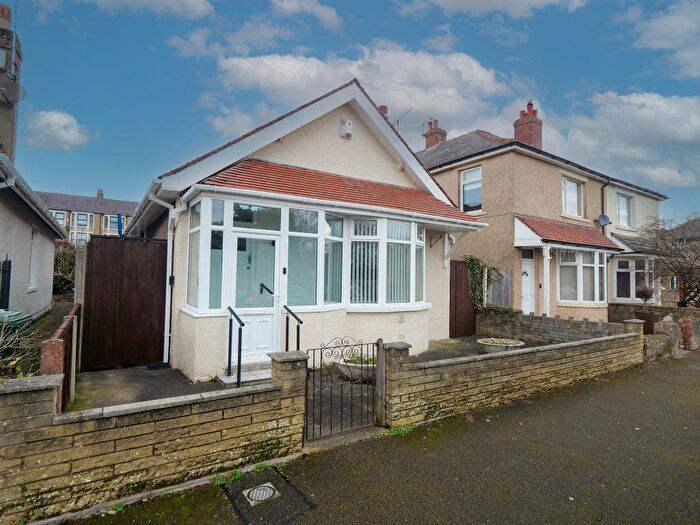
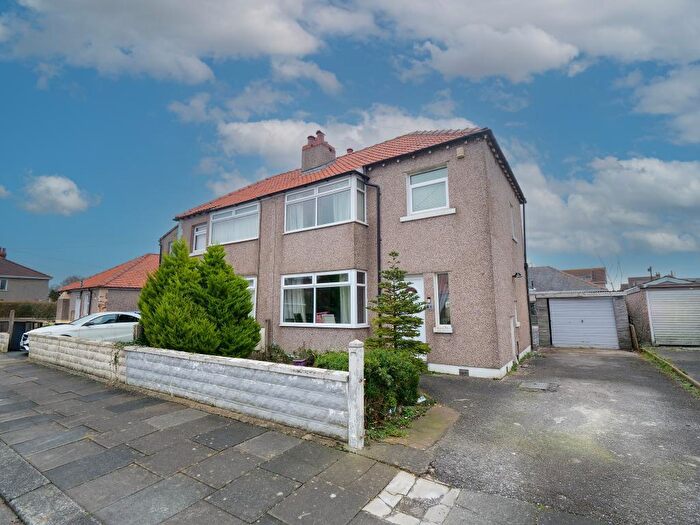
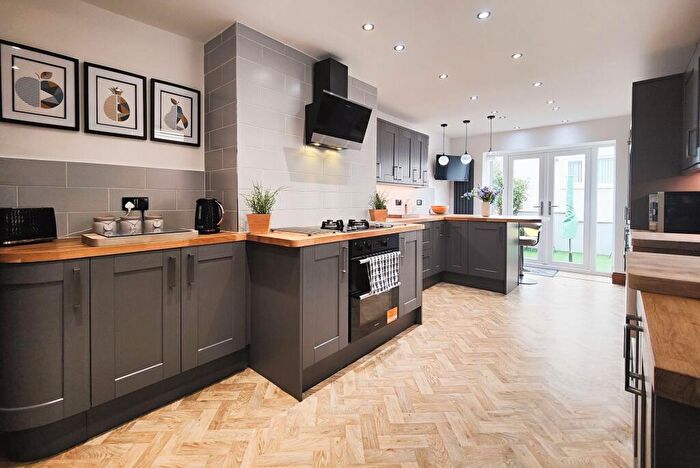
Properties in Heysham North have an average house price of £139,670.00 and had 278 Property Transactions within the last 3 years¹.
Heysham North is an area in Morecambe, Lancashire with 2,315 households², where the most expensive property was sold for £425,000.00.
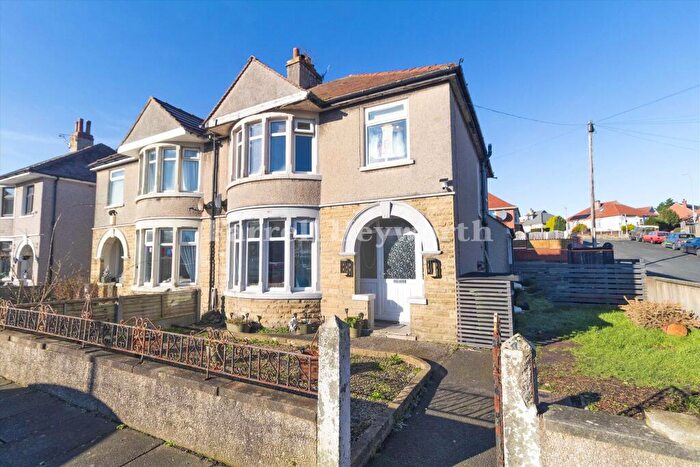
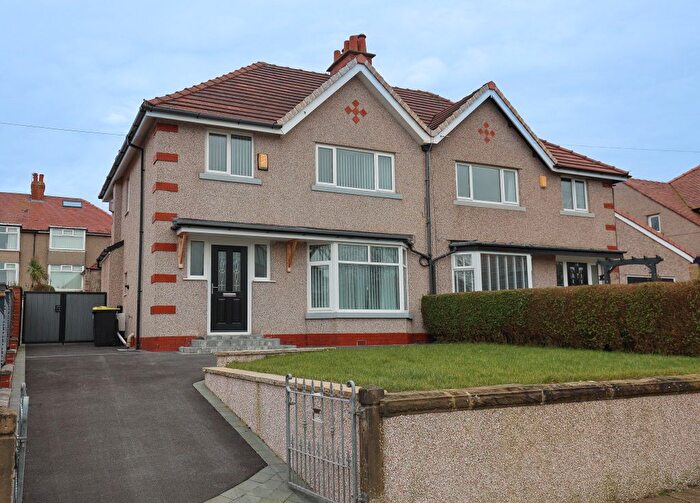
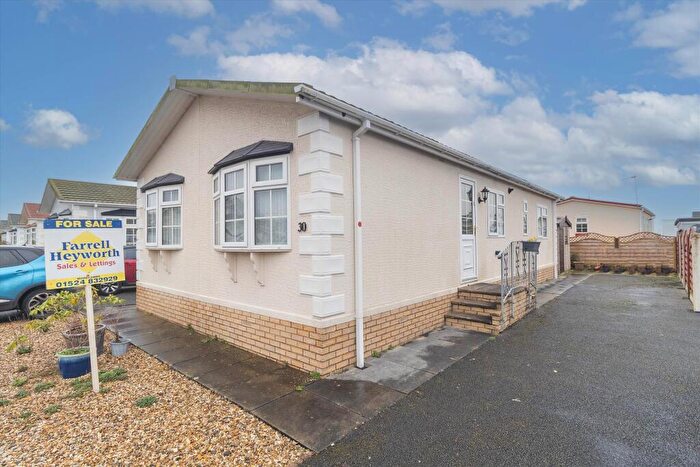
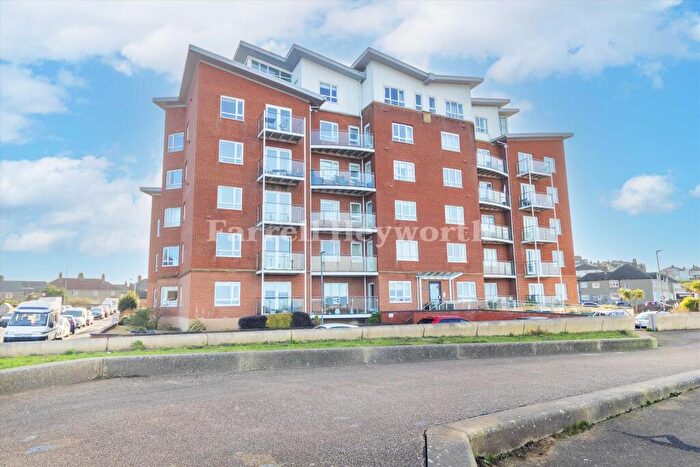
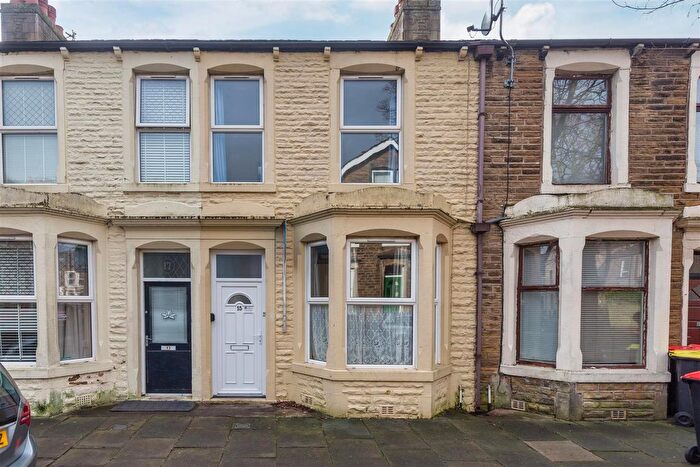
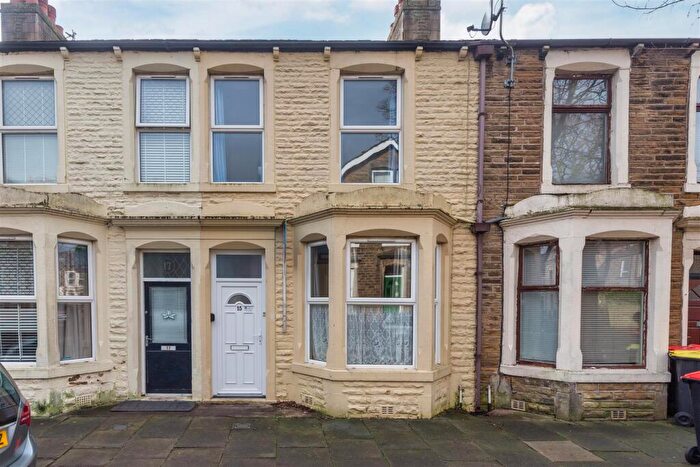
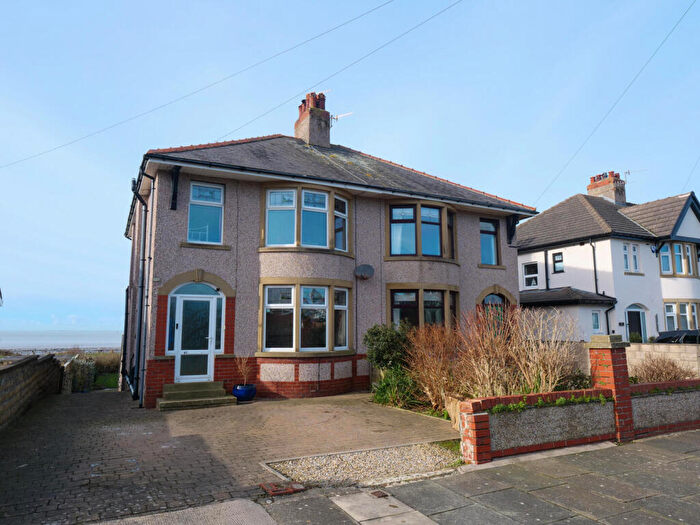
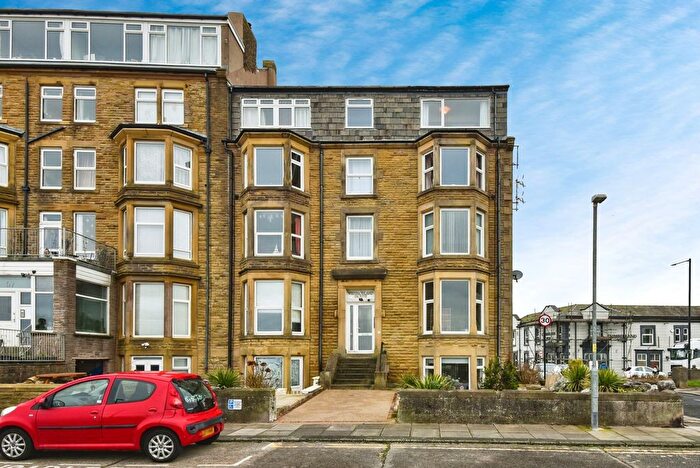
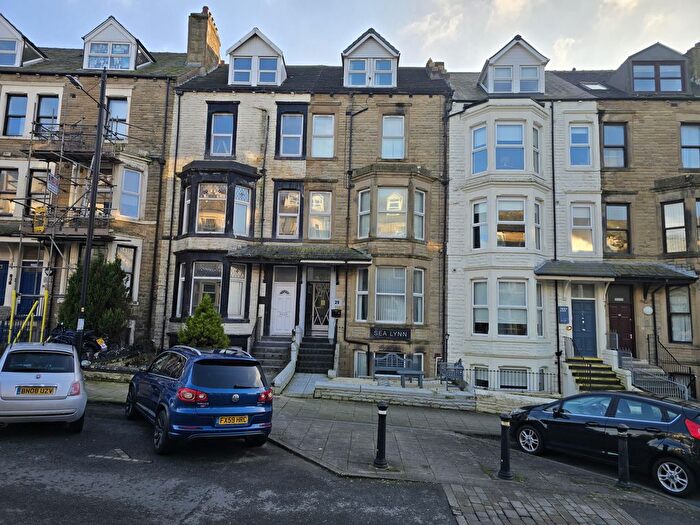
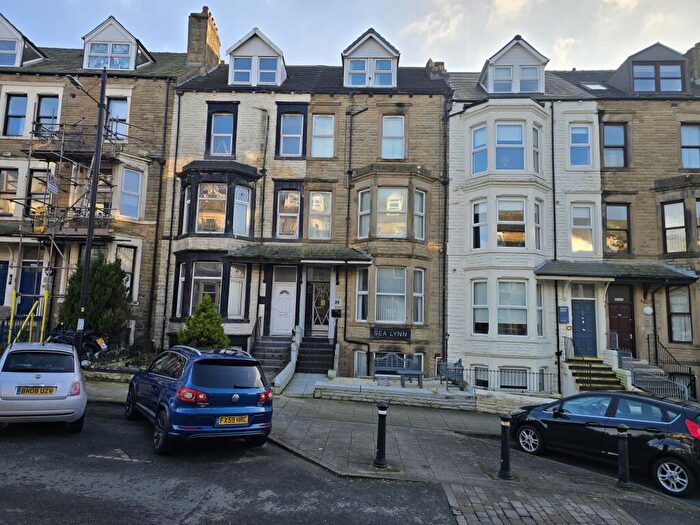
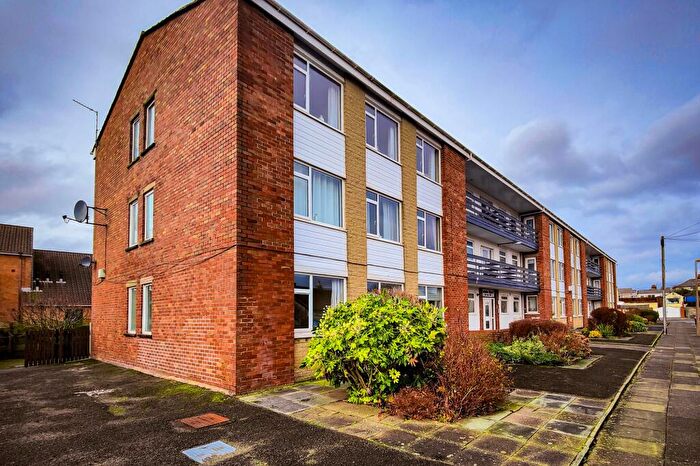
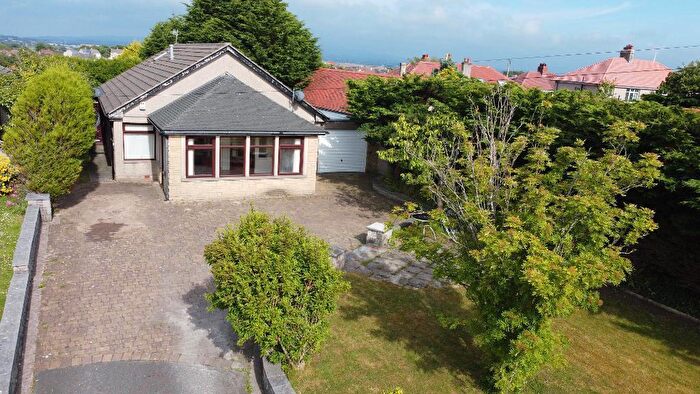
Properties for sale in Heysham North
Roads and Postcodes in Heysham North
Navigate through our locations to find the location of your next house in Heysham North, Morecambe for sale or to rent.
| Streets | Postcodes |
|---|---|
| Alexandra Road | LA3 1RN LA3 1RR LA3 1RS LA3 1RT LA3 1RW LA3 1TG LA3 1TH LA3 1TQ |
| Avondale Road | LA3 1SR |
| Back Avondale Road East | LA3 1SW |
| Back Avondale Road West | LA3 1JX |
| Back Heysham Road | LA3 1UU |
| Back Winterdyne Terrace | LA3 1TJ |
| Balmoral Avenue | LA3 1JU |
| Balmoral Road | LA3 1HH LA3 1HJ LA3 1HL LA3 1HN LA3 1HP LA3 1HW LA3 1SS LA3 1ST |
| Barnes Road | LA3 1UW |
| Bold Street | LA3 1TS |
| Brook Avenue | LA3 1BB |
| Brook Grove | LA3 1BA |
| Brook Road | LA3 1AX LA3 1AY LA3 1AZ |
| Brunswick Road | LA3 1RU LA3 1UG |
| Buckingham Grove | LA3 1BG |
| Buckingham Road | LA3 1BE |
| Burnham Court | LA3 1NJ |
| Byron Road | LA3 1UH LA3 1UQ |
| Cambridge Road | LA3 1RY |
| Cavendish Road | LA3 1TT LA3 1TU LA3 1TX |
| Chatsworth Road | LA3 1BL |
| Clarendon Road West | LA3 1SB LA3 1SD |
| Clevelands Avenue | LA3 1SX |
| Clevelands Grove | LA3 1SY |
| Clevelands Walk | LA3 1SU |
| Cumberland View Close | LA3 1HG |
| Cumberland View Road | LA3 1EE |
| Devonshire Road | LA3 1AN LA3 1AP LA3 1AW LA3 1QT LA3 1SF |
| East Street | LA3 1QR |
| Fairfield Grove | LA3 1JT |
| Fairfield Road | LA3 1ES LA3 1JP |
| Fox Grove | LA3 1HU |
| Gardner Road | LA3 1RX |
| Gloucester Drive | LA3 1EG |
| Grafton Place | LA3 1RZ |
| Grafton Road | LA3 1SA |
| Granville Road | LA3 1EB LA3 1ED |
| Halden Road | LA3 1EQ |
| Hampton Road | LA3 1EJ LA3 1EL |
| Harewood Avenue | LA3 1JH LA3 1JQ |
| Harrington Road | LA3 1EN |
| Henley Mews | LA3 1FD |
| Heysham Road | LA3 1DA LA3 1DB LA3 1DE LA3 1DG LA3 1DH LA3 1DQ LA3 1DY |
| Kings Crescent | LA3 1HX |
| Levens Drive | LA3 1JJ LA3 1JL LA3 1JN LA3 1JW |
| Limes Avenue | LA3 1HR LA3 1HS |
| Lordsome Road | LA3 1JB LA3 1JD LA3 1JE |
| Manor Grove | LA3 1JA |
| Maple Avenue | LA3 1HY LA3 1HZ |
| Marine Road West | LA3 1BS LA3 1BU |
| Marlborough Road | LA3 1TL LA3 1TP LA3 1TR LA3 1TW LA3 1TB |
| Mears Beck Close | LA3 1FL LA3 1FN LA3 1FP LA3 1FR LA3 1FS LA3 1FT LA3 1UX |
| Moorlands Grove | LA3 1LH |
| Myrtle Grove | LA3 1HT |
| Norfolk Avenue | LA3 1JF LA3 1JG |
| Norton Avenue | LA3 1HE |
| Oldest Barn Mews | LA3 1BF |
| Osborne Crescent | LA3 1SZ |
| Osborne Road | LA3 1AB |
| Parliament Street | LA3 1RH |
| Raglan Road | LA3 1EF |
| Regent Park Avenue | LA3 1AU |
| Sandylands Promenade | LA3 1DN LA3 1DW LA3 1HQ |
| Scott Road | LA3 1AL |
| Seathwaite Avenue | LA3 1JR |
| Sefton Road | LA3 1DX LA3 1DZ LA3 1TY LA3 1TZ LA3 1UA LA3 1UB LA3 1UD LA3 1UE |
| Stanley Road | LA3 1SP LA3 1UP LA3 1UR LA3 1UT |
| West Street | LA3 1RB LA3 1RG |
| Westminster Mews | LA3 1SQ |
| Westminster Road | LA3 1EP LA3 1EW LA3 1SH LA3 1SJ LA3 1SL LA3 1SN LA3 1UL LA3 1UN |
| Woodlands Drive | LA3 1NA |
| Woodlands Grove | LA3 1NF |
Transport near Heysham North
- FAQ
- Price Paid By Year
- Property Type Price
Frequently asked questions about Heysham North
What is the average price for a property for sale in Heysham North?
The average price for a property for sale in Heysham North is £139,670. This amount is 26% lower than the average price in Morecambe. There are 1,336 property listings for sale in Heysham North.
What streets have the most expensive properties for sale in Heysham North?
The streets with the most expensive properties for sale in Heysham North are Woodlands Grove at an average of £330,000, Fairfield Road at an average of £216,000 and Regent Park Avenue at an average of £195,000.
What streets have the most affordable properties for sale in Heysham North?
The streets with the most affordable properties for sale in Heysham North are Burnham Court at an average of £96,500, Marine Road West at an average of £98,125 and Clevelands Avenue at an average of £100,000.
Which train stations are available in or near Heysham North?
Some of the train stations available in or near Heysham North are Morecambe, Bare Lane and Heysham Port.
Property Price Paid in Heysham North by Year
The average sold property price by year was:
| Year | Average Sold Price | Price Change |
Sold Properties
|
|---|---|---|---|
| 2025 | £145,508 | 0,1% |
90 Properties |
| 2024 | £145,414 | 11% |
83 Properties |
| 2023 | £130,125 | -4% |
105 Properties |
| 2022 | £134,684 | 9% |
110 Properties |
| 2021 | £122,766 | 6% |
120 Properties |
| 2020 | £115,453 | 10% |
81 Properties |
| 2019 | £103,472 | 4% |
111 Properties |
| 2018 | £99,354 | - |
100 Properties |
| 2017 | £99,399 | 14% |
108 Properties |
| 2016 | £85,455 | -9% |
90 Properties |
| 2015 | £92,903 | 2% |
88 Properties |
| 2014 | £90,824 | 1% |
103 Properties |
| 2013 | £89,729 | -10% |
74 Properties |
| 2012 | £98,289 | 11% |
86 Properties |
| 2011 | £87,211 | -4% |
99 Properties |
| 2010 | £90,310 | -1% |
79 Properties |
| 2009 | £91,255 | -10% |
72 Properties |
| 2008 | £100,269 | -7% |
116 Properties |
| 2007 | £107,306 | 8% |
161 Properties |
| 2006 | £99,094 | 12% |
168 Properties |
| 2005 | £86,795 | 12% |
144 Properties |
| 2004 | £76,423 | 29% |
211 Properties |
| 2003 | £54,382 | 23% |
218 Properties |
| 2002 | £41,787 | 14% |
228 Properties |
| 2001 | £36,080 | 9% |
169 Properties |
| 2000 | £32,746 | 8% |
137 Properties |
| 1999 | £29,971 | -5% |
107 Properties |
| 1998 | £31,553 | 2% |
103 Properties |
| 1997 | £30,884 | 4% |
125 Properties |
| 1996 | £29,743 | -11% |
125 Properties |
| 1995 | £33,104 | - |
98 Properties |
Property Price per Property Type in Heysham North
Here you can find historic sold price data in order to help with your property search.
The average Property Paid Price for specific property types in the last three years are:
| Property Type | Average Sold Price | Sold Properties |
|---|---|---|
| Semi Detached House | £159,890.00 | 91 Semi Detached Houses |
| Detached House | £248,409.00 | 11 Detached Houses |
| Terraced House | £135,022.00 | 116 Terraced Houses |
| Flat | £98,054.00 | 60 Flats |

